
Cigar World
Executive Summary
Cigar World is a company designed to offer ‘The Fine Cigar,’ a cigar of the highest quality at a low and affordable price. This flagship product, which will be launched at the Retailers Tobacco Dealers of America (RTDA) in Las Vegas, will be delivered in three forms, premium bundle cigars, short filler cigars and the boxed premium cigars. Cigar World is a Raleigh based company, and our mission is to revolutionize the industry by producing high-quality products at affordable prices.
As with any company, Cigar World recognizes its risks. The company is working to determine trends in the industry, the needs of the customer, and how best to address the needs of the customer. We aim to provide customers with exemplary service and products to keep them coming back for more.
Our products are geared for a high-end market, which is comprised of males between the ages of 25 and 65, mainly professionals with medium to high income. On the large scale, our focus will be on wholesalers, retailers, and catalog companies.
We believe that after the necessary funding is obtained, the company can capture 5-10% of the bundle premium market in the United States and Canada and up to 5% of the world premium boxed market in an 18 to 24 month period. This market share represents revenues of $2,500,000 in Year 1 rising to $8,000,000 and $13,050,000 in Year 2 and Year 3 respectively.

1.1 Mission
At Cigar World our mission is to revolutionize the industry by producing high-quality products at affordable prices.
1.2 Keys to Success
- Offer customer service that is second to none. We take pride in addressing customer needs beyond their expectations, and in a timely manner.
- Our state-of-the-art quality control, which is the best in the industry, will help launch this company and enable us to compete with other companies in the market.
- We believe that we will have the best turnaround time. This coupled with our production flexibility will allow us to accommodate any customer regardless of size.
- The ‘Fine Cigar’ premium cigar has the best presentation in the industry.
- Cigar World is a member of the American Wholesaler Marketers Association, the Raleigh Chamber of Commerce, and is listed with Dunn and Bradstreet.
Company Summary
Our aim is to establish Cigar World as the company with the best customer service in the industry. Our unsurpassed customer service coupled with production flexibility and the best quality control in the industry will help launch this company and enable us to compete with other companies in the market. As far as production is concerned, we have the best turnaround time and flexibility that allows us to accommodate any customer of any size.
We have established a strong business to business telemarketing effort that is working very well to create new business for us. Although this is a big industry, less than 1% of the companies doing business today are as aggressive as we are in capturing new business. Members of our management team will be attending the Retailers Tobacco Dealers of America (RTDA) trade convention in Las Vegas, Nevada. It is at this convention where our products will be officially launched. Furthermore, the company has acquired a vehicle to be used by our sales representatives. This will allow us to better serve customers in the state of North Carolina.
We have acquired all the necessary permits at the federal, state, and county levels. At the present moment, there are no regulations as far as producing, importing, and commercializing cigars. Although a health-warning label is not mandatory for cigars, the company will place the labels as a matter of protection against the possibility of lawsuits.
2.1 Company Ownership
Cigar World is a North Carolina corporation and is owned, in equal shares, by:
- Michael Jones, president.
- Nathan Smith, vice president.
- John Thompson, production manager.
2.2 Company History
The table and chart below summarize Cigar World’s performance for the previous two fiscal years.
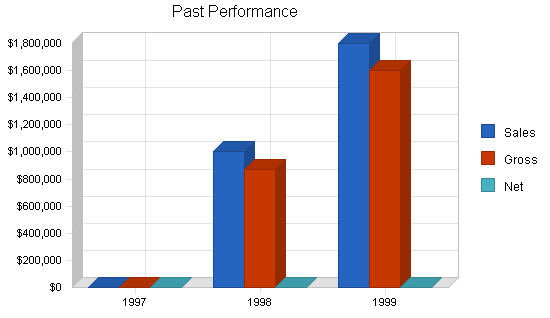
| Past Performance | |||
| 1997 | 1998 | 1999 | |
| Sales | $0 | $1,000,000 | $1,800,000 |
| Gross Margin | $0 | $870,000 | $1,600,000 |
| Gross Margin % | 0.00% | 87.00% | 88.89% |
| Operating Expenses | $0 | $350,000 | $400,000 |
| Collection Period (days) | 0 | 13 | 14 |
| Inventory Turnover | 0.00 | 6.00 | 6.00 |
| Balance Sheet | |||
| 1997 | 1998 | 1999 | |
| Current Assets | |||
| Cash | $0 | $40,000 | $40,000 |
| Accounts Receivable | $0 | $50,000 | $50,000 |
| Inventory | $0 | $5,000 | $5,000 |
| Other Current Assets | $0 | $35,000 | $35,000 |
| Total Current Assets | $0 | $130,000 | $130,000 |
| Long-term Assets | |||
| Long-term Assets | $0 | $25,000 | $25,000 |
| Accumulated Depreciation | $0 | $5,000 | $5,000 |
| Total Long-term Assets | $0 | $20,000 | $20,000 |
| Total Assets | $0 | $150,000 | $150,000 |
| Current Liabilities | |||
| Accounts Payable | $0 | $20,000 | $20,000 |
| Current Borrowing | $0 | $0 | $0 |
| Other Current Liabilities (interest free) | $0 | $0 | $0 |
| Total Current Liabilities | $0 | $20,000 | $20,000 |
| Long-term Liabilities | $0 | $100,000 | $100,000 |
| Total Liabilities | $0 | $120,000 | $120,000 |
| Paid-in Capital | $0 | $25,000 | $25,000 |
| Retained Earnings | $0 | $5,000 | $5,000 |
| Earnings | $0 | $0 | $0 |
| Total Capital | $0 | $30,000 | $30,000 |
| Total Capital and Liabilities | $0 | $150,000 | $150,000 |
| Other Inputs | |||
| Payment Days | 0 | 0 | 30 |
| Sales on Credit | $0 | $700,000 | $1,350,000 |
| Receivables Turnover | 0.00 | 14.00 | 27.00 |
Products
Cigar World has filed for a design patent for the box of our main product, ‘Fine Cigar.’ The message our packaging delivers is refinement and excellence. Our packaging, among other things, is exactly what sets us apart from the competition. The Fine Cigar is a cigar of the highest quality at an affordable price. Our flagship product will be launched at the Retailers Tobacco Dealers of America (RTDA) in Las Vegas, July 1999.
3.1 Product Description
The history of our ‘Fine Cigar’ project goes back to 1995. A few very knowledgeable tobacconists spent hundreds of hours trying to develop a great product that would be sold at an unbeatable price. Upon determining the needs of the people and developing our product, we designed a high powered presentation without paragon aimed at introducing our product to the world, and with that, the Fine Cigar was born. We are also planning to launch a limited edition of another wrapper that we will name the exquisite collection.
Our main product has been developed, we have filed for a design patent for our box, the blend of the cigar is done, and the cigar band has being designed. We have also filed for a trademark of the name. Our product will compete with well-known brands in the market such as Fuentes, Monte Cristo, Romeo, and Julianta. One problem we will be faced with is copycats or fake copies, for that reason, we have are filing a design patent to protect us against such individuals.
Like every other cigar, with the exception of machine made, all of our products are handmade. Production is done overseas in Jamaica. The space is adequate but we’re planning on relocating near the main airport in order to cut costs on ground transportation.
3.2 Future Products
Our research and development team is working on a new line of products that will revolutionize the industry. The company has spent well in excess of $100,000 since we started the ‘Fine Cigar’ project, our future plans include spending an additional $250,000 in the next 24 months.
In our research and development, all input comes from the consumer via our telephone marketing. We will be in need of substantial additional resources to facilitate the development and production of current and future products.
The following proposals are being considered for the future:
- ‘Fine Cigar’ exquisite collection.
- The ‘Bland Cigar’ line.
- Theme stores. Our company is also contemplating opening theme stores in the United States, Canada, and Europe.
Market Analysis Summary
The company is competing in the cigar segment of the alcohol and tobacco industry. In the United States, alcoholic beverages and tobacco products are considered big business. Combined, these industries’ retail sales reached approximately $148.3 billion in 1997. Of that total amount, tobacco products accounted for about $52.7 billion. Cigarettes accounted for nearly 94% of the total sales that year; the remaining 6% came from cigars, moist smokeless tobacco, chewing tobacco, and snuff.

The table below gives the production in harvest units of tobacco which is considered to be a principal crop. These figures were provided by the Agricultural Statistics Board.
| Year | Production of tobacco in harvest units (million pounds) |
| 1995 |
1,269 |
| 1996 |
1,517 |
| 1997 |
1,679 |
Of all the major tobacco product categories, cigars experienced the fastest unit growth in recent years, attributable in part to an upturn in luxury goods consumption in general. According to Tobacco Reporter magazine, U.S. consumption of cigars gained 14% in 1997 to 5.2 billion units. For 1998, the US Department of Agriculture (USDA) estimates that the total U.S. consumption of cigars rose 4% to 5.3 billion units. Per capita consumption (per male 18 years and over) increased from 36.9 to 37.8 cigars, rising for the fifth straight year.
The table below outlines the total market potential of Cigar World’s premium cigar products (in thousands of units). The company plans to reach a 5-10% market share in each of these subsegments in 24 months.
4.1 Market Segmentation
Our company is focusing on the high-end market of premium cigars which is comprised of males between the ages of 25-65 mainly professionals with a medium to high income. This segment of the population is the most profitable one due to a large disposable income. Our market segment comprises of value-conscious smokers.
On the large scale, our customers are wholesalers, retailers, and catalog companies.

| Market Analysis | |||||||
| 2000 | 2001 | 2002 | 2003 | 2004 | |||
| Potential Customers | Growth | CAGR | |||||
| Premium Bundle Cigars | 6% | 150,000 | 159,000 | 168,540 | 178,652 | 189,371 | 6.00% |
| Short Filler Cigars | 6% | 100,000 | 106,000 | 112,360 | 119,102 | 126,248 | 6.00% |
| Boxed Premium Cigars | 6% | 50,000 | 53,000 | 56,180 | 59,551 | 63,124 | 6.00% |
| Total | 6.00% | 300,000 | 318,000 | 337,080 | 357,305 | 378,743 | 6.00% |
4.2 Competition and Buying Patterns
We have developed a masterpiece when it comes to quality, presentation and, most importantly, price, but the competition is strong and in order for us to succeed we need to market this cigar aggressively.
Our staff has been interviewing prospective customers in all 50 states in order to get feedback from the customer. From these interviews we have determined that the market is ready for a new cigar brand, one that is a unique. Also, the price was determined by taking into consideration how much the customers are willing to pay for a new product.
4.3 Main Competitors
The major companies that compete in the market are:
- Fuentes. The Fuentes family has been making world class cigars for three generations. Their widespread popularity and great value makes them difficult to obtain, but well worth the effort. The Fuentes family’s tobacco roots go back to old-world Cuba of the 1800’s. Arturo Fuentes learned the art of cultivating tobacco and manufacturing handmade cigars from his father in Cuba. His son, Carlos, Sr., was virtually born into the cigar business as his first home served as the Fuentes cigar factory in Tampa. Carlos, Sr., worked at the factory everyday after school learning how to blend tobaccos and the ritual of rolling cigars by hand. In 1980 the Fuentes opened their first factory in the Jamaica with seven employees. The superior quality of the Arturo Fuentes® brand resulted in quickly establishing a loyal core of cigar customers which necessitated the building of a second factory. Today the Fuentes family has over 1,800 employees in four factories in Santiago, Jamaica. The Arturo Fuentes® brand is the most sought-after premium cigar in America.
- General Cigar Company. Macanudo and Partagas are the most famous names at General Cigar Company, but they’re not the only premium cigars. On the contrary, our premium cigars include Temple Hall Estates, a tribute to the island of Jamaica’s oldest and greatest tobacco tradition; Ramon Allones, a cigar that rose to fame long before Castro came into power; and Canaria d’Oro, a dark and rich cigar made in small quantities with a superb wrapper leaf grown in Mexico. The Macanudo Vintage Cabinet Selection cigars are not only few in number, they’re made only in the greatest of tobacco years. Not to be outdone, the Partagas Limited Reserve cigars are made from fewer than one in 100 Partagas tobacco leaves.
- Bahia Cigars. This story begins in the tasting grounds of California where Tony Borhani started something of a trend by introducing cigar appreciation to clients of his fine wine business. Within a year Tony was recognized with an annual award for his innovation by Market Watch (a sister publication of Cigar Aficionado) and soon after was much in demand by wine retailers to set up and open humidors throughout the USA. Bahia was the first boutique producer specializing in small batch production of gourmet cigars to be selected for the U.S. market by Tony Borhani and receive his personal guarantee against mass production and compromise in quality for any reason whatsoever. The introduction of the Bahia brand into the USA in 1994 caused a revolution in taste and appreciation of the world’s finest cigars. These cigars were made of Cuban seed tobacco, grown in Nicaragua of the 1988 harvest with a total production of 40,000 cigars.
4.4 Risks
The company recognizes that it is subject to both market and industry risks. The biggest risk involved is the continuing pressure of the United States government over any tobacco product. At this time, however, Federal regulations are very lenient with cigars.
Strategy and Implementation Summary
Our sales and marketing strategies are discussed in the following topics.
5.1 Value Proposition
Cigar World offers the following value proposition for customers:
- Presentation. The ‘Fine Cigar’ premium cigar has the best presentation in the industry.
- Extremely competitive prices. We have prices that are very affordable.
- Quality. The quality of the ‘Fine Cigar’ is as good as that of major brands.
- Customer service. Customers can count on us to deliver on time and can easily reach us whenever they need to.
5.2 Distribution Strategy
Our customers are satisfied with the quality of customer service we have provided. The company is currently offering a toll-free line for customer service. Due to the nature of our product we only offer a full return on box damage due to shipping, we do not offer money back guarantee on the cigars itself, the customer can return the merchandise before accepting it. Customers can reach us by email, fax, or our 800 number.
5.3 Marketing Strategy
In marketing our products and services, we will rely on a combination of the following channels:
- Trade shows. This is a highly effective medium, allowing us to showcase our products, make contact with industry leaders, and keep abreast with the changes and advancements in product selection, manufacturing, and delivery.
- Telephone solicitations. Our telephone solicitation concept is very unique, we have not heard of a cigar company using this concept as a marketing tool. The competition prefers to attend trade shows and place magazine ads. Our company has, in addition to other channels, been using the phones aggressively with much success.
- Direct mail. Direct mail is probably the most flexible medium of all. A direct mail piece and the program of which it is a part can be almost whatever we want it to be. With this approach, we can send coupons, make direct selling offers, select the audience by name, and set whatever distribution schedule is most desirable, without being constrained by the publication or broadcast schedules of the major media.
- Personal visits from our sales representatives. This is a method we feel will be highly effective especially in the North Carolina area. A van has been purchased for the sole use of the sales representatives. We believe that will allow for efficiency, smooth operation, and put us in direct contact with the clients and major decision-makers.
- Website. A website has been developed and this will be one of the major communication channels. Use of the Internet is growing and more and more people are using it in place of the traditional methods to look for services and even to do their shopping.
The message associated with our products is high quality at affordable prices. In monitoring our products, service and market position, we will rely on feedback from customers with whom we have relationships. This will be done through direct mail and telephone solicitations. Our promotional plan is diverse and will include a range of marketing communications. Future plans call for company owned stores nationwide and in Europe, and the establishment of a magazine ad campaign.
The table below summarized our sales forecast for fiscal year 2000-2002.
5.4 Sales Forecast
Cigar World forecasts modest but steady growth in sales during the first year of this plan. As new releases are added to the product offerings, marketing increases our exposure in our target segments, and the smoking of cigars gains greater acceptance as a cultural trend we anticipate skyrocketing sales in year two and three.
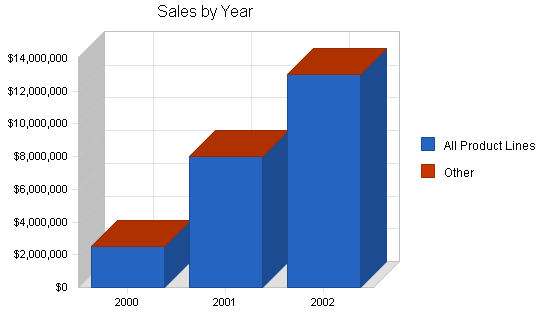
| Sales Forecast | |||
| 2000 | 2001 | 2002 | |
| Sales | |||
| All Product Lines | $2,500,000 | $8,000,000 | $13,050,000 |
| Other | $0 | $0 | $0 |
| Total Sales | $2,500,000 | $8,000,000 | $13,050,000 |
| Direct Cost of Sales | 2000 | 2001 | 2002 |
| All Product Lines | $100,000 | $370,000 | $400,000 |
| Other | $0 | $0 | $0 |
| Subtotal Direct Cost of Sales | $100,000 | $370,000 | $400,000 |
5.5 Strategic Alliances
We are currently in the process of negotiating a merger with Cigar Maker, a cigar producer in Jamaica. Once complete, this merger will enable us to secure a production of one million cigars a month with the potential to double this capacity at short notice. Also, upon completion of the merger, plans have been made to relocate to a much larger facility close to the main airport in Jamaica. We believe that this will expedite the dispatching of orders and enable us to develop this facility as a tourist attraction.
Management Summary
At Cigar World, our management philosophy is based on responsibility, hard work, and an immense desire to succeed. Below is a list of our key officers and their backgrounds.
Key Officers:
- Michael Jones, president.
- Nathan Smith, vice president.
- John Thompson, production manager.
Confidential and Proprietary resume information has been omitted from this sample plan.
| Personnel Plan | |||
| 2000 | 2001 | 2002 | |
| President | $36,000 | $43,200 | $47,500 |
| Vice president | $36,000 | $43,200 | $47,500 |
| Production manager | $36,000 | $43,200 | $47,500 |
| Workers | $132,000 | $271,500 | $323,500 |
| Other | $0 | $0 | $0 |
| Total People | 10 | 15 | 16 |
| Total Payroll | $240,000 | $401,100 | $466,000 |
Financial Plan
Based on our projections, we feel a loan to our company is a sound investment. In order to proceed, we are requesting a loan of $150,000. The funds will be used for manufacturing and production, marketing, and to cover initial operating expenses. The company is planning on going public within the next 12 to 18 months and this will provide additional funds to repay the loan. We can provide an exit for this loan immediately after going public by a recapitalization of funds.
7.1 Business Ratios
The following table contains important ratios from the Tobacco and Tobacco Products industry (SIC 5194), as determined by the Standard Industry Classification (SIC) Index.
| Ratio Analysis | ||||
| 2000 | 2001 | 2002 | Industry Profile | |
| Sales Growth | 38.89% | 220.00% | 63.13% | 8.50% |
| Percent of Total Assets | ||||
| Accounts Receivable | 22.85% | 18.42% | 13.18% | 29.90% |
| Inventory | 0.68% | 0.64% | 0.30% | 27.70% |
| Other Current Assets | 2.01% | 0.51% | 0.22% | 24.50% |
| Total Current Assets | 95.75% | 97.63% | 98.26% | 82.10% |
| Long-term Assets | 4.25% | 2.37% | 1.74% | 17.90% |
| Total Assets | 100.00% | 100.00% | 100.00% | 100.00% |
| Current Liabilities | 13.71% | 3.97% | 2.39% | 46.30% |
| Long-term Liabilities | 4.92% | 0.98% | 0.30% | 10.90% |
| Total Liabilities | 18.64% | 4.95% | 2.70% | 57.20% |
| Net Worth | 81.36% | 95.05% | 97.30% | 42.80% |
| Percent of Sales | ||||
| Sales | 100.00% | 100.00% | 100.00% | 100.00% |
| Gross Margin | 95.80% | 95.25% | 96.86% | 22.90% |
| Selling, General & Administrative Expenses | 40.46% | 30.77% | 28.99% | 16.20% |
| Advertising Expenses | 2.00% | 1.25% | 0.77% | 0.70% |
| Profit Before Interest and Taxes | 75.16% | 86.19% | 90.28% | 1.30% |
| Main Ratios | ||||
| Current | 6.98 | 24.61 | 41.08 | 1.72 |
| Quick | 6.93 | 24.45 | 40.96 | 0.95 |
| Total Debt to Total Assets | 18.64% | 4.95% | 2.70% | 57.20% |
| Pre-tax Return on Net Worth | 130.79% | 104.58% | 76.65% | 3.30% |
| Pre-tax Return on Assets | 106.41% | 99.40% | 74.59% | 7.70% |
| Additional Ratios | 2000 | 2001 | 2002 | |
| Net Profit Margin | 55.53% | 64.47% | 67.26% | n.a |
| Return on Equity | 97.88% | 78.43% | 57.17% | n.a |
| Activity Ratios | ||||
| Accounts Receivable Turnover | 4.71 | 4.71 | 4.71 | n.a |
| Collection Days | 57 | 51 | 63 | n.a |
| Inventory Turnover | 10.91 | 13.25 | 8.75 | n.a |
| Accounts Payable Turnover | 9.80 | 12.17 | 12.17 | n.a |
| Payment Days | 28 | 22 | 25 | n.a |
| Total Asset Turnover | 1.43 | 1.16 | 0.83 | n.a |
| Debt Ratios | ||||
| Debt to Net Worth | 0.23 | 0.05 | 0.03 | n.a |
| Current Liab. to Liab. | 0.74 | 0.80 | 0.89 | n.a |
| Liquidity Ratios | ||||
| Net Working Capital | $1,429,924 | $6,479,464 | $15,127,078 | n.a |
| Interest Coverage | 77.36 | 367.18 | 931.63 | n.a |
| Additional Ratios | ||||
| Assets to Sales | 0.70 | 0.86 | 1.21 | n.a |
| Current Debt/Total Assets | 14% | 4% | 2% | n.a |
| Acid Test | 5.27 | 19.81 | 35.45 | n.a |
| Sales/Net Worth | 1.76 | 1.22 | 0.85 | n.a |
| Dividend Payout | 0.00 | 0.00 | 0.00 | n.a |
7.2 Important Assumptions
The table below shows the assumptions that are important to the success of Cigar World.
| General Assumptions | |||
| 2000 | 2001 | 2002 | |
| Plan Month | 1 | 2 | 3 |
| Current Interest Rate | 10.00% | 10.00% | 10.00% |
| Long-term Interest Rate | 10.00% | 10.00% | 10.00% |
| Tax Rate | 25.42% | 25.00% | 25.42% |
| Other | 0 | 0 | 0 |
7.3 Break-even Analysis
As the table below shows, Cigar World’s margins provide enough resources to break-even.

| Break-even Analysis | |
| Monthly Revenue Break-even | $44,792 |
| Assumptions: | |
| Average Percent Variable Cost | 4% |
| Estimated Monthly Fixed Cost | $43,000 |
7.4 Projected Profit and Loss
The table below shows our projected income statement.


| Pro Forma Profit and Loss | |||
| 2000 | 2001 | 2002 | |
| Sales | $2,500,000 | $8,000,000 | $13,050,000 |
| Direct Cost of Sales | $100,000 | $370,000 | $400,000 |
| Other | $5,000 | $10,000 | $10,000 |
| Total Cost of Sales | $105,000 | $380,000 | $410,000 |
| Gross Margin | $2,395,000 | $7,620,000 | $12,640,000 |
| Gross Margin % | 95.80% | 95.25% | 96.86% |
| Expenses | |||
| Payroll | $240,000 | $401,100 | $466,000 |
| Sales and Marketing and Other Expenses | $218,000 | $230,000 | $295,000 |
| Depreciation | $6,000 | $10,000 | $10,000 |
| Utilities | $2,000 | $3,500 | $4,000 |
| Insurance | $10,000 | $15,000 | $15,000 |
| Rent | $2,500 | $5,000 | $5,000 |
| Payroll Taxes | $37,500 | $60,000 | $63,750 |
| Other | $0 | $0 | $0 |
| Total Operating Expenses | $516,000 | $724,600 | $858,750 |
| Profit Before Interest and Taxes | $1,879,000 | $6,895,400 | $11,781,250 |
| EBITDA | $1,885,000 | $6,905,400 | $11,791,250 |
| Interest Expense | $24,290 | $18,780 | $12,646 |
| Taxes Incurred | $466,585 | $1,719,155 | $2,991,187 |
| Net Profit | $1,388,125 | $5,157,465 | $8,777,417 |
| Net Profit/Sales | 55.53% | 64.47% | 67.26% |
7.5 Projected Cash Flow
The company’s cash reserves are sufficient for everyday operations and investments.

| Pro Forma Cash Flow | |||
| 2000 | 2001 | 2002 | |
| Cash Received | |||
| Cash from Operations | |||
| Cash Sales | $625,000 | $2,000,000 | $3,262,500 |
| Cash from Receivables | $1,526,750 | $5,123,850 | $8,983,035 |
| Subtotal Cash from Operations | $2,151,750 | $7,123,850 | $12,245,535 |
| Additional Cash Received | |||
| Sales Tax, VAT, HST/GST Received | $0 | $0 | $0 |
| New Current Borrowing | $150,000 | $0 | $0 |
| New Other Liabilities (interest-free) | $0 | $0 | $0 |
| New Long-term Liabilities | $0 | $0 | $0 |
| Sales of Other Current Assets | $0 | $0 | $0 |
| Sales of Long-term Assets | $0 | $0 | $0 |
| New Investment Received | $0 | $0 | $0 |
| Subtotal Cash Received | $2,301,750 | $7,123,850 | $12,245,535 |
| Expenditures | 2000 | 2001 | 2002 |
| Expenditures from Operations | |||
| Cash Spending | $240,000 | $401,100 | $466,000 |
| Bill Payments | $803,720 | $2,350,065 | $3,690,286 |
| Subtotal Spent on Operations | $1,043,720 | $2,751,165 | $4,156,286 |
| Additional Cash Spent | |||
| Sales Tax, VAT, HST/GST Paid Out | $0 | $0 | $0 |
| Principal Repayment of Current Borrowing | $0 | $78,081 | $6,864 |
| Other Liabilities Principal Repayment | $0 | $0 | $0 |
| Long-term Liabilities Principal Repayment | $14,201 | $17,926 | $19,803 |
| Purchase Other Current Assets | $0 | $0 | $0 |
| Purchase Long-term Assets | $60,000 | $100,000 | $120,000 |
| Dividends | $0 | $0 | $0 |
| Subtotal Cash Spent | $1,117,921 | $2,947,172 | $4,302,953 |
| Net Cash Flow | $1,183,829 | $4,176,678 | $7,942,582 |
| Cash Balance | $1,223,829 | $5,400,507 | $13,343,089 |
7.6 Projected Balance Sheet
The company’s projected balance sheets for fiscal year 2000-2002 are provided below.
| Pro Forma Balance Sheet | |||
| 2000 | 2001 | 2002 | |
| Assets | |||
| Current Assets | |||
| Cash | $1,223,829 | $5,400,507 | $13,343,089 |
| Accounts Receivable | $398,250 | $1,274,400 | $2,078,865 |
| Inventory | $11,880 | $43,956 | $47,520 |
| Other Current Assets | $35,000 | $35,000 | $35,000 |
| Total Current Assets | $1,668,959 | $6,753,863 | $15,504,474 |
| Long-term Assets | |||
| Long-term Assets | $85,000 | $185,000 | $305,000 |
| Accumulated Depreciation | $11,000 | $21,000 | $31,000 |
| Total Long-term Assets | $74,000 | $164,000 | $274,000 |
| Total Assets | $1,742,959 | $6,917,863 | $15,778,474 |
| Liabilities and Capital | 2000 | 2001 | 2002 |
| Current Liabilities | |||
| Accounts Payable | $89,035 | $202,480 | $312,341 |
| Current Borrowing | $150,000 | $71,919 | $65,055 |
| Other Current Liabilities | $0 | $0 | $0 |
| Subtotal Current Liabilities | $239,035 | $274,399 | $377,396 |
| Long-term Liabilities | $85,799 | $67,873 | $48,070 |
| Total Liabilities | $324,834 | $342,272 | $425,466 |
| Paid-in Capital | $25,000 | $25,000 | $25,000 |
| Retained Earnings | $5,000 | $1,393,125 | $6,550,591 |
| Earnings | $1,388,125 | $5,157,465 | $8,777,417 |
| Total Capital | $1,418,125 | $6,575,591 | $15,353,008 |
| Total Liabilities and Capital | $1,742,959 | $6,917,863 | $15,778,474 |
| Net Worth | $1,418,125 | $6,575,591 | $15,353,008 |
Appendix
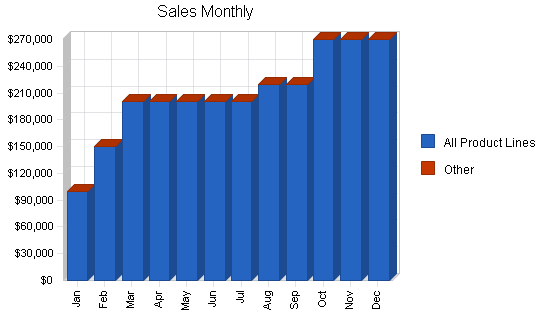
| Sales Forecast | |||||||||||||
| Jan | Feb | Mar | Apr | May | Jun | Jul | Aug | Sep | Oct | Nov | Dec | ||
| Sales | |||||||||||||
| All Product Lines | 0% | $100,000 | $150,000 | $200,000 | $200,000 | $200,000 | $200,000 | $200,000 | $220,000 | $220,000 | $270,000 | $270,000 | $270,000 |
| Other | 0% | $0 | $0 | $0 | $0 | $0 | $0 | $0 | $0 | $0 | $0 | $0 | $0 |
| Total Sales | $100,000 | $150,000 | $200,000 | $200,000 | $200,000 | $200,000 | $200,000 | $220,000 | $220,000 | $270,000 | $270,000 | $270,000 | |
| Direct Cost of Sales | Jan | Feb | Mar | Apr | May | Jun | Jul | Aug | Sep | Oct | Nov | Dec | |
| All Product Lines | $4,000 | $6,000 | $8,000 | $8,000 | $8,000 | $8,000 | $8,000 | $8,800 | $8,800 | $10,800 | $10,800 | $10,800 | |
| Other | $0 | $0 | $0 | $0 | $0 | $0 | $0 | $0 | $0 | $0 | $0 | $0 | |
| Subtotal Direct Cost of Sales | $4,000 | $6,000 | $8,000 | $8,000 | $8,000 | $8,000 | $8,000 | $8,800 | $8,800 | $10,800 | $10,800 | $10,800 | |
| Personnel Plan | |||||||||||||
| Jan | Feb | Mar | Apr | May | Jun | Jul | Aug | Sep | Oct | Nov | Dec | ||
| President | 0% | $3,000 | $3,000 | $3,000 | $3,000 | $3,000 | $3,000 | $3,000 | $3,000 | $3,000 | $3,000 | $3,000 | $3,000 |
| Vice president | 0% | $3,000 | $3,000 | $3,000 | $3,000 | $3,000 | $3,000 | $3,000 | $3,000 | $3,000 | $3,000 | $3,000 | $3,000 |
| Production manager | 0% | $3,000 | $3,000 | $3,000 | $3,000 | $3,000 | $3,000 | $3,000 | $3,000 | $3,000 | $3,000 | $3,000 | $3,000 |
| Workers | 0% | $11,000 | $11,000 | $11,000 | $11,000 | $11,000 | $11,000 | $11,000 | $11,000 | $11,000 | $11,000 | $11,000 | $11,000 |
| Other | 0% | $0 | $0 | $0 | $0 | $0 | $0 | $0 | $0 | $0 | $0 | $0 | $0 |
| Total People | 10 | 10 | 10 | 10 | 10 | 10 | 10 | 10 | 10 | 10 | 10 | 10 | |
| Total Payroll | $20,000 | $20,000 | $20,000 | $20,000 | $20,000 | $20,000 | $20,000 | $20,000 | $20,000 | $20,000 | $20,000 | $20,000 | |
| General Assumptions | |||||||||||||
| Jan | Feb | Mar | Apr | May | Jun | Jul | Aug | Sep | Oct | Nov | Dec | ||
| Plan Month | 1 | 2 | 3 | 4 | 5 | 6 | 7 | 8 | 9 | 10 | 11 | 12 | |
| Current Interest Rate | 10.00% | 10.00% | 10.00% | 10.00% | 10.00% | 10.00% | 10.00% | 10.00% | 10.00% | 10.00% | 10.00% | 10.00% | |
| Long-term Interest Rate | 10.00% | 10.00% | 10.00% | 10.00% | 10.00% | 10.00% | 10.00% | 10.00% | 10.00% | 10.00% | 10.00% | 10.00% | |
| Tax Rate | 30.00% | 25.00% | 25.00% | 25.00% | 25.00% | 25.00% | 25.00% | 25.00% | 25.00% | 25.00% | 25.00% | 25.00% | |
| Other | 0 | 0 | 0 | 0 | 0 | 0 | 0 | 0 | 0 | 0 | 0 | 0 | |
| Pro Forma Cash Flow | |||||||||||||
| Jan | Feb | Mar | Apr | May | Jun | Jul | Aug | Sep | Oct | Nov | Dec | ||
| Cash Received | |||||||||||||
| Cash from Operations | |||||||||||||
| Cash Sales | $25,000 | $37,500 | $50,000 | $50,000 | $50,000 | $50,000 | $50,000 | $55,000 | $55,000 | $67,500 | $67,500 | $67,500 | |
| Cash from Receivables | $25,000 | $27,500 | $76,250 | $113,750 | $150,000 | $150,000 | $150,000 | $150,000 | $150,500 | $165,000 | $166,250 | $202,500 | |
| Subtotal Cash from Operations | $50,000 | $65,000 | $126,250 | $163,750 | $200,000 | $200,000 | $200,000 | $205,000 | $205,500 | $232,500 | $233,750 | $270,000 | |
| Additional Cash Received | |||||||||||||
| Sales Tax, VAT, HST/GST Received | 0.00% | $0 | $0 | $0 | $0 | $0 | $0 | $0 | $0 | $0 | $0 | $0 | $0 |
| New Current Borrowing | $150,000 | $0 | $0 | $0 | $0 | $0 | $0 | $0 | $0 | $0 | $0 | $0 | |
| New Other Liabilities (interest-free) | $0 | $0 | $0 | $0 | $0 | $0 | $0 | $0 | $0 | $0 | $0 | $0 | |
| New Long-term Liabilities | $0 | $0 | $0 | $0 | $0 | $0 | $0 | $0 | $0 | $0 | $0 | $0 | |
| Sales of Other Current Assets | $0 | $0 | $0 | $0 | $0 | $0 | $0 | $0 | $0 | $0 | $0 | $0 | |
| Sales of Long-term Assets | $0 | $0 | $0 | $0 | $0 | $0 | $0 | $0 | $0 | $0 | $0 | $0 | |
| New Investment Received | $0 | $0 | $0 | $0 | $0 | $0 | $0 | $0 | $0 | $0 | $0 | $0 | |
| Subtotal Cash Received | $200,000 | $65,000 | $126,250 | $163,750 | $200,000 | $200,000 | $200,000 | $205,000 | $205,500 | $232,500 | $233,750 | $270,000 | |
| Expenditures | Jan | Feb | Mar | Apr | May | Jun | Jul | Aug | Sep | Oct | Nov | Dec | |
| Expenditures from Operations | |||||||||||||
| Cash Spending | $20,000 | $20,000 | $20,000 | $20,000 | $20,000 | $20,000 | $20,000 | $20,000 | $20,000 | $20,000 | $20,000 | $20,000 | |
| Bill Payments | $21,273 | $38,664 | $52,677 | $69,754 | $67,744 | $71,361 | $71,353 | $71,561 | $77,788 | $77,469 | $93,050 | $91,025 | |
| Subtotal Spent on Operations | $41,273 | $58,664 | $72,677 | $89,754 | $87,744 | $91,361 | $91,353 | $91,561 | $97,788 | $97,469 | $113,050 | $111,025 | |
| Additional Cash Spent | |||||||||||||
| Sales Tax, VAT, HST/GST Paid Out | $0 | $0 | $0 | $0 | $0 | $0 | $0 | $0 | $0 | $0 | $0 | $0 | |
| Principal Repayment of Current Borrowing | $0 | $0 | $0 | $0 | $0 | $0 | $0 | $0 | $0 | $0 | $0 | $0 | |
| Other Liabilities Principal Repayment | $0 | $0 | $0 | $0 | $0 | $0 | $0 | $0 | $0 | $0 | $0 | $0 | |
| Long-term Liabilities Principal Repayment | $0 | $1,291 | $1,291 | $1,291 | $1,291 | $1,291 | $1,291 | $1,291 | $1,291 | $1,291 | $1,291 | $1,291 | |
| Purchase Other Current Assets | $0 | $0 | $0 | $0 | $0 | $0 | $0 | $0 | $0 | $0 | $0 | $0 | |
| Purchase Long-term Assets | $5,000 | $5,000 | $5,000 | $5,000 | $5,000 | $5,000 | $5,000 | $5,000 | $5,000 | $5,000 | $5,000 | $5,000 | |
| Dividends | $0 | $0 | $0 | $0 | $0 | $0 | $0 | $0 | $0 | $0 | $0 | $0 | |
| Subtotal Cash Spent | $46,273 | $64,955 | $78,968 | $96,045 | $94,035 | $97,652 | $97,644 | $97,852 | $104,079 | $103,760 | $119,341 | $117,316 | |
| Net Cash Flow | $153,727 | $45 | $47,282 | $67,705 | $105,965 | $102,348 | $102,356 | $107,148 | $101,421 | $128,740 | $114,409 | $152,684 | |
| Cash Balance | $193,727 | $193,772 | $241,054 | $308,759 | $414,724 | $517,071 | $619,427 | $726,575 | $827,997 | $956,737 | $1,071,146 | $1,223,829 | |
| Pro Forma Profit and Loss | |||||||||||||
| Jan | Feb | Mar | Apr | May | Jun | Jul | Aug | Sep | Oct | Nov | Dec | ||
| Sales | $100,000 | $150,000 | $200,000 | $200,000 | $200,000 | $200,000 | $200,000 | $220,000 | $220,000 | $270,000 | $270,000 | $270,000 | |
| Direct Cost of Sales | $4,000 | $6,000 | $8,000 | $8,000 | $8,000 | $8,000 | $8,000 | $8,800 | $8,800 | $10,800 | $10,800 | $10,800 | |
| Other | $400 | $400 | $400 | $400 | $400 | $400 | $400 | $400 | $400 | $400 | $500 | $500 | |
| Total Cost of Sales | $4,400 | $6,400 | $8,400 | $8,400 | $8,400 | $8,400 | $8,400 | $9,200 | $9,200 | $11,200 | $11,300 | $11,300 | |
| Gross Margin | $95,600 | $143,600 | $191,600 | $191,600 | $191,600 | $191,600 | $191,600 | $210,800 | $210,800 | $258,800 | $258,700 | $258,700 | |
| Gross Margin % | 95.60% | 95.73% | 95.80% | 95.80% | 95.80% | 95.80% | 95.80% | 95.82% | 95.82% | 95.85% | 95.81% | 95.81% | |
| Expenses | |||||||||||||
| Payroll | $20,000 | $20,000 | $20,000 | $20,000 | $20,000 | $20,000 | $20,000 | $20,000 | $20,000 | $20,000 | $20,000 | $20,000 | |
| Sales and Marketing and Other Expenses | $10,667 | $10,667 | $15,667 | $15,667 | $20,667 | $20,667 | $20,667 | $20,667 | $20,667 | $20,667 | $20,667 | $20,667 | |
| Depreciation | $500 | $500 | $500 | $500 | $500 | $500 | $500 | $500 | $500 | $500 | $500 | $500 | |
| Utilities | $167 | $167 | $167 | $167 | $167 | $167 | $167 | $167 | $167 | $167 | $167 | $167 | |
| Insurance | $833 | $833 | $833 | $833 | $833 | $833 | $833 | $833 | $833 | $833 | $833 | $833 | |
| Rent | $208 | $208 | $208 | $208 | $208 | $208 | $208 | $208 | $208 | $208 | $208 | $208 | |
| Payroll Taxes | 15% | $3,000 | $3,000 | $3,000 | $3,000 | $3,000 | $3,000 | $3,000 | $3,000 | $3,000 | $3,000 | $3,000 | $4,500 |
| Other | $0 | $0 | $0 | $0 | $0 | $0 | $0 | $0 | $0 | $0 | $0 | $0 | |
| Total Operating Expenses | $35,375 | $35,375 | $40,375 | $40,375 | $45,375 | $45,375 | $45,375 | $45,375 | $45,375 | $45,375 | $45,375 | $46,875 | |
| Profit Before Interest and Taxes | $60,225 | $108,225 | $151,225 | $151,225 | $146,225 | $146,225 | $146,225 | $165,425 | $165,425 | $213,425 | $213,325 | $211,825 | |
| EBITDA | $60,725 | $108,725 | $151,725 | $151,725 | $146,725 | $146,725 | $146,725 | $165,925 | $165,925 | $213,925 | $213,825 | $212,325 | |
| Interest Expense | $2,083 | $2,073 | $2,062 | $2,051 | $2,040 | $2,030 | $2,019 | $2,008 | $1,997 | $1,987 | $1,976 | $1,965 | |
| Taxes Incurred | $17,442 | $26,538 | $37,291 | $37,293 | $36,046 | $36,049 | $36,052 | $40,854 | $40,857 | $52,860 | $52,837 | $52,465 | |
| Net Profit | $40,699 | $79,614 | $111,872 | $111,880 | $108,139 | $108,147 | $108,155 | $122,563 | $122,571 | $158,579 | $158,512 | $157,395 | |
| Net Profit/Sales | 40.70% | 53.08% | 55.94% | 55.94% | 54.07% | 54.07% | 54.08% | 55.71% | 55.71% | 58.73% | 58.71% | 58.29% | |
| Pro Forma Balance Sheet | |||||||||||||
| Jan | Feb | Mar | Apr | May | Jun | Jul | Aug | Sep | Oct | Nov | Dec | ||
| Assets | Starting Balances | ||||||||||||
| Current Assets | |||||||||||||
| Cash | $40,000 | $193,727 | $193,772 | $241,054 | $308,759 | $414,724 | $517,071 | $619,427 | $726,575 | $827,997 | $956,737 | $1,071,146 | $1,223,829 |
| Accounts Receivable | $50,000 | $100,000 | $185,000 | $258,750 | $295,000 | $295,000 | $295,000 | $295,000 | $310,000 | $324,500 | $362,000 | $398,250 | $398,250 |
| Inventory | $5,000 | $4,400 | $6,600 | $8,800 | $8,800 | $8,800 | $8,800 | $8,800 | $9,680 | $9,680 | $11,880 | $11,880 | $11,880 |
| Other Current Assets | $35,000 | $35,000 | $35,000 | $35,000 | $35,000 | $35,000 | $35,000 | $35,000 | $35,000 | $35,000 | $35,000 | $35,000 | $35,000 |
| Total Current Assets | $130,000 | $333,127 | $420,372 | $543,604 | $647,559 | $753,524 | $855,871 | $958,227 | $1,081,255 | $1,197,177 | $1,365,617 | $1,516,276 | $1,668,959 |
| Long-term Assets | |||||||||||||
| Long-term Assets | $25,000 | $30,000 | $35,000 | $40,000 | $45,000 | $50,000 | $55,000 | $60,000 | $65,000 | $70,000 | $75,000 | $80,000 | $85,000 |
| Accumulated Depreciation | $5,000 | $5,500 | $6,000 | $6,500 | $7,000 | $7,500 | $8,000 | $8,500 | $9,000 | $9,500 | $10,000 | $10,500 | $11,000 |
| Total Long-term Assets | $20,000 | $24,500 | $29,000 | $33,500 | $38,000 | $42,500 | $47,000 | $51,500 | $56,000 | $60,500 | $65,000 | $69,500 | $74,000 |
| Total Assets | $150,000 | $357,627 | $449,372 | $577,104 | $685,559 | $796,024 | $902,871 | $1,009,727 | $1,137,255 | $1,257,677 | $1,430,617 | $1,585,776 | $1,742,959 |
| Liabilities and Capital | Jan | Feb | Mar | Apr | May | Jun | Jul | Aug | Sep | Oct | Nov | Dec | |
| Current Liabilities | |||||||||||||
| Accounts Payable | $20,000 | $36,927 | $50,349 | $67,500 | $65,366 | $68,983 | $68,975 | $68,967 | $75,223 | $74,365 | $90,017 | $87,955 | $89,035 |
| Current Borrowing | $0 | $150,000 | $150,000 | $150,000 | $150,000 | $150,000 | $150,000 | $150,000 | $150,000 | $150,000 | $150,000 | $150,000 | $150,000 |
| Other Current Liabilities | $0 | $0 | $0 | $0 | $0 | $0 | $0 | $0 | $0 | $0 | $0 | $0 | $0 |
| Subtotal Current Liabilities | $20,000 | $186,927 | $200,349 | $217,500 | $215,366 | $218,983 | $218,975 | $218,967 | $225,223 | $224,365 | $240,017 | $237,955 | $239,035 |
| Long-term Liabilities | $100,000 | $100,000 | $98,709 | $97,418 | $96,127 | $94,836 | $93,545 | $92,254 | $90,963 | $89,672 | $88,381 | $87,090 | $85,799 |
| Total Liabilities | $120,000 | $286,927 | $299,058 | $314,918 | $311,493 | $313,819 | $312,520 | $311,221 | $316,186 | $314,037 | $328,398 | $325,045 | $324,834 |
| Paid-in Capital | $25,000 | $25,000 | $25,000 | $25,000 | $25,000 | $25,000 | $25,000 | $25,000 | $25,000 | $25,000 | $25,000 | $25,000 | $25,000 |
| Retained Earnings | $5,000 | $5,000 | $5,000 | $5,000 | $5,000 | $5,000 | $5,000 | $5,000 | $5,000 | $5,000 | $5,000 | $5,000 | $5,000 |
| Earnings | $0 | $40,699 | $120,313 | $232,186 | $344,066 | $452,205 | $560,351 | $668,506 | $791,069 | $913,640 | $1,072,219 | $1,230,730 | $1,388,125 |
| Total Capital | $30,000 | $70,699 | $150,313 | $262,186 | $374,066 | $482,205 | $590,351 | $698,506 | $821,069 | $943,640 | $1,102,219 | $1,260,730 | $1,418,125 |
| Total Liabilities and Capital | $150,000 | $357,627 | $449,372 | $577,104 | $685,559 | $796,024 | $902,871 | $1,009,727 | $1,137,255 | $1,257,677 | $1,430,617 | $1,585,776 | $1,742,959 |
| Net Worth | $30,000 | $70,699 | $150,313 | $262,186 | $374,066 | $482,205 | $590,351 | $698,506 | $821,069 | $943,640 | $1,102,219 | $1,260,730 | $1,418,125 |


