
Sports Chiropractic Center
Executive Summary
The Pacific Valley Sport Medicine Center will soon open to serve the greater Southerlin metro area. Dr. John Meeks, a chiropractic doctor for six years with the Nichols Wellness Center, will be establishing his own practice in the Center. Dr. Meeks is joining the Center that will have the city’s best and most respected sports injury specialists. His addition to the Center’s specialists was sought by the group of sport injury physicians that created the Center.
These physicians represent over 70% of Dr. Meeks referrals. In his new practice, Dr. Meeks will be able to focus exclusively on sport injury referrals which will increase in his new location in the Center.

1.1 Mission
The mission of Sports Chiropractic is to promote the well-being of the athletes in the Southerlin community by providing accessible, quality chiropractic care for athletes of all ages, utilizing a service system that emphasizes trust, respect, confidentiality, and compassion. We are committed to quality chiropractic care that is provided in a collaborative effort with a physician’s overall health strategies and an array of medical services. We are further committed to the philosophy that we exist for the customer/client.
1.2 Objectives
- To continuously develop, strengthen, and improve chiropractic services offered by the Center.
- To strengthen the Center’s commitment to chiropractic services.
- Increase referrals from the Center’s physicians.
- Build referral into repeat clients.
Company Summary
Sports Chiropractic is a chiropractic practice started by Dr. John Meeks in the newly opened Pacific Valley Sport Medicine Center. Sports Chiropractics will provide quality chiropractic services to athletes of all ages and work in conjunction with the Center’s physicians.
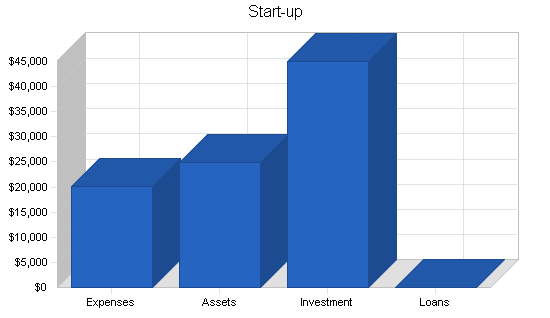
2.1 Start-up Summary
It is estimated that start-up expenses will be $20,000. An additional amount of $25,000 will be required as start-up assets. The start-up costs are to be financed by Dr. Meeks personal funds.
| Start-up | |
| Requirements | |
| Start-up Expenses | |
| Legal | $0 |
| Stationery etc. | $300 |
| Brochures | $500 |
| Consultants | $0 |
| Insurance | $800 |
| Rent | $1,500 |
| Research and Development | $0 |
| Expensed Equipment | $4,000 |
| Leased Equipment | $13,000 |
| Other | $0 |
| Total Start-up Expenses | $20,100 |
| Start-up Assets | |
| Cash Required | $24,900 |
| Other Current Assets | $0 |
| Long-term Assets | $0 |
| Total Assets | $24,900 |
| Total Requirements | $45,000 |
| Start-up Funding | |
| Start-up Expenses to Fund | $20,100 |
| Start-up Assets to Fund | $24,900 |
| Total Funding Required | $45,000 |
| Assets | |
| Non-cash Assets from Start-up | $0 |
| Cash Requirements from Start-up | $24,900 |
| Additional Cash Raised | $0 |
| Cash Balance on Starting Date | $24,900 |
| Total Assets | $24,900 |
| Liabilities and Capital | |
| Liabilities | |
| Current Borrowing | $0 |
| Long-term Liabilities | $0 |
| Accounts Payable (Outstanding Bills) | $0 |
| Other Current Liabilities (interest-free) | $0 |
| Total Liabilities | $0 |
| Capital | |
| Planned Investment | |
| Dr. Meeks | $45,000 |
| Investor 2 | $0 |
| Other | $0 |
| Additional Investment Requirement | $0 |
| Total Planned Investment | $45,000 |
| Loss at Start-up (Start-up Expenses) | ($20,100) |
| Total Capital | $24,900 |
| Total Capital and Liabilities | $24,900 |
| Total Funding | $45,000 |
2.2 Company Ownership
Sports Chiropractic is owned by Dr. John Meeks.
Services
Dr. Meeks’ philosophy is that optimal health and performance can be attained through the proper balance of exercise, nutrition, and care of the body’s framework (skeleton). In addition, maintaining a state of good health depends on a normally functioning nervous system. The most important and delicate organs of this nervous system are supported and protected by the skull and spinal vertebrae, when misaligned these structures can irritate and interfere with the nerve impulses. As a doctor of chiropractic, he locates these points of interference and corrects the spinal misalignments, so the body can reestablish its balance and heal itself to the best of its ability.
Sports Chiropractic offers treatment for various conditions including, but not limited to:
- Athletic injuries.
- Low back and leg pain.
- Neck and arm pain.
- Headaches.
- Shoulder, knee, and foot pain.
Market Analysis Summary
The chiropractic field is a crowded one in any metro area and Southerlin is no exception. There are over 60 chiropractors practicing in the greater Southerlin community. A majority are generalists with only a handful that specialize with a particular client group. Dr. Meeks’ specialty is athletic injuries, especially runners. Southerlin has a large and committed running community. Each year there are numerous running events the entire city participates in. In addition to runners, there are high school aged athletes that need treatment for sport injuries. The third large group of potential clients is the active baby-boomers who are becoming more athletic as they get older and want to be pain-free.
4.1 Market Segmentation
Sports Chiropractic will focus on the following market segments:
- Runners.
- High school age athletes.
- Active baby-boomers.

| Market Analysis | |||||||
| Year 1 | Year 2 | Year 3 | Year 4 | Year 5 | |||
| Potential Customers | Growth | CAGR | |||||
| Runners | 15% | 5,000 | 5,750 | 6,613 | 7,605 | 8,746 | 15.00% |
| High School Age Athletes | 15% | 4,000 | 4,600 | 5,290 | 6,084 | 6,997 | 15.00% |
| Active Baby-Boomers | 10% | 20,000 | 22,000 | 24,200 | 26,620 | 29,282 | 10.00% |
| Total | 11.63% | 29,000 | 32,350 | 36,103 | 40,309 | 45,025 | 11.63% |
Strategy and Implementation Summary
Sports Chiropractic is uniquely positioned to be successful in treating sports injuries. The following subsections will outline these advantages.
5.1 Competitive Edge
Dr. Meeks, an avid runner, is one of the most visible sport injury specialists in Southerlin. He supports the city’s numerous charity runs and has spoken to many athletic groups and organizations about preventing sport injuries.
Dr. Meeks has also developed an extensive network of contact with physicians that specialize in sport injuries. Over half of his referrals come from these doctors. This is a strong competitive edge with competitors. In addition, his strong reputation for exceptional service has resulted in growing base of loyal clients who will follow to his new practice.
But the strongest competitive advantage for Sports Chiropractic is that it is the only chiropractic service in the Pacific Valley Sport Medicine Center. As stated before, this center will become the dominant service provider for sport injuries. Dr. Meeks will become the chiropractor to see with a sport-related injury.
5.2 Marketing Strategy
Though Sports Chiropractic has a strong referral base for clients, it will still be important to market Dr. Meeks services.
Dr. Meeks will continue to speak to local groups on preventing sport injuries. The key is to keep Dr. Meeks in the public as the sports injury expert.
In addition, Sports Chiropractic will sponsor an annual run in the city in support of high school athletics.
5.3 Sales Forecast
The following table and chart highlight the sales forecast for three years.

| Sales Forecast | |||
| Year 1 | Year 2 | Year 3 | |
| Sales | |||
| Clients | $138,000 | $151,800 | $166,980 |
| Other | $0 | $0 | $0 |
| Total Sales | $138,000 | $151,800 | $166,980 |
| Direct Cost of Sales | Year 1 | Year 2 | Year 3 |
| Clients | $0 | $0 | $0 |
| Other | $0 | $0 | $0 |
| Subtotal Direct Cost of Sales | $0 | $0 | $0 |
Personnel Plan
The Sports Chiropractic staff will consist of Dr. Meeks, one full-time receptionist/clerical staff member and a half-time bookkeeper.
| Personnel Plan | |||
| Year 1 | Year 2 | Year 3 | |
| Dr. Meeks | $48,000 | $58,000 | $68,000 |
| Receptionist/Clerical | $24,000 | $28,000 | $33,000 |
| Bookkeeper | $13,500 | $15,000 | $17,000 |
| Other | $0 | $0 | $0 |
| Total People | 3 | 3 | 0 |
| Total Payroll | $85,500 | $101,000 | $118,000 |
Financial Plan
The following is the financial plan for Sports Chiropractic.
7.1 Break-even Analysis
The monthly sales break-even point is shown in the following table and chart.

| Break-even Analysis | |
| Monthly Revenue Break-even | $10,244 |
| Assumptions: | |
| Average Percent Variable Cost | 0% |
| Estimated Monthly Fixed Cost | $10,244 |
7.2 Projected Profit and Loss
The following is the projected profit and loss for three years.


| Pro Forma Profit and Loss | |||
| Year 1 | Year 2 | Year 3 | |
| Sales | $138,000 | $151,800 | $166,980 |
| Direct Cost of Sales | $0 | $0 | $0 |
| Other Production Expenses | $0 | $0 | $0 |
| Total Cost of Sales | $0 | $0 | $0 |
| Gross Margin | $138,000 | $151,800 | $166,980 |
| Gross Margin % | 100.00% | 100.00% | 100.00% |
| Expenses | |||
| Payroll | $85,500 | $101,000 | $118,000 |
| Sales and Marketing and Other Expenses | $4,800 | $5,000 | $5,000 |
| Depreciation | $0 | $0 | $0 |
| Leased Equipment | $0 | $0 | $0 |
| Utilities | $0 | $0 | $150 |
| Insurance | $1,800 | $1,800 | $1,800 |
| Rent | $18,000 | $18,000 | $1,800 |
| Payroll Taxes | $12,825 | $15,150 | $17,700 |
| Other | $0 | $0 | $0 |
| Total Operating Expenses | $122,925 | $140,950 | $144,450 |
| Profit Before Interest and Taxes | $15,075 | $10,850 | $22,530 |
| EBITDA | $15,075 | $10,850 | $22,530 |
| Interest Expense | $0 | $0 | $0 |
| Taxes Incurred | $4,523 | $3,255 | $6,759 |
| Net Profit | $10,553 | $7,595 | $15,771 |
| Net Profit/Sales | 7.65% | 5.00% | 9.44% |
7.3 Projected Cash Flow
The following is the projected cash flow for three years.


| Pro Forma Cash Flow | |||
| Year 1 | Year 2 | Year 3 | |
| Cash Received | |||
| Cash from Operations | |||
| Cash Sales | $138,000 | $151,800 | $166,980 |
| Subtotal Cash from Operations | $138,000 | $151,800 | $166,980 |
| Additional Cash Received | |||
| Sales Tax, VAT, HST/GST Received | $0 | $0 | $0 |
| New Current Borrowing | $0 | $0 | $0 |
| New Other Liabilities (interest-free) | $0 | $0 | $0 |
| New Long-term Liabilities | $0 | $0 | $0 |
| Sales of Other Current Assets | $0 | $0 | $0 |
| Sales of Long-term Assets | $0 | $0 | $0 |
| New Investment Received | $0 | $0 | $0 |
| Subtotal Cash Received | $138,000 | $151,800 | $166,980 |
| Expenditures | Year 1 | Year 2 | Year 3 |
| Expenditures from Operations | |||
| Cash Spending | $85,500 | $101,000 | $118,000 |
| Bill Payments | $37,914 | $43,687 | $34,031 |
| Subtotal Spent on Operations | $123,414 | $144,687 | $152,031 |
| Additional Cash Spent | |||
| Sales Tax, VAT, HST/GST Paid Out | $0 | $0 | $0 |
| Principal Repayment of Current Borrowing | $0 | $0 | $0 |
| Other Liabilities Principal Repayment | $0 | $0 | $0 |
| Long-term Liabilities Principal Repayment | $0 | $0 | $0 |
| Purchase Other Current Assets | $0 | $0 | $0 |
| Purchase Long-term Assets | $0 | $0 | $0 |
| Dividends | $0 | $0 | $0 |
| Subtotal Cash Spent | $123,414 | $144,687 | $152,031 |
| Net Cash Flow | $14,586 | $7,113 | $14,949 |
| Cash Balance | $39,486 | $46,599 | $61,548 |
7.4 Projected Balance Sheet
The following is the projected balance sheet for three years.
| Pro Forma Balance Sheet | |||
| Year 1 | Year 2 | Year 3 | |
| Assets | |||
| Current Assets | |||
| Cash | $39,486 | $46,599 | $61,548 |
| Other Current Assets | $0 | $0 | $0 |
| Total Current Assets | $39,486 | $46,599 | $61,548 |
| Long-term Assets | |||
| Long-term Assets | $0 | $0 | $0 |
| Accumulated Depreciation | $0 | $0 | $0 |
| Total Long-term Assets | $0 | $0 | $0 |
| Total Assets | $39,486 | $46,599 | $61,548 |
| Liabilities and Capital | Year 1 | Year 2 | Year 3 |
| Current Liabilities | |||
| Accounts Payable | $4,033 | $3,551 | $2,730 |
| Current Borrowing | $0 | $0 | $0 |
| Other Current Liabilities | $0 | $0 | $0 |
| Subtotal Current Liabilities | $4,033 | $3,551 | $2,730 |
| Long-term Liabilities | $0 | $0 | $0 |
| Total Liabilities | $4,033 | $3,551 | $2,730 |
| Paid-in Capital | $45,000 | $45,000 | $45,000 |
| Retained Earnings | ($20,100) | ($9,548) | ($1,953) |
| Earnings | $10,553 | $7,595 | $15,771 |
| Total Capital | $35,453 | $43,048 | $58,819 |
| Total Liabilities and Capital | $39,486 | $46,599 | $61,548 |
| Net Worth | $35,453 | $43,048 | $58,819 |
7.5 Business Ratios
The following table outlines some of the more important ratios from the Offices of Physicians industry. The final column, Industry Profile, details specific ratios based on the industry as it is classified by the Standard Industry Classification (SIC) code, 8011.
| Ratio Analysis | ||||
| Year 1 | Year 2 | Year 3 | Industry Profile | |
| Sales Growth | 0.00% | 10.00% | 10.00% | 5.90% |
| Percent of Total Assets | ||||
| Other Current Assets | 0.00% | 0.00% | 0.00% | 50.50% |
| Total Current Assets | 100.00% | 100.00% | 100.00% | 60.80% |
| Long-term Assets | 0.00% | 0.00% | 0.00% | 39.20% |
| Total Assets | 100.00% | 100.00% | 100.00% | 100.00% |
| Current Liabilities | 10.21% | 7.62% | 4.43% | 39.80% |
| Long-term Liabilities | 0.00% | 0.00% | 0.00% | 14.10% |
| Total Liabilities | 10.21% | 7.62% | 4.43% | 53.90% |
| Net Worth | 89.79% | 92.38% | 95.57% | 46.10% |
| Percent of Sales | ||||
| Sales | 100.00% | 100.00% | 100.00% | 100.00% |
| Gross Margin | 100.00% | 100.00% | 100.00% | 0.00% |
| Selling, General & Administrative Expenses | 92.35% | 95.00% | 90.56% | 57.10% |
| Advertising Expenses | 3.48% | 3.29% | 2.99% | 0.40% |
| Profit Before Interest and Taxes | 10.92% | 7.15% | 13.49% | 2.00% |
| Main Ratios | ||||
| Current | 9.79 | 13.12 | 22.55 | 1.37 |
| Quick | 9.79 | 13.12 | 22.55 | 1.12 |
| Total Debt to Total Assets | 10.21% | 7.62% | 4.43% | 53.90% |
| Pre-tax Return on Net Worth | 42.52% | 25.20% | 38.30% | 6.90% |
| Pre-tax Return on Assets | 38.18% | 23.28% | 36.61% | 15.00% |
| Additional Ratios | Year 1 | Year 2 | Year 3 | |
| Net Profit Margin | 7.65% | 5.00% | 9.44% | n.a |
| Return on Equity | 29.77% | 17.64% | 26.81% | n.a |
| Activity Ratios | ||||
| Accounts Payable Turnover | 10.40 | 12.17 | 12.17 | n.a |
| Payment Days | 27 | 32 | 35 | n.a |
| Total Asset Turnover | 3.49 | 3.26 | 2.71 | n.a |
| Debt Ratios | ||||
| Debt to Net Worth | 0.11 | 0.08 | 0.05 | n.a |
| Current Liab. to Liab. | 1.00 | 1.00 | 1.00 | n.a |
| Liquidity Ratios | ||||
| Net Working Capital | $35,453 | $43,048 | $58,819 | n.a |
| Interest Coverage | 0.00 | 0.00 | 0.00 | n.a |
| Additional Ratios | ||||
| Assets to Sales | 0.29 | 0.31 | 0.37 | n.a |
| Current Debt/Total Assets | 10% | 8% | 4% | n.a |
| Acid Test | 9.79 | 13.12 | 22.55 | n.a |
| Sales/Net Worth | 3.89 | 3.53 | 2.84 | n.a |
| Dividend Payout | 0.00 | 0.00 | 0.00 | n.a |
Appendix
| Sales Forecast | |||||||||||||
| Month 1 | Month 2 | Month 3 | Month 4 | Month 5 | Month 6 | Month 7 | Month 8 | Month 9 | Month 10 | Month 11 | Month 12 | ||
| Sales | |||||||||||||
| Clients | 0% | $7,000 | $8,000 | $9,000 | $10,000 | $11,000 | $12,000 | $12,000 | $13,000 | $14,000 | $14,000 | $14,000 | $14,000 |
| Other | 0% | $0 | $0 | $0 | $0 | $0 | $0 | $0 | $0 | $0 | $0 | $0 | $0 |
| Total Sales | $7,000 | $8,000 | $9,000 | $10,000 | $11,000 | $12,000 | $12,000 | $13,000 | $14,000 | $14,000 | $14,000 | $14,000 | |
| Direct Cost of Sales | Month 1 | Month 2 | Month 3 | Month 4 | Month 5 | Month 6 | Month 7 | Month 8 | Month 9 | Month 10 | Month 11 | Month 12 | |
| Clients | $0 | $0 | $0 | $0 | $0 | $0 | $0 | $0 | $0 | $0 | $0 | $0 | |
| Other | $0 | $0 | $0 | $0 | $0 | $0 | $0 | $0 | $0 | $0 | $0 | $0 | |
| Subtotal Direct Cost of Sales | $0 | $0 | $0 | $0 | $0 | $0 | $0 | $0 | $0 | $0 | $0 | $0 | |
| Personnel Plan | |||||||||||||
| Month 1 | Month 2 | Month 3 | Month 4 | Month 5 | Month 6 | Month 7 | Month 8 | Month 9 | Month 10 | Month 11 | Month 12 | ||
| Dr. Meeks | 0% | $4,000 | $4,000 | $4,000 | $4,000 | $4,000 | $4,000 | $4,000 | $4,000 | $4,000 | $4,000 | $4,000 | $4,000 |
| Receptionist/Clerical | 0% | $2,000 | $2,000 | $2,000 | $2,000 | $2,000 | $2,000 | $2,000 | $2,000 | $2,000 | $2,000 | $2,000 | $2,000 |
| Bookkeeper | 0% | $0 | $0 | $0 | $1,500 | $1,500 | $1,500 | $1,500 | $1,500 | $1,500 | $1,500 | $1,500 | $1,500 |
| Other | 0% | $0 | $0 | $0 | $0 | $0 | $0 | $0 | $0 | $0 | $0 | $0 | $0 |
| Total People | 3 | 3 | 3 | 3 | 3 | 3 | 3 | 3 | 3 | 3 | 3 | 3 | |
| Total Payroll | $6,000 | $6,000 | $6,000 | $7,500 | $7,500 | $7,500 | $7,500 | $7,500 | $7,500 | $7,500 | $7,500 | $7,500 | |
| General Assumptions | |||||||||||||
| Month 1 | Month 2 | Month 3 | Month 4 | Month 5 | Month 6 | Month 7 | Month 8 | Month 9 | Month 10 | Month 11 | Month 12 | ||
| Plan Month | 1 | 2 | 3 | 4 | 5 | 6 | 7 | 8 | 9 | 10 | 11 | 12 | |
| Current Interest Rate | 10.00% | 10.00% | 10.00% | 10.00% | 10.00% | 10.00% | 10.00% | 10.00% | 10.00% | 10.00% | 10.00% | 10.00% | |
| Long-term Interest Rate | 10.00% | 10.00% | 10.00% | 10.00% | 10.00% | 10.00% | 10.00% | 10.00% | 10.00% | 10.00% | 10.00% | 10.00% | |
| Tax Rate | 30.00% | 30.00% | 30.00% | 30.00% | 30.00% | 30.00% | 30.00% | 30.00% | 30.00% | 30.00% | 30.00% | 30.00% | |
| Other | 0 | 0 | 0 | 0 | 0 | 0 | 0 | 0 | 0 | 0 | 0 | 0 | |
| Pro Forma Profit and Loss | |||||||||||||
| Month 1 | Month 2 | Month 3 | Month 4 | Month 5 | Month 6 | Month 7 | Month 8 | Month 9 | Month 10 | Month 11 | Month 12 | ||
| Sales | $7,000 | $8,000 | $9,000 | $10,000 | $11,000 | $12,000 | $12,000 | $13,000 | $14,000 | $14,000 | $14,000 | $14,000 | |
| Direct Cost of Sales | $0 | $0 | $0 | $0 | $0 | $0 | $0 | $0 | $0 | $0 | $0 | $0 | |
| Other Production Expenses | $0 | $0 | $0 | $0 | $0 | $0 | $0 | $0 | $0 | $0 | $0 | $0 | |
| Total Cost of Sales | $0 | $0 | $0 | $0 | $0 | $0 | $0 | $0 | $0 | $0 | $0 | $0 | |
| Gross Margin | $7,000 | $8,000 | $9,000 | $10,000 | $11,000 | $12,000 | $12,000 | $13,000 | $14,000 | $14,000 | $14,000 | $14,000 | |
| Gross Margin % | 100.00% | 100.00% | 100.00% | 100.00% | 100.00% | 100.00% | 100.00% | 100.00% | 100.00% | 100.00% | 100.00% | 100.00% | |
| Expenses | |||||||||||||
| Payroll | $6,000 | $6,000 | $6,000 | $7,500 | $7,500 | $7,500 | $7,500 | $7,500 | $7,500 | $7,500 | $7,500 | $7,500 | |
| Sales and Marketing and Other Expenses | $400 | $400 | $400 | $400 | $400 | $400 | $400 | $400 | $400 | $400 | $400 | $400 | |
| Depreciation | $0 | $0 | $0 | $0 | $0 | $0 | $0 | $0 | $0 | $0 | $0 | $0 | |
| Leased Equipment | $0 | $0 | $0 | $0 | $0 | $0 | $0 | $0 | $0 | $0 | $0 | $0 | |
| Utilities | $0 | $0 | $0 | $0 | $0 | $0 | $0 | $0 | $0 | $0 | $0 | $0 | |
| Insurance | 15000% | $150 | $150 | $150 | $150 | $150 | $150 | $150 | $150 | $150 | $150 | $150 | $150 |
| Rent | $1,500 | $1,500 | $1,500 | $1,500 | $1,500 | $1,500 | $1,500 | $1,500 | $1,500 | $1,500 | $1,500 | $1,500 | |
| Payroll Taxes | 15% | $900 | $900 | $900 | $1,125 | $1,125 | $1,125 | $1,125 | $1,125 | $1,125 | $1,125 | $1,125 | $1,125 |
| Other | $0 | $0 | $0 | $0 | $0 | $0 | $0 | $0 | $0 | $0 | $0 | $0 | |
| Total Operating Expenses | $8,950 | $8,950 | $8,950 | $10,675 | $10,675 | $10,675 | $10,675 | $10,675 | $10,675 | $10,675 | $10,675 | $10,675 | |
| Profit Before Interest and Taxes | ($1,950) | ($950) | $50 | ($675) | $325 | $1,325 | $1,325 | $2,325 | $3,325 | $3,325 | $3,325 | $3,325 | |
| EBITDA | ($1,950) | ($950) | $50 | ($675) | $325 | $1,325 | $1,325 | $2,325 | $3,325 | $3,325 | $3,325 | $3,325 | |
| Interest Expense | $0 | $0 | $0 | $0 | $0 | $0 | $0 | $0 | $0 | $0 | $0 | $0 | |
| Taxes Incurred | ($585) | ($285) | $15 | ($203) | $98 | $398 | $398 | $698 | $998 | $998 | $998 | $998 | |
| Net Profit | ($1,365) | ($665) | $35 | ($473) | $228 | $928 | $928 | $1,628 | $2,328 | $2,328 | $2,328 | $2,328 | |
| Net Profit/Sales | -19.50% | -8.31% | 0.39% | -4.72% | 2.07% | 7.73% | 7.73% | 12.52% | 16.63% | 16.63% | 16.63% | 16.63% | |
| Pro Forma Cash Flow | |||||||||||||
| Month 1 | Month 2 | Month 3 | Month 4 | Month 5 | Month 6 | Month 7 | Month 8 | Month 9 | Month 10 | Month 11 | Month 12 | ||
| Cash Received | |||||||||||||
| Cash from Operations | |||||||||||||
| Cash Sales | $7,000 | $8,000 | $9,000 | $10,000 | $11,000 | $12,000 | $12,000 | $13,000 | $14,000 | $14,000 | $14,000 | $14,000 | |
| Subtotal Cash from Operations | $7,000 | $8,000 | $9,000 | $10,000 | $11,000 | $12,000 | $12,000 | $13,000 | $14,000 | $14,000 | $14,000 | $14,000 | |
| Additional Cash Received | |||||||||||||
| Sales Tax, VAT, HST/GST Received | 0.00% | $0 | $0 | $0 | $0 | $0 | $0 | $0 | $0 | $0 | $0 | $0 | $0 |
| New Current Borrowing | $0 | $0 | $0 | $0 | $0 | $0 | $0 | $0 | $0 | $0 | $0 | $0 | |
| New Other Liabilities (interest-free) | $0 | $0 | $0 | $0 | $0 | $0 | $0 | $0 | $0 | $0 | $0 | $0 | |
| New Long-term Liabilities | $0 | $0 | $0 | $0 | $0 | $0 | $0 | $0 | $0 | $0 | $0 | $0 | |
| Sales of Other Current Assets | $0 | $0 | $0 | $0 | $0 | $0 | $0 | $0 | $0 | $0 | $0 | $0 | |
| Sales of Long-term Assets | $0 | $0 | $0 | $0 | $0 | $0 | $0 | $0 | $0 | $0 | $0 | $0 | |
| New Investment Received | $0 | $0 | $0 | $0 | $0 | $0 | $0 | $0 | $0 | $0 | $0 | $0 | |
| Subtotal Cash Received | $7,000 | $8,000 | $9,000 | $10,000 | $11,000 | $12,000 | $12,000 | $13,000 | $14,000 | $14,000 | $14,000 | $14,000 | |
| Expenditures | Month 1 | Month 2 | Month 3 | Month 4 | Month 5 | Month 6 | Month 7 | Month 8 | Month 9 | Month 10 | Month 11 | Month 12 | |
| Expenditures from Operations | |||||||||||||
| Cash Spending | $6,000 | $6,000 | $6,000 | $7,500 | $7,500 | $7,500 | $7,500 | $7,500 | $7,500 | $7,500 | $7,500 | $7,500 | |
| Bill Payments | $79 | $2,375 | $2,675 | $2,965 | $2,983 | $3,283 | $3,573 | $3,583 | $3,883 | $4,173 | $4,173 | $4,173 | |
| Subtotal Spent on Operations | $6,079 | $8,375 | $8,675 | $10,465 | $10,483 | $10,783 | $11,073 | $11,083 | $11,383 | $11,673 | $11,673 | $11,673 | |
| Additional Cash Spent | |||||||||||||
| Sales Tax, VAT, HST/GST Paid Out | $0 | $0 | $0 | $0 | $0 | $0 | $0 | $0 | $0 | $0 | $0 | $0 | |
| Principal Repayment of Current Borrowing | $0 | $0 | $0 | $0 | $0 | $0 | $0 | $0 | $0 | $0 | $0 | $0 | |
| Other Liabilities Principal Repayment | $0 | $0 | $0 | $0 | $0 | $0 | $0 | $0 | $0 | $0 | $0 | $0 | |
| Long-term Liabilities Principal Repayment | $0 | $0 | $0 | $0 | $0 | $0 | $0 | $0 | $0 | $0 | $0 | $0 | |
| Purchase Other Current Assets | $0 | $0 | $0 | $0 | $0 | $0 | $0 | $0 | $0 | $0 | $0 | $0 | |
| Purchase Long-term Assets | $0 | $0 | $0 | $0 | $0 | $0 | $0 | $0 | $0 | $0 | $0 | $0 | |
| Dividends | $0 | $0 | $0 | $0 | $0 | $0 | $0 | $0 | $0 | $0 | $0 | $0 | |
| Subtotal Cash Spent | $6,079 | $8,375 | $8,675 | $10,465 | $10,483 | $10,783 | $11,073 | $11,083 | $11,383 | $11,673 | $11,673 | $11,673 | |
| Net Cash Flow | $921 | ($375) | $325 | ($465) | $518 | $1,218 | $928 | $1,918 | $2,618 | $2,328 | $2,328 | $2,328 | |
| Cash Balance | $25,821 | $25,446 | $25,771 | $25,306 | $25,823 | $27,041 | $27,968 | $29,886 | $32,503 | $34,831 | $37,158 | $39,486 | |
| Pro Forma Balance Sheet | |||||||||||||
| Month 1 | Month 2 | Month 3 | Month 4 | Month 5 | Month 6 | Month 7 | Month 8 | Month 9 | Month 10 | Month 11 | Month 12 | ||
| Assets | Starting Balances | ||||||||||||
| Current Assets | |||||||||||||
| Cash | $24,900 | $25,821 | $25,446 | $25,771 | $25,306 | $25,823 | $27,041 | $27,968 | $29,886 | $32,503 | $34,831 | $37,158 | $39,486 |
| Other Current Assets | $0 | $0 | $0 | $0 | $0 | $0 | $0 | $0 | $0 | $0 | $0 | $0 | $0 |
| Total Current Assets | $24,900 | $25,821 | $25,446 | $25,771 | $25,306 | $25,823 | $27,041 | $27,968 | $29,886 | $32,503 | $34,831 | $37,158 | $39,486 |
| Long-term Assets | |||||||||||||
| Long-term Assets | $0 | $0 | $0 | $0 | $0 | $0 | $0 | $0 | $0 | $0 | $0 | $0 | $0 |
| Accumulated Depreciation | $0 | $0 | $0 | $0 | $0 | $0 | $0 | $0 | $0 | $0 | $0 | $0 | $0 |
| Total Long-term Assets | $0 | $0 | $0 | $0 | $0 | $0 | $0 | $0 | $0 | $0 | $0 | $0 | $0 |
| Total Assets | $24,900 | $25,821 | $25,446 | $25,771 | $25,306 | $25,823 | $27,041 | $27,968 | $29,886 | $32,503 | $34,831 | $37,158 | $39,486 |
| Liabilities and Capital | Month 1 | Month 2 | Month 3 | Month 4 | Month 5 | Month 6 | Month 7 | Month 8 | Month 9 | Month 10 | Month 11 | Month 12 | |
| Current Liabilities | |||||||||||||
| Accounts Payable | $0 | $2,286 | $2,576 | $2,866 | $2,873 | $3,163 | $3,453 | $3,453 | $3,743 | $4,033 | $4,033 | $4,033 | $4,033 |
| Current Borrowing | $0 | $0 | $0 | $0 | $0 | $0 | $0 | $0 | $0 | $0 | $0 | $0 | $0 |
| Other Current Liabilities | $0 | $0 | $0 | $0 | $0 | $0 | $0 | $0 | $0 | $0 | $0 | $0 | $0 |
| Subtotal Current Liabilities | $0 | $2,286 | $2,576 | $2,866 | $2,873 | $3,163 | $3,453 | $3,453 | $3,743 | $4,033 | $4,033 | $4,033 | $4,033 |
| Long-term Liabilities | $0 | $0 | $0 | $0 | $0 | $0 | $0 | $0 | $0 | $0 | $0 | $0 | $0 |
| Total Liabilities | $0 | $2,286 | $2,576 | $2,866 | $2,873 | $3,163 | $3,453 | $3,453 | $3,743 | $4,033 | $4,033 | $4,033 | $4,033 |
| Paid-in Capital | $45,000 | $45,000 | $45,000 | $45,000 | $45,000 | $45,000 | $45,000 | $45,000 | $45,000 | $45,000 | $45,000 | $45,000 | $45,000 |
| Retained Earnings | ($20,100) | ($20,100) | ($20,100) | ($20,100) | ($20,100) | ($20,100) | ($20,100) | ($20,100) | ($20,100) | ($20,100) | ($20,100) | ($20,100) | ($20,100) |
| Earnings | $0 | ($1,365) | ($2,030) | ($1,995) | ($2,468) | ($2,240) | ($1,313) | ($385) | $1,243 | $3,570 | $5,898 | $8,225 | $10,553 |
| Total Capital | $24,900 | $23,535 | $22,870 | $22,905 | $22,433 | $22,660 | $23,588 | $24,515 | $26,143 | $28,470 | $30,798 | $33,125 | $35,453 |
| Total Liabilities and Capital | $24,900 | $25,821 | $25,446 | $25,771 | $25,306 | $25,823 | $27,041 | $27,968 | $29,886 | $32,503 | $34,831 | $37,158 | $39,486 |
| Net Worth | $24,900 | $23,535 | $22,870 | $22,905 | $22,433 | $22,660 | $23,588 | $24,515 | $26,143 | $28,470 | $30,798 | $33,125 | $35,453 |


