
Cabin Fever
Executive Summary
This plan provides detailed information on the initial establishment and operation of Cabin Fever – Child Fun Center. The plan outlines the plans for business growth, methods, procedures for operation, and infrastructure.
Cabin Fever will offer young families in Bemidji, MN and the surrounding area a quality family recreation center, with jungle gyms, soft contained play structures, slides, and imagination-inspiring play areas for children ages 2 to 5. All equipment is safety-tested and approved, employees are trained in child safety and first aid. Parents will have special seating areas where they can watch their children play actively and safely, even in the coldest, darkest months of winter, and can purchase snacks and drinks from a limited selection while they wait.
Brian Solum (owner) and Derek Giesbrecht (advisor) are responsible for the design, building, and development of the daily operations outlined in this plan. Derek is the President of Soft Play, LLC, a leading indoor playground manufacturer, and has been in the Active Play industry for many years. He has established Soft Play as the leader in the Family Entertainment Industry. Brian is a former real estate agent, a father of four, and has over seven years of experience in the child care industry. Brian will be supported by a team-oriented and customer-focused staff. Cabin Fever will retain the services of a CPA firm to perform professional company audits, prepare taxes and payroll, and serve as a business consultant to assist in setting achievable long-range strategic goals.
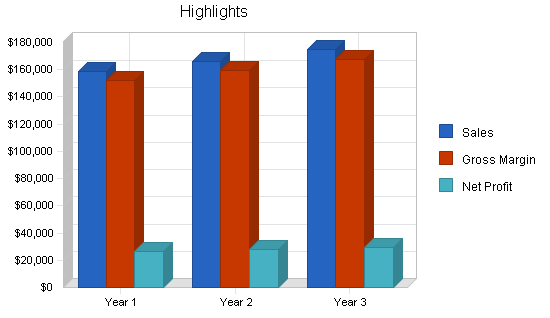
Based on the current prices in the child recreation market, Cabin Fever has the potential to make sales of $158,000 the first year. With good management, we expect a revenue growth of five percent annually. The following ratios apply in the first year:
- Gross Margin above 95%
- Net Profit Margin above 12%
- Pre-tax Return on Assets over 20%
- Net Worth over $76,000 by year three
We will minimize risk factors to Cabin Fever’s success by:
- Obtaining sufficient capital to build and cover expenses of initial operation. All investor capital will be held in escrow until the project is totally funded.
- Minimizing overhead costs, which increases the bottom line profit.
- Building a sufficient customer base. We have determined an excellent location using demographics, and our aggressive marketing program will ensure the desired results.
- Establishing community involvement to demonstrate how the business will contribute to a better quality of life.
- All payments will be cash or check, which eliminates the need for invoicing and collections.
1.1 Mission
- To provide the greater Bemidji area with a safe, fun, exciting (and profitable) child entertainment facility for children ages 2-5, and their parents, which will help children grow physically, emotionally and mentally through interactive play with their parents, peers and the facility itself.
- To listen intently to customer needs regarding the entertainment, activities and facilities relating to safety, environment and services and act accordingly with respect to those needs.
- Develop a system of safety, security and accountability on the property between the staff, paying clientele and the general public.
1.2 Keys to Success
- Location
- Service
- Safety
- Cash
1.3 Objectives
- Attract 30% of my target market to use “Cabin Fever” 1.5 times per month in the 1st year. Based upon the most recent census and demographic statistics available for this region, achieving this objective would mean attracting 3,600 paying children and 1,080 adults through the door the 1st year.
- Gain market share of 40% by 3rd year.
- Reduce debt load 37% by end of 3rd year.
Company Summary
Cabin Fever – Child Fun Center is a start-up business that will be owned, operated and managed by Brian Solum. Cabin Fever is an adult supervised children’s play center that offers a series of parent/child activities devoted to the physical, emotional and social development of children. We plan to offer a large, full scale play structure for the child and a smaller play structure for toddlers. In addition, we will also offer nominal vending, snacks and beverages for customers. The facilities are designed to entertain, exercise and stimulate children while reinforcing good social skills in a group play environment.
Cabin Fever offers a unique service in that there is no other program like it in the city of Bemidji or outlying areas. Though the city does have a restaurant with a small scale facility and run some classes for children through their parks and recreation department along with a gymnastics facility open to the public, they are not part of a comprehensive program for kids and parents. Cabin Fever will be a year round, indoor facility that hopes to be located in the booming commercial center northwest of town.
Over the past five years, there has been tremendous housing growth in the Bemidji area. Most these units are being bought or rented by families with young children. Brian Solum is starting Cabin Fever to offer parents and children a safe and exciting environment in which to spend time together and play.
Brian is a parent of three boys and has over seven years experience in the child care industry. He also has four years in a customer service based profession (real estate sales) with an additional two years sales management experience so he is currently capable of handling the sales/management, finance/administration and safety/customer relations areas, respectively.
- Working Name: Cabin Fever – Child Fun Center
- Location: Hoping for northwest Bemidji location near major shopping area, motels and airport.
- History: Start-up business for Bemidji, MN but this type of business has been successful in over 8,500 cities in the US and is also internationally in the UK, Spain, Australia, Canada, France and Japan.
- Services: Active Play = Fun, physical, social and mental entertainment to kids and parents along with modest food/beverage sales.
- Customers: Children ages 2-5 and their parents.
2.1 Start-up Summary
The start-up expenses for Cabin Fever include, play equipment, payroll, utilities, legal services, debt service and office materials needed for the facility. Brian Solum will invest $32,000. In addition, Brian will secure up to $100,800 in long-term financing to fund the enterprise. We will incur another $8,000 in short-term debt to finish financing.
Long-term assets includes most play equipment, and a larger service counter for the cafe area. Current assets includes furniture, lighting fixtures, some of the less durable play equipment, and appliances for the cafe area.
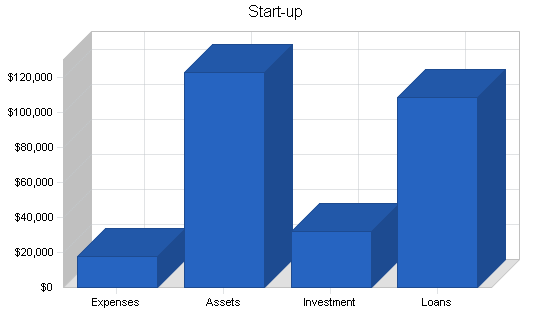
| Start-up Funding | |
| Start-up Expenses to Fund | $17,800 |
| Start-up Assets to Fund | $123,000 |
| Total Funding Required | $140,800 |
| Assets | |
| Non-cash Assets from Start-up | $115,000 |
| Cash Requirements from Start-up | $8,000 |
| Additional Cash Raised | $0 |
| Cash Balance on Starting Date | $8,000 |
| Total Assets | $123,000 |
| Liabilities and Capital | |
| Liabilities | |
| Current Borrowing | $8,000 |
| Long-term Liabilities | $100,800 |
| Accounts Payable (Outstanding Bills) | $0 |
| Other Current Liabilities (interest-free) | $0 |
| Total Liabilities | $108,800 |
| Capital | |
| Planned Investment | |
| Brian Solum | $32,000 |
| Other | $0 |
| Additional Investment Requirement | $0 |
| Total Planned Investment | $32,000 |
| Loss at Start-up (Start-up Expenses) | ($17,800) |
| Total Capital | $14,200 |
| Total Capital and Liabilities | $123,000 |
| Total Funding | $140,800 |
| Start-up | |
| Requirements | |
| Start-up Expenses | |
| Legal | $2,000 |
| Stationery etc. | $250 |
| Brochures / Advertising | $1,500 |
| Insurance | $1,200 |
| Payroll | $2,400 |
| Utilities / Phone | $1,450 |
| Research and Development | $2,000 |
| Expensed Play/Operating Equipment | $5,000 |
| Office Supplies | $2,000 |
| Total Start-up Expenses | $17,800 |
| Start-up Assets | |
| Cash Required | $8,000 |
| Other Current Assets | $25,000 |
| Long-term Assets | $90,000 |
| Total Assets | $123,000 |
| Total Requirements | $140,800 |
2.2 Company Ownership
Ownership and legal establishment is anticipated as a Sole Proprietorship and will be owned, operated and managed by Brian Solum with financial backing from a silent partner.
Products and Services
The service I am selling is called “Active Play.”
Physical Active Play for children
Playing is fun at any age. If you don’t believe me, consider what you do to relieve the stress of an active day at work or school, or how you vacation, or what you spend your money on, if you have a hobby or interest. Or, if you have children, just watch how exuberant, carefree and energized they are when they are having a good time. However, there are other benefits to Active Play besides just having a good time. Studies have shown that it is also a major factor in the appropriate mental, social, emotional and physical development of children. When children are engaged in play, they are presented with various situations, interactions and challenges. As they develop competencies in these areas, they are honing the same social, mental and physical skills they’ll need in other aspects of life.

Vicarious Active Play for Parents
There was a saying in my house when I grew up: “If mama ain’t happy, ain’t nobody happy.” I think what was meant by this was that we could drive her nuts on occasion, and when she was “nuts” we all suffered. Those occasions were typically when, as children, we were bored or stuck in the house. Therefore, I believe that this business is also selling fun, rest, and a social outlet for parents. When the kids are occupied, happy parents can enjoy a book, the newspaper, or a friend’s conversation over a cup of coffee or lunch. However, parents are also encouraged to participate with their children on the equipment themselves. Due to the nature and size of some equipment, it is able to withstand and support adults. The youngest children, in particular, will be happiest and most secure when playing with a parent.
Coffee, tea, juice, and snacks
We have a small cafe area where parents can purchase food and drinks from a (very) small menu, including kid-friendly items like peanut butter and jelly or cheese and tomato sandwiches, animal crackers, fresh carrot and celery matchsticks, and muffins from a local bakery. The items are either pre-made or require very little assembly. It is important to us to offer only healthy and appropriate snacks. We are currently planning to offer only a couple different kinds of coffee and tea, but if we get enough interest, we may invest in an espresso machine later on, and train our part-time help as baristas, since the current trend toward gourmet coffees includes young parents.
Market Analysis Summary
My market research was directly retrieved from the 2000 US Census, 2002 NARC Census and the BASC 2000 Demographics Study. Per the same data, and to get an accurate idea of current (2003) data, my totals incorporated the projected 1.3% annual growth rate to the demographics. My data was then targeted to the selected townships that use Bemidji for schooling and shopping. They were typically townships within a 24-mile radius around Bemidji. My projected income data from this demographic assumes that only one parent of the households will accompany their children to the facility.
4.1 Market Segmentation
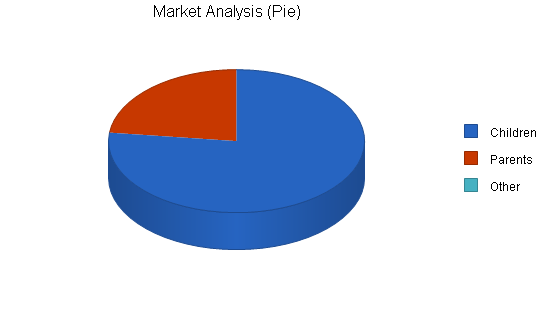
My market demographic is 100% targeted to families, specifically, households with children in the 2 – 5 year-old age group in the Bemidji area.
| Market Analysis | |||||||
| Year 1 | Year 2 | Year 3 | Year 4 | Year 5 | |||
| Potential Customers | Growth | CAGR | |||||
| Children | 1% | 4,000 | 4,052 | 4,105 | 4,158 | 4,212 | 1.30% |
| Parents | 1% | 1,200 | 1,216 | 1,232 | 1,248 | 1,264 | 1.31% |
| Other | 0% | 0 | 0 | 0 | 0 | 0 | 0.00% |
| Total | 1.30% | 5,200 | 5,268 | 5,337 | 5,406 | 5,476 | 1.30% |
4.2 Target Market Segment Strategy
Our research into the local market has indicated that a concentrated target marketing effort will yield the best results. We are therefore focusing on the 1,200 households surrounding Bemidji with 4,000 children between 2 and 5 years of age. Children in this age range are typically not yet in school yet, and in need of diverse means of recreation, including “play groups” with children of their parents’ friends. As members of this demographic, my wife and I fully understand the need and benefit of offering our children diverse recreational and physical outlets. From experience, this demographic will look for and seek out recreational opportunities for their children for not only the child’s benefit, but for the parent’s benefit as well. Out-of-home facilities that can entertain kids and give parents needed respite are in high demand.
This market is greatly under-served with respect to the services Cabin Fever plans to offer in the greater Bemidji area. The school system can provide this type of recreation to an extent, and there are some businesses that have recreational outlets. However, it is my observation that similar facilities are either too small, seasonal, have health hazards, or are not geared to younger children and their family. Winter is long here, and weather is unpredictable. “Cabin Fever” will be a preferred destination for families looking for something new, fun, and exciting for themselves and their children, especially if it promotes physical and social growth.
4.3 Service Business Analysis
About Soft Contained Play Equipment (Soft Play)
Soft Contained Play Equipment is a visually stimulating and mentally exciting configuration of tubes, slides, ladders, nets and mazes. It also incorporates devices which apply the kids’ own energies to make something move mechanically, like a sign or a front-end loader or a fire truck steering wheel. Some equipment is also designed to stimulate the child’s playful creativity such as the double-sided Fantasy Role Play Panel and the Magic Ball Popper. The whole approach of Soft Contained Play Equipment is to design their equipment through the eyes of a child. It is then developed through consultation with child development experts and adheres to ASTM F1918-98 safety requirements.
The Business
As previously mentioned, Cabin Fever is all about family recreation, specifically, child development and fun. As parents continue to look for fun and exciting activities for their kids the family entertainment center (FEC) has become increasingly popular. FECs have traditionally encompassed multiple attractions such as bowling, skating, mini-golf, batting cages, etc… but the one development that has really spurred the popularity of the FEC is soft contained play equipment. Soft contained play systems continue to be major draws to recent FECs. Kids love the fun and interactive play they provide, while parents appreciate the increased safety measures.
Local Competitors
There is a competitive market in the Family Recreation industry in Bemidji. Currently there is a roller-rink, seasonal water park, bowling ally, Gym-Bin, BSU Rec-center and a few city organized activities on a seasonal basis. However, there is no facility dedicated exclusively to building the social, physical, and mental interactions of children ages 2-5 and their parents in an exciting and stimulating environment.
4.3.1 Competition and Buying Patterns
Families make choices for family recreation activities based on cost, availability of activities appropriate for the entire household, and fun. Currently in Bemidji, activities for children under 5 are an after-thought. There may be a smaller wading pool at one end of the water park, or a special roller-skating class for 4 and 5 year olds. This discrepancy is most keenly felt by parents in the winter, when normal outdoor activities are curtailed for the youngest children. At the moment, parents of small children must choose between a small array of limited activities on a schedule not of their choosing, if they want any out-of-home play.
Safety is another major concern for parents of young children. Activities and venues that are perfectly safe for 10-year-olds may be extreme hazards for very young children. The need to be right next to their child during every moment of play in any of the existing offerings does not alow parents any respite or recreation.
Strategy and Implementation Summary
Emphasize Customer Service
Cabin Fever will differentiate themselves from other facilities. We will establish our business offering as a clear and viable alternative for our target market.
Build a Relationship-Oriented Business
Build long-term relationships with clients, not just an occasional visit. Let them become dependent on Cabin Fever. Make them understand the value of our services.
Focus on Target Markets
We need to focus our offerings on the young family who want a place outside the home to have fun, relax, and experience top quality play equipment services.
Differentiate and Fulfill the Promise
We can’t just market and sell service, we have to deliver as well. We need to make sure we have the service-intensive business we claim to have.
5.1 Competitive Edge
Cabin Fever’s competitive edge is its positioning as a strategic ally with our customers. By building a business based on long-standing relationships with satisfied customers, we simultaneously build defenses against competition. The longer the relationship stands, the more we help our customers understand what we offer them and why they should both frequent Cabin Fever, and refer it to other families. In close-knit communities like Bemidji, reputation is extremely important, and word-of-mouth advertising is invaluable. The 2 other factors in our competitive edge are:
- Location: Best location of any child type activity center — At the intersection of Interstate Highways 2 and 71 in the prime business district of the area.
- Service: Equipment and facilities to appropriately entertain the age group as well amenities catering to adults and parents in the same building. No other indoor facility in Bemidji offers such diverse services and facilities under one roof.
I do not expect parents to choose Cabin Fever exclusively over these other facilities 100% of the time, but I do believe that Soft Play equipment would be the facility of choice for play groups, birthday parties, and child recreation in the Bemidji area. There is also the possibility of Social Government Services and other health professionals directing their clients to the facility for potential therapy issues.
5.2 Marketing Strategy
Technically, my customers can come from anywhere: male and female, all races, every income level, and can be local residents or tourists to the area. That is why our marketing plan will start at the construction phase; by keeping in mind: if it looks fun, people will come. Thus the main factor to success is demonstrating that a person can enjoy themselves at the center while participating in an activity they choose. Realistically, I expect that initial customers will be more educated and affluent than the area’s average, since those types of family are generally the most concerned with providing appropriate stimulation for their very young children. We will therefore make sure to post flyers and advertisements where this group can see them.
By being on site full-time for the first year, I can make sure that customers are satisfied and can also gather information from them about the types of entertainment they most desire. This type of first-hand market research will prove invaluable in attracting more customers and retaining existing ones. A good experience for parents and children will produce best kind of advertising: word-of-mouth recommendations.
We will supplement this informal marketing with announcements, advertisements in the local newspapers and our website:
-
Print Advertising: The Bemidji Pioneer, our local daily newspaper with a circulation of over 22,000, will feature daily ads 2 weeks prior to grand opening and weekly ones thereafter.
-
Direct Mailing/Phone: Mailing lists relating to my target market are available and would be utilized weekly prior to and upon grand opening and on a monthly basis thereafter. Also, mailings and phone contact would be made to local youth organizations such as church groups, scouts and other social clubs that serve children.
-
Signage: Because Bemidji is a vacation destination, the tourism market could be substantial. Roadside billboards on Highways 71 and 2 would be implemented on the four major conduits into town. Also, all local hotels, motels and resorts would be solicited to provide signage.
-
Other Businesses: A relationship with the other businesses in town that cater to birthday parties (Party Store, Special Occasions, pizza restaurants) would be established to try and promote traffic to the facility. Advertising discounts will be offered in exchange for their service.
5.3 Sales Strategy
Cabin Fever will provide a venue in which young children can really enjoy their leisure time by participating in fun and exciting activities that require minimum strength or physical ability. Supported with great service and offered at competitive prices, I believe we have the winning combination.
Once customers choose to come to our location, they have already made a choice to buy our services. We get them there with marketing; we get them back again and again by continuing to offer high-quality, safe, and fun experiences for and with their young children. Our sales strategy involves continuing informal surveys of our customers about their preferences and needs, and keeping an open mind about changes in the adult areas. We may, in the future, institute a small cafe-type service, or offer space for young family book clubs, and so on, depending on feedback from parents.
5.3.1 Sales Forecast
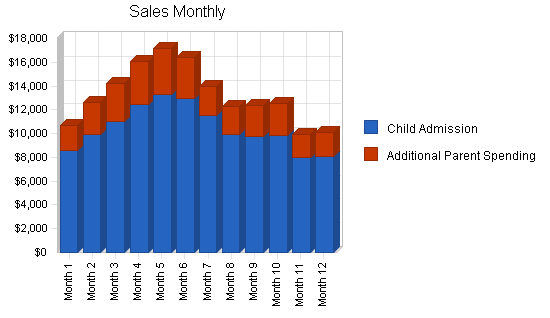
My sales forecast assumes that, on average, 37% of my market (1,465 children, out of a possible 4,000) will visit 1.5 times per month, at an admission price per child of $4.75. We project that parents will spend an average of $4 per visit on food and beverages, at a 20% cost of goods. This would allow me an 80% markup on food and beverages, a reasonable amount given the savings we will get from doing prep work ourselves in the mornings.
Sales will be higher in the winter months, when outdoor competition and free activities are limited, and lower in the summer. In keeping with my sales goals, I anticipate reaching 40% of my market by the 3rd year.

| Sales Forecast | |||
| Year 1 | Year 2 | Year 3 | |
| Sales | |||
| Child Admission | $125,222 | $131,483 | $138,057 |
| Additional Parent Spending | $33,170 | $34,829 | $36,570 |
| Total Sales | $158,392 | $166,312 | $174,627 |
| Direct Cost of Sales | Year 1 | Year 2 | Year 3 |
| Child Admission | $0 | $0 | $0 |
| Additional Parent Spending | $6,634 | $6,966 | $7,314 |
| Subtotal Direct Cost of Sales | $6,634 | $6,966 | $7,314 |
Web Plan Summary
We are currently working on developing a website for Cabin Fever. A friend of the family is doing the design work for free, and Brian’s wife (who has a thorough knowledge of HTML) will update the content regularly – we do not plan on including any e-commerce capabilities, since they are unnecessary; the website is primarily a marketing tool. We plan to launch our website early in 2005.
Management Summary
Management: Initially, and for the first year, of operation I anticipate acting as owner/operator/manager. In the future, depending on cash flow or if a gap in service is identified, a FT manager would be implemented to work alongside myself and the rest of the team. Management will be responsible for overseeing all business aspects including but not limited to: Deposits, marketing, safety, scheduling, customer service and staff support and training, cleaning and general maintenance, food prep and service. Minimum qualifications are:
- Child Safety, First Aid / CPR certified
- Three years management experience
- Mature, responsible adult
- Enthusiastic, flexible and self motivated
- Knowledge of marketing
- High sense of professionalism
FT Employees: Based on my assumed hours of operation, I anticipate hiring one FT employee working a 45 hour week. I will look for adults interested and experienced with children who are child safety CPR and first aid certified. Responsibilities will include but are not limited to: Checking in and greeting customers as they arrive, general cleaning and light maintenance, food service. Minimum qualifications are:
- Mature, responsible adult
- Experience with children in a play setting
- Child Safety First Aid / CPR certified
PT Employees: Again, based on assumed hours of operation I anticipate needing at least two PT employees to fill potential gaps in busy times and work weekend hours. While the business could be run with one PT employee I would hire one extra in the need of special circumstances such as holiday, party or weekend crowds as well as filling in for illness and vacation possibilities. Responsibilities would include but not be limited to: Checking in and greeting customers as they arrive, general cleaning and light maintenance. Minimum qualifications would be:
- Mature, responsible adult
- Experience with children in a play setting
- Child Safety First Aid / CPR certified
7.1 Personnel Plan
The company will make gradual investments in personnel on a need basis, always keeping in mind the number of children and parents serviced at the facility with respect to cash flow. Additional full-time paid management will be addressed after the first year of operation and an additional PT employee is built in to the Personnel Table. As owner, I do plan on being on site full-time and will fill the managerial role.
I am committed to paying my employees a fair and equitable wage for their hard work, and giving them benefits such as sick time and vacation time.
Financial Plan
The most important element in my financial plan is initiating, maintaining, and improving the factors that create, stabilize, and increase the cash flow. These items are:
- High visibility so as to create customer flow.
- A trained, enthusiastic and knowledgeable staff that answers to customer needs to keep them coming back again and again.
- Annual modernization and update of the facility equipment to create new experiences for children.
8.1 Important Assumptions
Commercial lending is currently set at 7% for long term (20 year) lending.
| General Assumptions | |||
| Year 1 | Year 2 | Year 3 | |
| Plan Month | 1 | 2 | 3 |
| Current Interest Rate | 7.00% | 7.00% | 7.00% |
| Long-term Interest Rate | 7.00% | 7.00% | 7.00% |
| Tax Rate | 30.00% | 30.00% | 30.00% |
| Other | 0 | 0 | 0 |
8.2 Break-even Analysis
The Break Even chart assumes fixed monthly expenses of approximately $9,600. The expenses are the total of estimated monthly utilities, phone, payroll, legal, insurance, marketing and rent figures. Variable monthly costs are shown as a percentage of total sales. Average Monthly Sales for the first year are anticipated around $13,200 and the break even point would be at $10,069, leaving adequate room and cash flow for possible costs initially overlooked. These figures show a comfortable cushion for operating expenses.

| Break-even Analysis | |
| Monthly Revenue Break-even | $9,329 |
| Assumptions: | |
| Average Percent Variable Cost | 4% |
| Estimated Monthly Fixed Cost | $8,938 |
8.3 Projected Profit and Loss
The company will show a profit in the first year of operation. The yearly analysis is indicated in the table below, and the monthly analysis can be found in the appendix. Our most significant operating expenses will be payroll, marketing, and rent. We project a modest net profit increasing gradually over the next three years as we streamline operations.


| Pro Forma Profit and Loss | |||
| Year 1 | Year 2 | Year 3 | |
| Sales | $158,392 | $166,312 | $174,627 |
| Direct Cost of Sales | $6,634 | $6,966 | $7,314 |
| Other Costs of Goods | $0 | $0 | $0 |
| Total Cost of Sales | $6,634 | $6,966 | $7,314 |
| Gross Margin | $151,758 | $159,346 | $167,313 |
| Gross Margin % | 95.81% | 95.81% | 95.81% |
| Expenses | |||
| Payroll | $58,400 | $64,400 | $70,400 |
| Marketing/Promotion | $12,668 | $13,089 | $13,521 |
| Depreciation | $6,960 | $7,000 | $7,000 |
| Rent | $12,000 | $12,000 | $12,000 |
| Utilities / Phone / Internet | $7,680 | $7,680 | $7,680 |
| Insurance | $4,800 | $4,800 | $4,800 |
| Payroll Taxes | $0 | $0 | $0 |
| CPA | $3,000 | $3,000 | $3,000 |
| Website hosting | $250 | $300 | $325 |
| Office Expenses | $1,500 | $1,500 | $1,500 |
| Total Operating Expenses | $107,258 | $113,769 | $120,226 |
| Profit Before Interest and Taxes | $44,500 | $45,577 | $47,087 |
| EBITDA | $51,460 | $52,577 | $54,087 |
| Interest Expense | $7,105 | $6,202 | $5,259 |
| Taxes Incurred | $11,218 | $11,812 | $12,548 |
| Net Profit | $26,176 | $27,562 | $29,279 |
| Net Profit/Sales | 16.53% | 16.57% | 16.77% |
8.4 Projected Cash Flow
Long Term Debt: My long term debt payments are based on a 10-year note, principle balance of $100,800 @ 7% interest. Principal repayments are shown below, while interest is listed in the profit and Loss. Although the yearly projections indicate a straight-line repayment, we may pay off more principal after year one, depending on cash flow.
Capital Improvements: Making changes to the play structure will need to occur as to keep the facility fresh and new for customers. These changes will take place on an annual basis after the first year with the liquidation of old play materials and the acquisition of new ones.

| Pro Forma Cash Flow | |||
| Year 1 | Year 2 | Year 3 | |
| Cash Received | |||
| Cash from Operations | |||
| Cash Sales | $158,392 | $166,312 | $174,627 |
| Subtotal Cash from Operations | $158,392 | $166,312 | $174,627 |
| Additional Cash Received | |||
| Sales Tax, VAT, HST/GST Received | $0 | $0 | $0 |
| New Current Borrowing | $0 | $0 | $0 |
| New Other Liabilities (interest-free) | $0 | $0 | $0 |
| New Long-term Liabilities | $0 | $0 | $0 |
| Sales of Other Current Assets | $0 | $6,000 | $6,000 |
| Sales of Long-term Assets | $0 | $0 | $0 |
| New Investment Received | $0 | $0 | $0 |
| Subtotal Cash Received | $158,392 | $172,312 | $180,627 |
| Expenditures | Year 1 | Year 2 | Year 3 |
| Expenditures from Operations | |||
| Cash Spending | $58,400 | $64,400 | $70,400 |
| Bill Payments | $63,026 | $65,644 | $67,898 |
| Subtotal Spent on Operations | $121,426 | $130,044 | $138,298 |
| Additional Cash Spent | |||
| Sales Tax, VAT, HST/GST Paid Out | $0 | $0 | $0 |
| Principal Repayment of Current Borrowing | $2,665 | $2,670 | $2,665 |
| Other Liabilities Principal Repayment | $0 | $0 | $0 |
| Long-term Liabilities Principal Repayment | $10,800 | $10,800 | $10,800 |
| Purchase Other Current Assets | $0 | $0 | $0 |
| Purchase Long-term Assets | $0 | $12,000 | $12,000 |
| Dividends | $0 | $0 | $0 |
| Subtotal Cash Spent | $134,891 | $155,514 | $163,763 |
| Net Cash Flow | $23,501 | $16,798 | $16,864 |
| Cash Balance | $31,501 | $48,299 | $65,163 |
8.5 Projected Balance Sheet
My Projected Balance Sheet shows that I should not have any difficulty meeting my debt obligations. My Marketing Plan should be sufficient to meet the projections. Most significantly, Cabin Fever’s net worth will increase to approximately $77,500 by year three.
| Pro Forma Balance Sheet | |||
| Year 1 | Year 2 | Year 3 | |
| Assets | |||
| Current Assets | |||
| Cash | $31,501 | $48,299 | $65,163 |
| Other Current Assets | $25,000 | $19,000 | $13,000 |
| Total Current Assets | $56,501 | $67,299 | $78,163 |
| Long-term Assets | |||
| Long-term Assets | $90,000 | $102,000 | $114,000 |
| Accumulated Depreciation | $6,960 | $13,960 | $20,960 |
| Total Long-term Assets | $83,040 | $88,040 | $93,040 |
| Total Assets | $139,541 | $155,339 | $171,203 |
| Liabilities and Capital | Year 1 | Year 2 | Year 3 |
| Current Liabilities | |||
| Accounts Payable | $3,830 | $5,536 | $5,585 |
| Current Borrowing | $5,335 | $2,665 | $0 |
| Other Current Liabilities | $0 | $0 | $0 |
| Subtotal Current Liabilities | $9,165 | $8,201 | $5,585 |
| Long-term Liabilities | $90,000 | $79,200 | $68,400 |
| Total Liabilities | $99,165 | $87,401 | $73,985 |
| Paid-in Capital | $32,000 | $32,000 | $32,000 |
| Retained Earnings | ($17,800) | $8,376 | $35,939 |
| Earnings | $26,176 | $27,562 | $29,279 |
| Total Capital | $40,376 | $67,939 | $97,218 |
| Total Liabilities and Capital | $139,541 | $155,339 | $171,203 |
| Net Worth | $40,376 | $67,939 | $97,218 |
8.6 Business Ratios
The following table outlines some of the more important ratios from the Recreation Center industry. The final column, Industry Profile, details specific ratios based on the industry as it is classified by the Standard Industry Classification (SIC) code, 7999.
We project a higher ratio of long-term to short-term liabilities than is the industry standard. We also project higher expenses for operating expenses and advertising; part of this discrepancy is the result of being a start-up, with no existing reputation. Another is our committment to pay employees a fair wage with decent benefits, including sick time and vacation time. All asset to liability ratios indicate a high ability to pay our creditors.
| Ratio Analysis | ||||
| Year 1 | Year 2 | Year 3 | Industry Profile | |
| Sales Growth | 0.00% | 5.00% | 5.00% | 4.94% |
| Percent of Total Assets | ||||
| Other Current Assets | 17.92% | 12.23% | 7.59% | 36.35% |
| Total Current Assets | 40.49% | 43.32% | 45.66% | 43.63% |
| Long-term Assets | 59.51% | 56.68% | 54.34% | 56.37% |
| Total Assets | 100.00% | 100.00% | 100.00% | 100.00% |
| Current Liabilities | 6.57% | 5.28% | 3.26% | 21.68% |
| Long-term Liabilities | 64.50% | 50.99% | 39.95% | 31.17% |
| Total Liabilities | 71.07% | 56.26% | 43.21% | 52.85% |
| Net Worth | 28.93% | 43.74% | 56.79% | 47.15% |
| Percent of Sales | ||||
| Sales | 100.00% | 100.00% | 100.00% | 100.00% |
| Gross Margin | 95.81% | 95.81% | 95.81% | 100.00% |
| Selling, General & Administrative Expenses | 79.29% | 79.24% | 79.04% | 76.74% |
| Advertising Expenses | 4.42% | 4.21% | 4.01% | 2.84% |
| Profit Before Interest and Taxes | 28.09% | 27.40% | 26.96% | 2.11% |
| Main Ratios | ||||
| Current | 6.16 | 8.21 | 14.00 | 1.05 |
| Quick | 6.16 | 8.21 | 14.00 | 0.69 |
| Total Debt to Total Assets | 71.07% | 56.26% | 43.21% | 62.49% |
| Pre-tax Return on Net Worth | 92.62% | 57.96% | 43.02% | 2.98% |
| Pre-tax Return on Assets | 26.80% | 25.35% | 24.43% | 7.95% |
| Additional Ratios | Year 1 | Year 2 | Year 3 | |
| Net Profit Margin | 16.53% | 16.57% | 16.77% | n.a |
| Return on Equity | 64.83% | 40.57% | 30.12% | n.a |
| Activity Ratios | ||||
| Accounts Payable Turnover | 17.45 | 12.17 | 12.17 | n.a |
| Payment Days | 27 | 25 | 30 | n.a |
| Total Asset Turnover | 1.14 | 1.07 | 1.02 | n.a |
| Debt Ratios | ||||
| Debt to Net Worth | 2.46 | 1.29 | 0.76 | n.a |
| Current Liab. to Liab. | 0.09 | 0.09 | 0.08 | n.a |
| Liquidity Ratios | ||||
| Net Working Capital | $47,336 | $59,099 | $72,578 | n.a |
| Interest Coverage | 6.26 | 7.35 | 8.95 | n.a |
| Additional Ratios | ||||
| Assets to Sales | 0.88 | 0.93 | 0.98 | n.a |
| Current Debt/Total Assets | 7% | 5% | 3% | n.a |
| Acid Test | 6.16 | 8.21 | 14.00 | n.a |
| Sales/Net Worth | 3.92 | 2.45 | 1.80 | n.a |
| Dividend Payout | 0.00 | 0.00 | 0.00 | n.a |
Appendix
| Sales Forecast | |||||||||||||
| Month 1 | Month 2 | Month 3 | Month 4 | Month 5 | Month 6 | Month 7 | Month 8 | Month 9 | Month 10 | Month 11 | Month 12 | ||
| Sales | |||||||||||||
| Child Admission | 0% | $8,550 | $9,894 | $10,986 | $12,456 | $13,296 | $12,944 | $11,532 | $9,908 | $9,740 | $9,880 | $7,962 | $8,074 |
| Additional Parent Spending | 0% | $2,160 | $2,711 | $3,244 | $3,574 | $3,840 | $3,498 | $2,442 | $2,410 | $2,646 | $2,659 | $1,962 | $2,026 |
| Total Sales | $10,710 | $12,605 | $14,230 | $16,030 | $17,136 | $16,442 | $13,974 | $12,318 | $12,386 | $12,539 | $9,924 | $10,100 | |
| Direct Cost of Sales | Month 1 | Month 2 | Month 3 | Month 4 | Month 5 | Month 6 | Month 7 | Month 8 | Month 9 | Month 10 | Month 11 | Month 12 | |
| Child Admission | $0 | $0 | $0 | $0 | $0 | $0 | $0 | $0 | $0 | $0 | $0 | $0 | |
| Additional Parent Spending | $432 | $542 | $649 | $715 | $768 | $700 | $488 | $482 | $529 | $532 | $392 | $405 | |
| Subtotal Direct Cost of Sales | $432 | $542 | $649 | $715 | $768 | $700 | $488 | $482 | $529 | $532 | $392 | $405 | |
| Personnel Plan | |||||||||||||
| Month 1 | Month 2 | Month 3 | Month 4 | Month 5 | Month 6 | Month 7 | Month 8 | Month 9 | Month 10 | Month 11 | Month 12 | ||
| Owner/Manager | 0% | $0 | $0 | $2,000 | $2,000 | $2,000 | $2,000 | $2,000 | $2,000 | $2,000 | $2,000 | $2,000 | $2,000 |
| FT Employee | 0% | $2,000 | $2,000 | $2,000 | $2,000 | $2,000 | $2,000 | $2,000 | $2,000 | $2,000 | $2,000 | $2,000 | $2,000 |
| PT Employee | 0% | $600 | $600 | $600 | $600 | $600 | $600 | $600 | $600 | $600 | $600 | $600 | $600 |
| PT Employee | 0% | $600 | $600 | $600 | $600 | $600 | $600 | $600 | $600 | $600 | $600 | $600 | $600 |
| Other | 0% | $0 | $0 | $0 | $0 | $0 | $0 | $0 | $0 | $0 | $0 | $0 | $0 |
| Total People | 4 | 4 | 4 | 4 | 4 | 4 | 4 | 4 | 4 | 4 | 4 | 4 | |
| Total Payroll | $3,200 | $3,200 | $5,200 | $5,200 | $5,200 | $5,200 | $5,200 | $5,200 | $5,200 | $5,200 | $5,200 | $5,200 | |
| Pro Forma Profit and Loss | |||||||||||||
| Month 1 | Month 2 | Month 3 | Month 4 | Month 5 | Month 6 | Month 7 | Month 8 | Month 9 | Month 10 | Month 11 | Month 12 | ||
| Sales | $10,710 | $12,605 | $14,230 | $16,030 | $17,136 | $16,442 | $13,974 | $12,318 | $12,386 | $12,539 | $9,924 | $10,100 | |
| Direct Cost of Sales | $432 | $542 | $649 | $715 | $768 | $700 | $488 | $482 | $529 | $532 | $392 | $405 | |
| Other Costs of Goods | $0 | $0 | $0 | $0 | $0 | $0 | $0 | $0 | $0 | $0 | $0 | $0 | |
| Total Cost of Sales | $432 | $542 | $649 | $715 | $768 | $700 | $488 | $482 | $529 | $532 | $392 | $405 | |
| Gross Margin | $10,278 | $12,063 | $13,581 | $15,315 | $16,368 | $15,742 | $13,485 | $11,836 | $11,857 | $12,007 | $9,531 | $9,694 | |
| Gross Margin % | 95.97% | 95.70% | 95.44% | 95.54% | 95.52% | 95.75% | 96.51% | 96.09% | 95.73% | 95.76% | 96.05% | 95.99% | |
| Expenses | |||||||||||||
| Payroll | $3,200 | $3,200 | $5,200 | $5,200 | $5,200 | $5,200 | $5,200 | $5,200 | $5,200 | $5,200 | $5,200 | $5,200 | |
| Marketing/Promotion | 8% | $857 | $1,008 | $1,138 | $1,282 | $1,370 | $1,315 | $1,118 | $985 | $990 | $1,003 | $794 | $808 |
| Depreciation | $580 | $580 | $580 | $580 | $580 | $580 | $580 | $580 | $580 | $580 | $580 | $580 | |
| Rent | $1,000 | $1,000 | $1,000 | $1,000 | $1,000 | $1,000 | $1,000 | $1,000 | $1,000 | $1,000 | $1,000 | $1,000 | |
| Utilities / Phone / Internet | $640 | $640 | $640 | $640 | $640 | $640 | $640 | $640 | $640 | $640 | $640 | $640 | |
| Insurance | $1,200 | $0 | $0 | $1,200 | $0 | $0 | $1,200 | $0 | $0 | $1,200 | $0 | $0 | |
| Payroll Taxes | 15% | $0 | $0 | $0 | $0 | $0 | $0 | $0 | $0 | $0 | $0 | $0 | $0 |
| CPA | $250 | $250 | $250 | $250 | $250 | $250 | $250 | $250 | $250 | $250 | $250 | $250 | |
| Website hosting | 15% | $0 | $0 | $25 | $25 | $25 | $25 | $25 | $25 | $25 | $25 | $25 | $25 |
| Office Expenses | $125 | $125 | $125 | $125 | $125 | $125 | $125 | $125 | $125 | $125 | $125 | $125 | |
| Total Operating Expenses | $7,852 | $6,803 | $8,958 | $10,302 | $9,190 | $9,135 | $10,138 | $8,805 | $8,810 | $10,023 | $8,614 | $8,628 | |
| Profit Before Interest and Taxes | $2,426 | $5,260 | $4,623 | $5,013 | $7,178 | $6,607 | $3,347 | $3,031 | $3,047 | $1,984 | $917 | $1,066 | |
| EBITDA | $3,006 | $5,840 | $5,203 | $5,593 | $7,758 | $7,187 | $3,927 | $3,611 | $3,627 | $2,564 | $1,497 | $1,646 | |
| Interest Expense | $628 | $622 | $615 | $608 | $602 | $595 | $589 | $582 | $576 | $569 | $563 | $556 | |
| Taxes Incurred | $539 | $1,392 | $1,202 | $1,321 | $1,973 | $1,804 | $828 | $735 | $741 | $425 | $106 | $153 | |
| Net Profit | $1,259 | $3,247 | $2,805 | $3,083 | $4,603 | $4,208 | $1,931 | $1,714 | $1,730 | $991 | $248 | $357 | |
| Net Profit/Sales | 11.75% | 25.76% | 19.72% | 19.23% | 26.86% | 25.59% | 13.82% | 13.91% | 13.97% | 7.90% | 2.50% | 3.54% | |
| Pro Forma Cash Flow | |||||||||||||
| Month 1 | Month 2 | Month 3 | Month 4 | Month 5 | Month 6 | Month 7 | Month 8 | Month 9 | Month 10 | Month 11 | Month 12 | ||
| Cash Received | |||||||||||||
| Cash from Operations | |||||||||||||
| Cash Sales | $10,710 | $12,605 | $14,230 | $16,030 | $17,136 | $16,442 | $13,974 | $12,318 | $12,386 | $12,539 | $9,924 | $10,100 | |
| Subtotal Cash from Operations | $10,710 | $12,605 | $14,230 | $16,030 | $17,136 | $16,442 | $13,974 | $12,318 | $12,386 | $12,539 | $9,924 | $10,100 | |
| Additional Cash Received | |||||||||||||
| Sales Tax, VAT, HST/GST Received | 0.00% | $0 | $0 | $0 | $0 | $0 | $0 | $0 | $0 | $0 | $0 | $0 | $0 |
| New Current Borrowing | $0 | $0 | $0 | $0 | $0 | $0 | $0 | $0 | $0 | $0 | $0 | $0 | |
| New Other Liabilities (interest-free) | $0 | $0 | $0 | $0 | $0 | $0 | $0 | $0 | $0 | $0 | $0 | $0 | |
| New Long-term Liabilities | $0 | $0 | $0 | $0 | $0 | $0 | $0 | $0 | $0 | $0 | $0 | $0 | |
| Sales of Other Current Assets | $0 | $0 | $0 | $0 | $0 | $0 | $0 | $0 | $0 | $0 | $0 | $0 | |
| Sales of Long-term Assets | $0 | $0 | $0 | $0 | $0 | $0 | $0 | $0 | $0 | $0 | $0 | $0 | |
| New Investment Received | $0 | $0 | $0 | $0 | $0 | $0 | $0 | $0 | $0 | $0 | $0 | $0 | |
| Subtotal Cash Received | $10,710 | $12,605 | $14,230 | $16,030 | $17,136 | $16,442 | $13,974 | $12,318 | $12,386 | $12,539 | $9,924 | $10,100 | |
| Expenditures | Month 1 | Month 2 | Month 3 | Month 4 | Month 5 | Month 6 | Month 7 | Month 8 | Month 9 | Month 10 | Month 11 | Month 12 | |
| Expenditures from Operations | |||||||||||||
| Cash Spending | $3,200 | $3,200 | $5,200 | $5,200 | $5,200 | $5,200 | $5,200 | $5,200 | $5,200 | $5,200 | $5,200 | $5,200 | |
| Bill Payments | $189 | $5,668 | $5,581 | $5,695 | $7,153 | $6,743 | $6,447 | $6,215 | $4,825 | $4,906 | $5,706 | $3,898 | |
| Subtotal Spent on Operations | $3,389 | $8,868 | $10,781 | $10,895 | $12,353 | $11,943 | $11,647 | $11,415 | $10,025 | $10,106 | $10,906 | $9,098 | |
| Additional Cash Spent | |||||||||||||
| Sales Tax, VAT, HST/GST Paid Out | $0 | $0 | $0 | $0 | $0 | $0 | $0 | $0 | $0 | $0 | $0 | $0 | |
| Principal Repayment of Current Borrowing | $222 | $222 | $222 | $222 | $222 | $222 | $222 | $222 | $222 | $222 | $222 | $223 | |
| Other Liabilities Principal Repayment | $0 | $0 | $0 | $0 | $0 | $0 | $0 | $0 | $0 | $0 | $0 | $0 | |
| Long-term Liabilities Principal Repayment | $900 | $900 | $900 | $900 | $900 | $900 | $900 | $900 | $900 | $900 | $900 | $900 | |
| Purchase Other Current Assets | $0 | $0 | $0 | $0 | $0 | $0 | $0 | $0 | $0 | $0 | $0 | $0 | |
| Purchase Long-term Assets | $0 | $0 | $0 | $0 | $0 | $0 | $0 | $0 | $0 | $0 | $0 | $0 | |
| Dividends | $0 | $0 | $0 | $0 | $0 | $0 | $0 | $0 | $0 | $0 | $0 | $0 | |
| Subtotal Cash Spent | $4,511 | $9,990 | $11,903 | $12,017 | $13,475 | $13,065 | $12,769 | $12,537 | $11,147 | $11,228 | $12,028 | $10,221 | |
| Net Cash Flow | $6,199 | $2,615 | $2,327 | $4,013 | $3,661 | $3,377 | $1,205 | ($219) | $1,239 | $1,311 | ($2,105) | ($121) | |
| Cash Balance | $14,199 | $16,814 | $19,141 | $23,154 | $26,815 | $30,192 | $31,396 | $31,177 | $32,416 | $33,727 | $31,622 | $31,501 | |
| Pro Forma Balance Sheet | |||||||||||||
| Month 1 | Month 2 | Month 3 | Month 4 | Month 5 | Month 6 | Month 7 | Month 8 | Month 9 | Month 10 | Month 11 | Month 12 | ||
| Assets | Starting Balances | ||||||||||||
| Current Assets | |||||||||||||
| Cash | $8,000 | $14,199 | $16,814 | $19,141 | $23,154 | $26,815 | $30,192 | $31,396 | $31,177 | $32,416 | $33,727 | $31,622 | $31,501 |
| Other Current Assets | $25,000 | $25,000 | $25,000 | $25,000 | $25,000 | $25,000 | $25,000 | $25,000 | $25,000 | $25,000 | $25,000 | $25,000 | $25,000 |
| Total Current Assets | $33,000 | $39,199 | $41,814 | $44,141 | $48,154 | $51,815 | $55,192 | $56,396 | $56,177 | $57,416 | $58,727 | $56,622 | $56,501 |
| Long-term Assets | |||||||||||||
| Long-term Assets | $90,000 | $90,000 | $90,000 | $90,000 | $90,000 | $90,000 | $90,000 | $90,000 | $90,000 | $90,000 | $90,000 | $90,000 | $90,000 |
| Accumulated Depreciation | $0 | $580 | $1,160 | $1,740 | $2,320 | $2,900 | $3,480 | $4,060 | $4,640 | $5,220 | $5,800 | $6,380 | $6,960 |
| Total Long-term Assets | $90,000 | $89,420 | $88,840 | $88,260 | $87,680 | $87,100 | $86,520 | $85,940 | $85,360 | $84,780 | $84,200 | $83,620 | $83,040 |
| Total Assets | $123,000 | $128,619 | $130,654 | $132,401 | $135,834 | $138,915 | $141,712 | $142,336 | $141,537 | $142,196 | $142,927 | $140,242 | $139,541 |
| Liabilities and Capital | Month 1 | Month 2 | Month 3 | Month 4 | Month 5 | Month 6 | Month 7 | Month 8 | Month 9 | Month 10 | Month 11 | Month 12 | |
| Current Liabilities | |||||||||||||
| Accounts Payable | $0 | $5,482 | $5,392 | $5,456 | $6,928 | $6,528 | $6,238 | $6,054 | $4,663 | $4,714 | $5,576 | $3,766 | $3,830 |
| Current Borrowing | $8,000 | $7,778 | $7,556 | $7,334 | $7,112 | $6,890 | $6,668 | $6,446 | $6,224 | $6,002 | $5,780 | $5,558 | $5,335 |
| Other Current Liabilities | $0 | $0 | $0 | $0 | $0 | $0 | $0 | $0 | $0 | $0 | $0 | $0 | $0 |
| Subtotal Current Liabilities | $8,000 | $13,260 | $12,948 | $12,790 | $14,040 | $13,418 | $12,906 | $12,500 | $10,887 | $10,716 | $11,356 | $9,324 | $9,165 |
| Long-term Liabilities | $100,800 | $99,900 | $99,000 | $98,100 | $97,200 | $96,300 | $95,400 | $94,500 | $93,600 | $92,700 | $91,800 | $90,900 | $90,000 |
| Total Liabilities | $108,800 | $113,160 | $111,948 | $110,890 | $111,240 | $109,718 | $108,306 | $107,000 | $104,487 | $103,416 | $103,156 | $100,224 | $99,165 |
| Paid-in Capital | $32,000 | $32,000 | $32,000 | $32,000 | $32,000 | $32,000 | $32,000 | $32,000 | $32,000 | $32,000 | $32,000 | $32,000 | $32,000 |
| Retained Earnings | ($17,800) | ($17,800) | ($17,800) | ($17,800) | ($17,800) | ($17,800) | ($17,800) | ($17,800) | ($17,800) | ($17,800) | ($17,800) | ($17,800) | ($17,800) |
| Earnings | $0 | $1,259 | $4,505 | $7,311 | $10,394 | $14,997 | $19,205 | $21,136 | $22,850 | $24,580 | $25,571 | $25,819 | $26,176 |
| Total Capital | $14,200 | $15,459 | $18,705 | $21,511 | $24,594 | $29,197 | $33,405 | $35,336 | $37,050 | $38,780 | $39,771 | $40,019 | $40,376 |
| Total Liabilities and Capital | $123,000 | $128,619 | $130,654 | $132,401 | $135,834 | $138,915 | $141,712 | $142,336 | $141,537 | $142,196 | $142,927 | $140,242 | $139,541 |
| Net Worth | $14,200 | $15,459 | $18,705 | $21,511 | $24,594 | $29,197 | $33,405 | $35,336 | $37,050 | $38,780 | $39,771 | $40,019 | $40,376 |


