
Bees' Circus
Executive Summary
Bees’ Circus is a children’s play and music program that offers a series of parent/child programs devoted to the physical, emotional and social development of children. We offer eight different weekly classes for children newborn through four years. The activities are designed to improve balance, coordination and other sensory stimuli while reinforcing good social skills in a group play environment. Bees’ Circus also offers music classes. Children 16 months through four years, will enjoy singing and dancing while getting their first taste of different musical beats and rhythms. Each week, new musical styles will be introduced, such as jazz, contemporary, and classical tunes. Activities such as instrument exploration, songs and movement to music are designed to provide a positive musical experience for both parents and young children.
Bees’ Circus offers a unique service in that there is no other program like it in the city of Monroe. Though the city does run some classes for children through their parks and recreation department, they are not part of a comprehensive growth program for pre-schoolers.
Bees’ Circus is centrally located in the new commercial center that serves the affluent northwest area of Monroe. Over the past five years, there has been tremendous housing growth in the northwest of the city. To date, 3,500 new housing units have been built in the area to accommodate the growth of the city’s population. Most these units are being bought or rented by young families with young children. Currently, there is no park program servicing the area. It is anticipated that a new park will be created in the next three years to serve the estimated 10,000 families in the area.
Barbara Miller, co-owner of Bees’ Circus, has been an educator for over 20 years and has been instrumental in the development of Monroe’s pre-school programs. She is starting Bees’ Circus to offer parents and children a nurturing environment in which to spend time together and play.

1.1 Mission
The mission of Bees’ Circus is to promote the physical, emotional and social development of children. Parents are also a central part of Bees’ Circus activities.
When parents enter their child’s world of play and imagination, the child blossoms with more confidence to explore and learn. Time spent playing with mom or dad contributes to healthy emotional development and will also build trust between parent and child.
1.2 Objectives
The objectives of Bees’ Circus are as follows:
- Fill classes to 70% capacity by end of first year of operation.
- Retain at least 50% of children moving from one class level to the next.
- Increase the number of families participating in classes by 15% during the second year of operation.
Company Summary
Bees’ Circus is a children’s play and music program that offers a series of parent/child programs devoted to the physical, emotional and social development of children. The program will operate as a limited partnership. Barbara Miller will manage the daily operation of Bees’ Circus. A silent partner will have accounting oversight responsibilities.
Bees’ Circus is located in the Northtowne Center at 3456 Briggs Road. The program space is 7,000 square feet and includes a music room and a party room. Up to 40 children can play and work in the space at the same time.
2.1 Start-up Summary
The start-up expenses for the Bees’ Circus is focused primarily on equipment, play surfaces, and materials needed for the classes. Barbara Miller and the silent partner will invest equal amounts. In addition, Barbara will secure a long-term loan and use credit card debt to fund the enterprise.

| Start-up | |
| Requirements | |
| Start-up Expenses | |
| Legal | $1,000 |
| Stationery etc. | $200 |
| Brochures | $1,000 |
| Consultants | $3,000 |
| Insurance | $1,000 |
| Rent | $2,000 |
| Expensed Equipment | $60,000 |
| Total Start-up Expenses | $68,200 |
| Start-up Assets | |
| Cash Required | $51,800 |
| Other Current Assets | $0 |
| Long-term Assets | $30,000 |
| Total Assets | $81,800 |
| Total Requirements | $150,000 |
| Start-up Funding | |
| Start-up Expenses to Fund | $68,200 |
| Start-up Assets to Fund | $81,800 |
| Total Funding Required | $150,000 |
| Assets | |
| Non-cash Assets from Start-up | $30,000 |
| Cash Requirements from Start-up | $51,800 |
| Additional Cash Raised | $0 |
| Cash Balance on Starting Date | $51,800 |
| Total Assets | $81,800 |
| Liabilities and Capital | |
| Liabilities | |
| Current Borrowing | $30,000 |
| Long-term Liabilities | $50,000 |
| Accounts Payable (Outstanding Bills) | $0 |
| Other Current Liabilities (interest-free) | $0 |
| Total Liabilities | $80,000 |
| Capital | |
| Planned Investment | |
| Barbara Miller | $30,000 |
| Investor 2 | $40,000 |
| Additional Investment Requirement | $0 |
| Total Planned Investment | $70,000 |
| Loss at Start-up (Start-up Expenses) | ($68,200) |
| Total Capital | $1,800 |
| Total Capital and Liabilities | $81,800 |
| Total Funding | $150,000 |
2.2 Company Ownership
Bees’ Circus is owned by Barbara Miller and a silent partner.
Services
Bees’ Circus offers six different weekly classes for children newborn through four years. Activities are designed to help children develop balance, coordination and other sensory stimuli while having fun in a group play environment.
Bees’ Circus also offers three music classes. Children 16 months through four years get to sing and move while getting their first taste of different musical beats and rhythms. Teachers introduce children to new musical styles each week, such as jazz, contemporary, and classical tunes. Activities such as instrument exploration, songs and movement to music are designed to provide a positive musical experience for parents and young children.
All play and music classes last 45 minutes and are taught to child-parent pairs in small groups. The fee is $100 per class. The parents can pick which two weekday day sessions she wants to attend with her child. Each class is a month long.
NewBees (newborn) classes addresses the special needs of newborns and their parents. Activities are designed to gently stimulate the baby’s learning skills with special toys, singing and gentle play.
BabyBees (6 – 14 months) will indulge your child’s natural curiosity and offer creative ways to practice emerging skills through fun-filled exploration of tunnels, slides, climbers, songs, movement activities, parachute play and more.
ToddlerBees (14 – 24 months) will use equipment and activities to learn cause and effect, coordination, balance and motor skill development. Playful movement activities and equipment exploration build pre- and early walking skills, while songs enrich emerging language.
RunningBees (24 -30 months) challenges a child’s growing body with slides, climbers, balls and tunnels. Activities also focus on language skills and social interaction.
BuzzingBees (30- 36 months) will focus on themes like “Dinosaur Day,” “Under the Sea,” and “Forest Fun” with movement stories, puppetry and songs. Physical activity will be combined with imaginative play where children will construct stories. Listening skills and body awareness grow as your child explores our playscapes, creates roles and predicts outcomes. Playfully structured movement to music provide experiences in group interaction and social development.
JumpingBees (37- 46 months) will explore pre-sports and pre-gymnastic skills including kicking, throwing and catching. Each exciting class builds listening skills and coordination while emphasizing cooperative play and encouraging new friendships.
The music program has three levels.
HummingBees (16- 24 months) will build a repertoire of songs to sing together that supports your child’s awareness of melody, pitch and rhythm. Children learn musical phrasing, rhythm and simple musical rules through playful scarf activities, baby dances and ball games. Explore safe and age appropriate instruments, enjoy soothing lullabies from around the world and immerse your baby in activities that build a solid musical foundation to grow on.
DrummingBees (25- 36 months) will use activities such as lap rides, dancing and instrument exploration to help children develop a sense of steady beat and create an atmosphere of fun. Pitch and tone are explored through songs and listening activities. Every three weeks, a new musical style is introduced, exposing your child to a variety of musical genres such as latin, rock ‘n’ roll, and classical for a musical learning adventure.

SingingBees (37 – 48 months) is designed to support and challenge emerging skills, together you’ll share a world of music. Children are encouraged to discover their singing voice and make music of their own as they explore different instruments. Self esteem and social skills get a real boost as your child engages in group songs, chants and finger plays and imagination and listening skills build as children express themselves to music.
Birthday parties at Bees’ Circus. In addition to the extensive program of classes, Bees’ Circus can host a child’s birthday party providing great activities for kids and an easy experience for parents. An enthusiastic Bees’ Circus staff member leads the activities as the birthday child and his or her friends and parents play, laugh, and sing together, creating a memorable celebration.
Market Analysis Summary
Over the past five years, there has been tremendous housing growth in the affluent northwest area of the city. To date, 3,500 new housing units have been built in the area to accommodate the growth of the city’s population. Most these units are being bought or rented by young families with young children.
Currently, there is no park program servicing the area. It is anticipated that a new park will be created for the area in the next three years to serve the estimated 10,000 families in the area.
The area also has 15 private child care centers that serve over 1,600 children, ages one to four. It is estimated that there are 5,000 children in northwest Monroe under the age of four.
Currently, there are no other activity or music programs in the area that serves the pre-schoolers.
Bees’ Circus will purse both the children at home and children at the private child care centers.
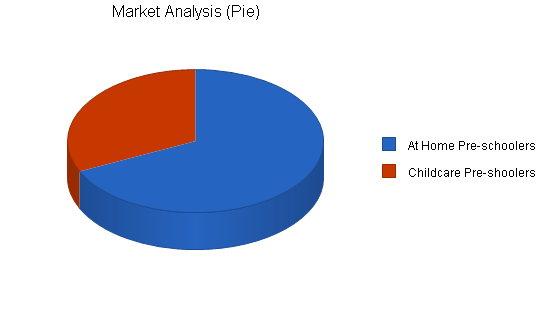
4.1 Market Segmentation
Bees’ Circus will focus on the two target groups:
- At home pre-schoolers
- Childcare pre-schoolers
| Market Analysis | |||||||
| Year 1 | Year 2 | Year 3 | Year 4 | Year 5 | |||
| Potential Customers | Growth | CAGR | |||||
| At Home Pre-schoolers | 10% | 3,400 | 3,740 | 4,114 | 4,525 | 4,978 | 10.00% |
| Childcare Pre-shoolers | 20% | 1,600 | 1,920 | 2,304 | 2,765 | 3,318 | 20.00% |
| Total | 13.49% | 5,000 | 5,660 | 6,418 | 7,290 | 8,296 | 13.49% |
Strategy and Implementation Summary
Bees’ Circus will start by sending direct mailings to parents of young children in northwest Monroe. The mailer will announce an open house invitation to visit the facility. In addition, Bees’ Circus will offer a 20% discount on its activity and music classes.
Bees’ Circus will also offer a discounted group rate (20%) to the area’s announce centers.
5.1 Sales Strategy
The sales strategy of Bees’ Circus will be to build from a base of satisfied customers. The program will offer a 20% discount on class fees for each successful referral to Bees’ Circus. We will also offer one session free visits for any parent and child interested in exploring our program.
5.1.1 Sales Forecast
Bees’ Circus anticipates that May will be weak month for classes. Enrollment will increase steadily from June on. The following is the sales forecast for Bees’ Circus.


| Sales Forecast | |||
| Year 1 | Year 2 | Year 3 | |
| Sales | |||
| Classes | $233,000 | $258,000 | $299,000 |
| Parties | $11,200 | $14,000 | $16,000 |
| Total Sales | $244,200 | $272,000 | $315,000 |
| Direct Cost of Sales | Year 1 | Year 2 | Year 3 |
| Classes | $11,500 | $9,800 | $11,300 |
| Parties | $0 | $0 | $0 |
| Subtotal Direct Cost of Sales | $11,500 | $9,800 | $11,300 |
Management Summary
Barbara Miller will be the Director of the program. She has been an educator for over 20 years and has been instrumental in the development of Monroe’s pre-school programs. Most recently, Barbara was the youth activity planner and coordinator for the city of Monroe’s park and recreation department. She managed a team of ten that organized and scheduled all youth activity classes offered by the city.
6.1 Personnel Plan
The personnel of Bees’ Circus will be as follows:
- Director
- Teacher (3)
- Class aides (4)
| Personnel Plan | |||
| Year 1 | Year 2 | Year 3 | |
| Director | $36,000 | $38,000 | $40,000 |
| Teachers | $90,000 | $96,000 | $102,000 |
| Aides | $54,000 | $57,000 | $60,000 |
| Total People | 7 | 7 | 7 |
| Total Payroll | $180,000 | $191,000 | $202,000 |
Financial Plan
The following is the financial plan for Bees’ Circus.
7.1 Break-even Analysis
The monthly break-even point is presented in the following table and chart.

| Break-even Analysis | |
| Monthly Revenue Break-even | $20,918 |
| Assumptions: | |
| Average Percent Variable Cost | 5% |
| Estimated Monthly Fixed Cost | $19,933 |
7.2 Projected Profit and Loss
The following table and chart highlight the projected profit and loss for three years.


| Pro Forma Profit and Loss | |||
| Year 1 | Year 2 | Year 3 | |
| Sales | $244,200 | $272,000 | $315,000 |
| Direct Cost of Sales | $11,500 | $9,800 | $11,300 |
| Other Production Expenses | $0 | $0 | $0 |
| Total Cost of Sales | $11,500 | $9,800 | $11,300 |
| Gross Margin | $232,700 | $262,200 | $303,700 |
| Gross Margin % | 95.29% | 96.40% | 96.41% |
| Expenses | |||
| Payroll | $180,000 | $191,000 | $202,000 |
| Sales and Marketing and Other Expenses | $2,400 | $3,000 | $3,000 |
| Depreciation | $0 | $0 | $0 |
| Leased Equipment | $0 | $0 | $0 |
| Utilities | $3,000 | $3,000 | $3,000 |
| Insurance | $4,800 | $4,800 | $4,800 |
| Rent | $22,000 | $22,000 | $22,000 |
| Payroll Taxes | $27,000 | $28,650 | $30,300 |
| Other | $0 | $0 | $0 |
| Total Operating Expenses | $239,200 | $252,450 | $265,100 |
| Profit Before Interest and Taxes | ($6,500) | $9,750 | $38,600 |
| EBITDA | ($6,500) | $9,750 | $38,600 |
| Interest Expense | $7,549 | $6,751 | $5,918 |
| Taxes Incurred | $0 | $900 | $9,805 |
| Net Profit | ($14,049) | $2,099 | $22,877 |
| Net Profit/Sales | -5.75% | 0.77% | 7.26% |
7.3 Projected Cash Flow
The following table and chart highlight the projected cash flow for three years.

| Pro Forma Cash Flow | |||
| Year 1 | Year 2 | Year 3 | |
| Cash Received | |||
| Cash from Operations | |||
| Cash Sales | $244,200 | $272,000 | $315,000 |
| Subtotal Cash from Operations | $244,200 | $272,000 | $315,000 |
| Additional Cash Received | |||
| Sales Tax, VAT, HST/GST Received | $0 | $0 | $0 |
| New Current Borrowing | $0 | $0 | $0 |
| New Other Liabilities (interest-free) | $0 | $0 | $0 |
| New Long-term Liabilities | $0 | $0 | $0 |
| Sales of Other Current Assets | $0 | $0 | $0 |
| Sales of Long-term Assets | $0 | $0 | $0 |
| New Investment Received | $0 | $0 | $0 |
| Subtotal Cash Received | $244,200 | $272,000 | $315,000 |
| Expenditures | Year 1 | Year 2 | Year 3 |
| Expenditures from Operations | |||
| Cash Spending | $180,000 | $191,000 | $202,000 |
| Bill Payments | $73,225 | $77,440 | $89,200 |
| Subtotal Spent on Operations | $253,225 | $268,440 | $291,200 |
| Additional Cash Spent | |||
| Sales Tax, VAT, HST/GST Paid Out | $0 | $0 | $0 |
| Principal Repayment of Current Borrowing | $0 | $0 | $0 |
| Other Liabilities Principal Repayment | $0 | $0 | $0 |
| Long-term Liabilities Principal Repayment | $8,328 | $8,328 | $8,328 |
| Purchase Other Current Assets | $0 | $0 | $0 |
| Purchase Long-term Assets | $0 | $0 | $0 |
| Dividends | $0 | $0 | $0 |
| Subtotal Cash Spent | $261,553 | $276,768 | $299,528 |
| Net Cash Flow | ($17,353) | ($4,768) | $15,472 |
| Cash Balance | $34,447 | $29,680 | $45,151 |
7.4 Projected Balance Sheet
The following table highlights the projected balance sheet for three years.
| Pro Forma Balance Sheet | |||
| Year 1 | Year 2 | Year 3 | |
| Assets | |||
| Current Assets | |||
| Cash | $34,447 | $29,680 | $45,151 |
| Other Current Assets | $0 | $0 | $0 |
| Total Current Assets | $34,447 | $29,680 | $45,151 |
| Long-term Assets | |||
| Long-term Assets | $30,000 | $30,000 | $30,000 |
| Accumulated Depreciation | $0 | $0 | $0 |
| Total Long-term Assets | $30,000 | $30,000 | $30,000 |
| Total Assets | $64,447 | $59,680 | $75,151 |
| Liabilities and Capital | Year 1 | Year 2 | Year 3 |
| Current Liabilities | |||
| Accounts Payable | $5,024 | $6,485 | $7,407 |
| Current Borrowing | $30,000 | $30,000 | $30,000 |
| Other Current Liabilities | $0 | $0 | $0 |
| Subtotal Current Liabilities | $35,024 | $36,485 | $37,407 |
| Long-term Liabilities | $41,672 | $33,344 | $25,016 |
| Total Liabilities | $76,696 | $69,829 | $62,423 |
| Paid-in Capital | $70,000 | $70,000 | $70,000 |
| Retained Earnings | ($68,200) | ($82,249) | ($80,149) |
| Earnings | ($14,049) | $2,099 | $22,877 |
| Total Capital | ($12,249) | ($10,149) | $12,728 |
| Total Liabilities and Capital | $64,447 | $59,680 | $75,151 |
| Net Worth | ($12,249) | ($10,149) | $12,728 |
7.5 Business Ratios
Business ratios for the years of this plan are shown below. Industry profile ratios based on the Standard Industrial Classification (SIC) code 8351, Child Day Care Services, are shown for comparison.
| Ratio Analysis | ||||
| Year 1 | Year 2 | Year 3 | Industry Profile | |
| Sales Growth | 0.00% | 11.38% | 15.81% | 9.50% |
| Percent of Total Assets | ||||
| Other Current Assets | 0.00% | 0.00% | 0.00% | 26.80% |
| Total Current Assets | 53.45% | 49.73% | 60.08% | 44.70% |
| Long-term Assets | 46.55% | 50.27% | 39.92% | 55.30% |
| Total Assets | 100.00% | 100.00% | 100.00% | 100.00% |
| Current Liabilities | 54.35% | 61.13% | 49.78% | 31.80% |
| Long-term Liabilities | 64.66% | 55.87% | 33.29% | 31.00% |
| Total Liabilities | 119.01% | 117.01% | 83.06% | 62.80% |
| Net Worth | -19.01% | -17.01% | 16.94% | 37.20% |
| Percent of Sales | ||||
| Sales | 100.00% | 100.00% | 100.00% | 100.00% |
| Gross Margin | 95.29% | 96.40% | 96.41% | 0.00% |
| Selling, General & Administrative Expenses | 101.04% | 95.63% | 89.15% | 75.60% |
| Advertising Expenses | 0.98% | 1.10% | 0.95% | 0.70% |
| Profit Before Interest and Taxes | -2.66% | 3.58% | 12.25% | 2.60% |
| Main Ratios | ||||
| Current | 0.98 | 0.81 | 1.21 | 1.27 |
| Quick | 0.98 | 0.81 | 1.21 | 1.14 |
| Total Debt to Total Assets | 119.01% | 117.01% | 83.06% | 62.80% |
| Pre-tax Return on Net Worth | 114.70% | -29.55% | 256.77% | 5.40% |
| Pre-tax Return on Assets | -21.80% | 5.03% | 43.49% | 14.60% |
| Additional Ratios | Year 1 | Year 2 | Year 3 | |
| Net Profit Margin | -5.75% | 0.77% | 7.26% | n.a |
| Return on Equity | 0.00% | 0.00% | 179.74% | n.a |
| Activity Ratios | ||||
| Accounts Payable Turnover | 15.57 | 12.17 | 12.17 | n.a |
| Payment Days | 27 | 27 | 28 | n.a |
| Total Asset Turnover | 3.79 | 4.56 | 4.19 | n.a |
| Debt Ratios | ||||
| Debt to Net Worth | 0.00 | 0.00 | 4.90 | n.a |
| Current Liab. to Liab. | 0.46 | 0.52 | 0.60 | n.a |
| Liquidity Ratios | ||||
| Net Working Capital | ($577) | ($6,805) | $7,744 | n.a |
| Interest Coverage | -0.86 | 1.44 | 6.52 | n.a |
| Additional Ratios | ||||
| Assets to Sales | 0.26 | 0.22 | 0.24 | n.a |
| Current Debt/Total Assets | 54% | 61% | 50% | n.a |
| Acid Test | 0.98 | 0.81 | 1.21 | n.a |
| Sales/Net Worth | 0.00 | 0.00 | 24.75 | n.a |
| Dividend Payout | 0.00 | 0.00 | 0.00 | n.a |
Appendix
| Sales Forecast | |||||||||||||
| Month 1 | Month 2 | Month 3 | Month 4 | Month 5 | Month 6 | Month 7 | Month 8 | Month 9 | Month 10 | Month 11 | Month 12 | ||
| Sales | |||||||||||||
| Classes | 0% | $4,000 | $8,000 | $13,000 | $15,000 | $17,000 | $20,000 | $23,000 | $23,000 | $25,000 | $25,000 | $30,000 | $30,000 |
| Parties | 0% | $400 | $800 | $1,000 | $1,000 | $1,000 | $1,000 | $1,000 | $1,000 | $1,000 | $1,000 | $1,000 | $1,000 |
| Total Sales | $4,400 | $8,800 | $14,000 | $16,000 | $18,000 | $21,000 | $24,000 | $24,000 | $26,000 | $26,000 | $31,000 | $31,000 | |
| Direct Cost of Sales | Month 1 | Month 2 | Month 3 | Month 4 | Month 5 | Month 6 | Month 7 | Month 8 | Month 9 | Month 10 | Month 11 | Month 12 | |
| Classes | $200 | $400 | $600 | $700 | $800 | $1,000 | $1,150 | $1,150 | $1,250 | $1,250 | $1,500 | $1,500 | |
| Parties | $0 | $0 | $0 | $0 | $0 | $0 | $0 | $0 | $0 | $0 | $0 | $0 | |
| Subtotal Direct Cost of Sales | $200 | $400 | $600 | $700 | $800 | $1,000 | $1,150 | $1,150 | $1,250 | $1,250 | $1,500 | $1,500 | |
| Personnel Plan | |||||||||||||
| Month 1 | Month 2 | Month 3 | Month 4 | Month 5 | Month 6 | Month 7 | Month 8 | Month 9 | Month 10 | Month 11 | Month 12 | ||
| Director | 0% | $3,000 | $3,000 | $3,000 | $3,000 | $3,000 | $3,000 | $3,000 | $3,000 | $3,000 | $3,000 | $3,000 | $3,000 |
| Teachers | 0% | $7,500 | $7,500 | $7,500 | $7,500 | $7,500 | $7,500 | $7,500 | $7,500 | $7,500 | $7,500 | $7,500 | $7,500 |
| Aides | 0% | $4,500 | $4,500 | $4,500 | $4,500 | $4,500 | $4,500 | $4,500 | $4,500 | $4,500 | $4,500 | $4,500 | $4,500 |
| Total People | 7 | 7 | 7 | 7 | 7 | 7 | 7 | 7 | 7 | 7 | 7 | 7 | |
| Total Payroll | $15,000 | $15,000 | $15,000 | $15,000 | $15,000 | $15,000 | $15,000 | $15,000 | $15,000 | $15,000 | $15,000 | $15,000 | |
| General Assumptions | |||||||||||||
| Month 1 | Month 2 | Month 3 | Month 4 | Month 5 | Month 6 | Month 7 | Month 8 | Month 9 | Month 10 | Month 11 | Month 12 | ||
| Plan Month | 1 | 2 | 3 | 4 | 5 | 6 | 7 | 8 | 9 | 10 | 11 | 12 | |
| Current Interest Rate | 10.00% | 10.00% | 10.00% | 10.00% | 10.00% | 10.00% | 10.00% | 10.00% | 10.00% | 10.00% | 10.00% | 10.00% | |
| Long-term Interest Rate | 10.00% | 10.00% | 10.00% | 10.00% | 10.00% | 10.00% | 10.00% | 10.00% | 10.00% | 10.00% | 10.00% | 10.00% | |
| Tax Rate | 30.00% | 30.00% | 30.00% | 30.00% | 30.00% | 30.00% | 30.00% | 30.00% | 30.00% | 30.00% | 30.00% | 30.00% | |
| Other | 0 | 0 | 0 | 0 | 0 | 0 | 0 | 0 | 0 | 0 | 0 | 0 | |
| Pro Forma Profit and Loss | |||||||||||||
| Month 1 | Month 2 | Month 3 | Month 4 | Month 5 | Month 6 | Month 7 | Month 8 | Month 9 | Month 10 | Month 11 | Month 12 | ||
| Sales | $4,400 | $8,800 | $14,000 | $16,000 | $18,000 | $21,000 | $24,000 | $24,000 | $26,000 | $26,000 | $31,000 | $31,000 | |
| Direct Cost of Sales | $200 | $400 | $600 | $700 | $800 | $1,000 | $1,150 | $1,150 | $1,250 | $1,250 | $1,500 | $1,500 | |
| Other Production Expenses | $0 | $0 | $0 | $0 | $0 | $0 | $0 | $0 | $0 | $0 | $0 | $0 | |
| Total Cost of Sales | $200 | $400 | $600 | $700 | $800 | $1,000 | $1,150 | $1,150 | $1,250 | $1,250 | $1,500 | $1,500 | |
| Gross Margin | $4,200 | $8,400 | $13,400 | $15,300 | $17,200 | $20,000 | $22,850 | $22,850 | $24,750 | $24,750 | $29,500 | $29,500 | |
| Gross Margin % | 95.45% | 95.45% | 95.71% | 95.63% | 95.56% | 95.24% | 95.21% | 95.21% | 95.19% | 95.19% | 95.16% | 95.16% | |
| Expenses | |||||||||||||
| Payroll | $15,000 | $15,000 | $15,000 | $15,000 | $15,000 | $15,000 | $15,000 | $15,000 | $15,000 | $15,000 | $15,000 | $15,000 | |
| Sales and Marketing and Other Expenses | $200 | $200 | $200 | $200 | $200 | $200 | $200 | $200 | $200 | $200 | $200 | $200 | |
| Depreciation | $0 | $0 | $0 | $0 | $0 | $0 | $0 | $0 | $0 | $0 | $0 | $0 | |
| Leased Equipment | $0 | $0 | $0 | $0 | $0 | $0 | $0 | $0 | $0 | $0 | $0 | $0 | |
| Utilities | $250 | $250 | $250 | $250 | $250 | $250 | $250 | $250 | $250 | $250 | $250 | $250 | |
| Insurance | $400 | $400 | $400 | $400 | $400 | $400 | $400 | $400 | $400 | $400 | $400 | $400 | |
| Rent | $2,000 | $2,000 | $2,000 | $2,000 | $2,000 | $2,000 | $2,000 | $2,000 | $2,000 | $2,000 | $2,000 | $0 | |
| Payroll Taxes | 15% | $2,250 | $2,250 | $2,250 | $2,250 | $2,250 | $2,250 | $2,250 | $2,250 | $2,250 | $2,250 | $2,250 | $2,250 |
| Other | $0 | $0 | $0 | $0 | $0 | $0 | $0 | $0 | $0 | $0 | $0 | $0 | |
| Total Operating Expenses | $20,100 | $20,100 | $20,100 | $20,100 | $20,100 | $20,100 | $20,100 | $20,100 | $20,100 | $20,100 | $20,100 | $18,100 | |
| Profit Before Interest and Taxes | ($15,900) | ($11,700) | ($6,700) | ($4,800) | ($2,900) | ($100) | $2,750 | $2,750 | $4,650 | $4,650 | $9,400 | $11,400 | |
| EBITDA | ($15,900) | ($11,700) | ($6,700) | ($4,800) | ($2,900) | ($100) | $2,750 | $2,750 | $4,650 | $4,650 | $9,400 | $11,400 | |
| Interest Expense | $661 | $655 | $649 | $644 | $638 | $632 | $626 | $620 | $615 | $609 | $603 | $597 | |
| Taxes Incurred | $0 | $0 | $0 | $0 | $0 | $0 | $0 | $0 | $0 | $0 | $0 | $0 | |
| Net Profit | ($16,561) | ($12,355) | ($7,349) | ($5,444) | ($3,538) | ($732) | $2,124 | $2,130 | $4,035 | $4,041 | $8,797 | $10,803 | |
| Net Profit/Sales | -376.38% | -140.40% | -52.50% | -34.02% | -19.65% | -3.49% | 8.85% | 8.87% | 15.52% | 15.54% | 28.38% | 34.85% | |
| Pro Forma Cash Flow | |||||||||||||
| Month 1 | Month 2 | Month 3 | Month 4 | Month 5 | Month 6 | Month 7 | Month 8 | Month 9 | Month 10 | Month 11 | Month 12 | ||
| Cash Received | |||||||||||||
| Cash from Operations | |||||||||||||
| Cash Sales | $4,400 | $8,800 | $14,000 | $16,000 | $18,000 | $21,000 | $24,000 | $24,000 | $26,000 | $26,000 | $31,000 | $31,000 | |
| Subtotal Cash from Operations | $4,400 | $8,800 | $14,000 | $16,000 | $18,000 | $21,000 | $24,000 | $24,000 | $26,000 | $26,000 | $31,000 | $31,000 | |
| Additional Cash Received | |||||||||||||
| Sales Tax, VAT, HST/GST Received | 0.00% | $0 | $0 | $0 | $0 | $0 | $0 | $0 | $0 | $0 | $0 | $0 | $0 |
| New Current Borrowing | $0 | $0 | $0 | $0 | $0 | $0 | $0 | $0 | $0 | $0 | $0 | $0 | |
| New Other Liabilities (interest-free) | $0 | $0 | $0 | $0 | $0 | $0 | $0 | $0 | $0 | $0 | $0 | $0 | |
| New Long-term Liabilities | $0 | $0 | $0 | $0 | $0 | $0 | $0 | $0 | $0 | $0 | $0 | $0 | |
| Sales of Other Current Assets | $0 | $0 | $0 | $0 | $0 | $0 | $0 | $0 | $0 | $0 | $0 | $0 | |
| Sales of Long-term Assets | $0 | $0 | $0 | $0 | $0 | $0 | $0 | $0 | $0 | $0 | $0 | $0 | |
| New Investment Received | $0 | $0 | $0 | $0 | $0 | $0 | $0 | $0 | $0 | $0 | $0 | $0 | |
| Subtotal Cash Received | $4,400 | $8,800 | $14,000 | $16,000 | $18,000 | $21,000 | $24,000 | $24,000 | $26,000 | $26,000 | $31,000 | $31,000 | |
| Expenditures | Month 1 | Month 2 | Month 3 | Month 4 | Month 5 | Month 6 | Month 7 | Month 8 | Month 9 | Month 10 | Month 11 | Month 12 | |
| Expenditures from Operations | |||||||||||||
| Cash Spending | $15,000 | $15,000 | $15,000 | $15,000 | $15,000 | $15,000 | $15,000 | $15,000 | $15,000 | $15,000 | $15,000 | $15,000 | |
| Bill Payments | $199 | $5,967 | $6,162 | $6,352 | $6,447 | $6,544 | $6,737 | $6,876 | $6,874 | $6,964 | $6,967 | $7,136 | |
| Subtotal Spent on Operations | $15,199 | $20,967 | $21,162 | $21,352 | $21,447 | $21,544 | $21,737 | $21,876 | $21,874 | $21,964 | $21,967 | $22,136 | |
| Additional Cash Spent | |||||||||||||
| Sales Tax, VAT, HST/GST Paid Out | $0 | $0 | $0 | $0 | $0 | $0 | $0 | $0 | $0 | $0 | $0 | $0 | |
| Principal Repayment of Current Borrowing | $0 | $0 | $0 | $0 | $0 | $0 | $0 | $0 | $0 | $0 | $0 | $0 | |
| Other Liabilities Principal Repayment | $0 | $0 | $0 | $0 | $0 | $0 | $0 | $0 | $0 | $0 | $0 | $0 | |
| Long-term Liabilities Principal Repayment | $694 | $694 | $694 | $694 | $694 | $694 | $694 | $694 | $694 | $694 | $694 | $694 | |
| Purchase Other Current Assets | $0 | $0 | $0 | $0 | $0 | $0 | $0 | $0 | $0 | $0 | $0 | $0 | |
| Purchase Long-term Assets | $0 | $0 | $0 | $0 | $0 | $0 | $0 | $0 | $0 | $0 | $0 | $0 | |
| Dividends | $0 | $0 | $0 | $0 | $0 | $0 | $0 | $0 | $0 | $0 | $0 | $0 | |
| Subtotal Cash Spent | $15,893 | $21,661 | $21,856 | $22,046 | $22,141 | $22,238 | $22,431 | $22,570 | $22,568 | $22,658 | $22,661 | $22,830 | |
| Net Cash Flow | ($11,493) | ($12,861) | ($7,856) | ($6,046) | ($4,141) | ($1,238) | $1,569 | $1,430 | $3,432 | $3,342 | $8,339 | $8,170 | |
| Cash Balance | $40,307 | $27,446 | $19,590 | $13,544 | $9,403 | $8,165 | $9,734 | $11,164 | $14,597 | $17,938 | $26,277 | $34,447 | |
| Pro Forma Balance Sheet | |||||||||||||
| Month 1 | Month 2 | Month 3 | Month 4 | Month 5 | Month 6 | Month 7 | Month 8 | Month 9 | Month 10 | Month 11 | Month 12 | ||
| Assets | Starting Balances | ||||||||||||
| Current Assets | |||||||||||||
| Cash | $51,800 | $40,307 | $27,446 | $19,590 | $13,544 | $9,403 | $8,165 | $9,734 | $11,164 | $14,597 | $17,938 | $26,277 | $34,447 |
| Other Current Assets | $0 | $0 | $0 | $0 | $0 | $0 | $0 | $0 | $0 | $0 | $0 | $0 | $0 |
| Total Current Assets | $51,800 | $40,307 | $27,446 | $19,590 | $13,544 | $9,403 | $8,165 | $9,734 | $11,164 | $14,597 | $17,938 | $26,277 | $34,447 |
| Long-term Assets | |||||||||||||
| Long-term Assets | $30,000 | $30,000 | $30,000 | $30,000 | $30,000 | $30,000 | $30,000 | $30,000 | $30,000 | $30,000 | $30,000 | $30,000 | $30,000 |
| Accumulated Depreciation | $0 | $0 | $0 | $0 | $0 | $0 | $0 | $0 | $0 | $0 | $0 | $0 | $0 |
| Total Long-term Assets | $30,000 | $30,000 | $30,000 | $30,000 | $30,000 | $30,000 | $30,000 | $30,000 | $30,000 | $30,000 | $30,000 | $30,000 | $30,000 |
| Total Assets | $81,800 | $70,307 | $57,446 | $49,590 | $43,544 | $39,403 | $38,165 | $39,734 | $41,164 | $44,597 | $47,938 | $56,277 | $64,447 |
| Liabilities and Capital | Month 1 | Month 2 | Month 3 | Month 4 | Month 5 | Month 6 | Month 7 | Month 8 | Month 9 | Month 10 | Month 11 | Month 12 | |
| Current Liabilities | |||||||||||||
| Accounts Payable | $0 | $5,762 | $5,950 | $6,138 | $6,229 | $6,320 | $6,508 | $6,647 | $6,641 | $6,732 | $6,727 | $6,963 | $5,024 |
| Current Borrowing | $30,000 | $30,000 | $30,000 | $30,000 | $30,000 | $30,000 | $30,000 | $30,000 | $30,000 | $30,000 | $30,000 | $30,000 | $30,000 |
| Other Current Liabilities | $0 | $0 | $0 | $0 | $0 | $0 | $0 | $0 | $0 | $0 | $0 | $0 | $0 |
| Subtotal Current Liabilities | $30,000 | $35,762 | $35,950 | $36,138 | $36,229 | $36,320 | $36,508 | $36,647 | $36,641 | $36,732 | $36,727 | $36,963 | $35,024 |
| Long-term Liabilities | $50,000 | $49,306 | $48,612 | $47,918 | $47,224 | $46,530 | $45,836 | $45,142 | $44,448 | $43,754 | $43,060 | $42,366 | $41,672 |
| Total Liabilities | $80,000 | $85,068 | $84,562 | $84,056 | $83,453 | $82,850 | $82,344 | $81,789 | $81,089 | $80,486 | $79,787 | $79,329 | $76,696 |
| Paid-in Capital | $70,000 | $70,000 | $70,000 | $70,000 | $70,000 | $70,000 | $70,000 | $70,000 | $70,000 | $70,000 | $70,000 | $70,000 | $70,000 |
| Retained Earnings | ($68,200) | ($68,200) | ($68,200) | ($68,200) | ($68,200) | ($68,200) | ($68,200) | ($68,200) | ($68,200) | ($68,200) | ($68,200) | ($68,200) | ($68,200) |
| Earnings | $0 | ($16,561) | ($28,916) | ($36,265) | ($41,709) | ($45,247) | ($45,979) | ($43,855) | ($41,725) | ($37,690) | ($33,649) | ($24,852) | ($14,049) |
| Total Capital | $1,800 | ($14,761) | ($27,116) | ($34,465) | ($39,909) | ($43,447) | ($44,179) | ($42,055) | ($39,925) | ($35,890) | ($31,849) | ($23,052) | ($12,249) |
| Total Liabilities and Capital | $81,800 | $70,307 | $57,446 | $49,590 | $43,544 | $39,403 | $38,165 | $39,734 | $41,164 | $44,597 | $47,938 | $56,277 | $64,447 |
| Net Worth | $1,800 | ($14,761) | ($27,116) | ($34,465) | ($39,909) | ($43,447) | ($44,179) | ($42,055) | ($39,925) | ($35,890) | ($31,849) | ($23,052) | ($12,249) |

