
ToyLearn
Executive Summary
ToyLearn is an exciting start-up company that has developed a line of educational tools for children that are fun and engaging. The company has been founded by the husband and wife team of David and Jen Funster and is registered as an Ohio S-Corp. ToyLearn will be profitable by the end of year one and will have a steep increase in sales for the first several years.
ToyLearn is initially offering three different educational toys. The first is NumberToy, a fun toy that teaches children number skills. The second product is LetterToy which as the name hints, helps children quickly conquer the alphabet. The third product is PhonicToy, a device that resembles a mini PC and teaches phonic and math skills. While all the products are educational tools that develop core skills within the youngster users, they are fun to play with, thereby encouraging tots to use them often. New products are currently in development by the in-house department.
ToyLearn has identified three keys to success that are instrumental in the sustainability of the business. Number one is the need to develop creative, educational, engaging toys. The second key is to adopt strict financial controls. The last last key to success is the need to listen to customer, effectively creating a feedback mechanism for product improvement.
ToyLearn has identified two customer segments that it will go after. The first group is individual customers. These are parents or grandparents who are purchasing the product for their child. The segment is growing at 8% per year and currently has 3,354,430 perspective customers. The second market segment that will be addressed is wholesale purchasers, typically organizations that are purchasing the products for their clients to use. These organizations are typically some sort of care center or nursery/pre school. The segment is growing annually at 10% with 702,335 possible customers.
The likelihood of success of ToyLearn is ensured by its strong management team, lead by David and Jen Funster. David, in charge of the product engineering, graduated from the University of Rochester with an Engineering Degree. After school David went to work for HP in their product development department for a number of years. After HP, David moved to Nintendo working in game development. These experiences, in addition to his education has provided David with valuable skills to use to help ToyLearn gain market penetration based on the quality of its products. Jen, the other half of the management team, received her Masters of Education from Case Western Reserve University. Jen brings extensive experience in educational tool development to ToyLearn.
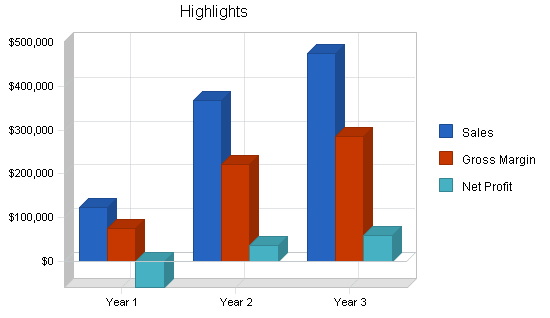
ToyLearn has conservatively forecasted sales of $367,000 in year two. The yearly sales will rise to $475,000 in year three. ToyLearn is destined to succeed due to a combination of seasoned management, excellent product development, and the insight to recognize a wonderful market opportunity.
1.1 Objectives
- Create a profitable company.
- Develop innovative, educational toys.
- Improve the learning curve for children through the use of interactive toys.
1.2 Mission
It is ToyLearn’s mission to make the highest quality educational toys available. The more children that learn basic functions from our toys, the more successful we are.
1.3 Keys to Success
- Develop creative, educational, engaging toys.
- Adopt strict financial controls.
- Listen carefully to the customers.
Company Summary
ToyLearn is a start-up company that has developed three types of educational toys. The products are called toys because they are fun and engaging to use. They are educational because they teach constructive skills to the users. ToyLearn will initially distribute the products within the USA, with future global distribution being considered.
2.1 Company Ownership
ToyLearn is a privately held Ohio S-Corp, the principal shareholders are Jen and David Funster.
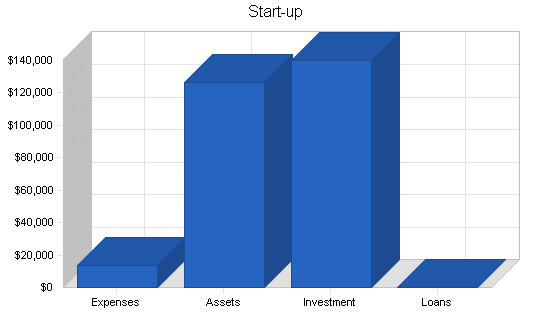
2.2 Start-up Summary
The following items will be needed for the start-up of the business:
- Office supplies and equipment for three employees including desks, computers, cubicle dividers.
- Assorted equipment for prototyping such as electric circuit boards, molded plastics, speakers, and L.E.D. lights.
- Fax machine, telephones, printers.
| Start-up | |
| Requirements | |
| Start-up Expenses | |
| Legal | $4,000 |
| Stationery etc. | $200 |
| Brochures | $200 |
| Consultants | $3,000 |
| Insurance | $400 |
| Rent | $600 |
| Research and Development | $5,000 |
| Total Start-up Expenses | $13,400 |
| Start-up Assets | |
| Cash Required | $116,600 |
| Other Current Assets | $0 |
| Long-term Assets | $10,000 |
| Total Assets | $126,600 |
| Total Requirements | $140,000 |
| Start-up Funding | |
| Start-up Expenses to Fund | $13,400 |
| Start-up Assets to Fund | $126,600 |
| Total Funding Required | $140,000 |
| Assets | |
| Non-cash Assets from Start-up | $10,000 |
| Cash Requirements from Start-up | $116,600 |
| Additional Cash Raised | $0 |
| Cash Balance on Starting Date | $116,600 |
| Total Assets | $126,600 |
| Liabilities and Capital | |
| Liabilities | |
| Current Borrowing | $0 |
| Long-term Liabilities | $0 |
| Accounts Payable (Outstanding Bills) | $0 |
| Other Current Liabilities (interest-free) | $0 |
| Total Liabilities | $0 |
| Capital | |
| Planned Investment | |
| Jen and David | $40,000 |
| Investor 2 | $100,000 |
| Additional Investment Requirement | $0 |
| Total Planned Investment | $140,000 |
| Loss at Start-up (Start-up Expenses) | ($13,400) |
| Total Capital | $126,600 |
| Total Capital and Liabilities | $126,600 |
| Total Funding | $140,000 |
Products
ToyLearn has developed three distinct functional and educational toys that are fun to play with, but at the same time are useful in teaching children needed skills. Although the toys are in prototype form at this point, they are functionally complete and are near their finished form.
- NumberToy: a toy that emits lights and sounds when the children touch a stylus at the appropriate numbers. In addition to teaching children number skills, it also helps them with hand eye coordination. When children have used NumberToy in usability tests, not only do they learn numbers, but they squeal with delight as they are using the product.
- LetterToy: this product is similar to NumberToy but it teaches children the alphabet. LetterToy is also successful improving children’s attention span.
- PhonicToy: a toy that looks similar to a miniature PC laptop. Inside the unit there is a child’s book and stylus. Use the stylus to touch the page and the device reads stories out loud, identifies the sounds of musical instruments, and guides the kids along on basic addition.
This is the product line currently developed, however, it is expected to grow over time as new ideas are generated. While prototypes will be designed and manufactured in house, production will be outsourced.
Market Analysis Summary
The market for educational toys can be divided into two distinct segments:
- Individual consumers: this group is parents or grandparents who are purchasing the toy for a specific child.
- Wholesale purchasers: this segment is schools, daycare centers, etc., commercial businesses that are buying the product for their clients to use.
ToyLearn has decided to sell direct to the consumer instead of using the traditional layered distribution system that uses wholesalers to sell to retailers. While this creates more work for ToyLearn in terms of generating sales, it provides better margins. Additionally, this process will be more costly for the first few years, however, once relationships are developed with individual consumers as well as the wholesale purchasers, the marketing cost per sale will dramatically decrease as the original customers become familiar with ToyLearn’s outstanding product line and continue to make purchases.
4.1 Market Segmentation
As mentioned in the previous section ToyLearn has segmented the market into two distinct customers, individuals and businesses.
- Individuals: this segment is people buying a single product for their child or someone that they know. The demographics for this segment is a household income of >$50,000, have high aspirations for their children in terms of education and development and want to get started as soon as possible. Generally they have at least an undergraduate degree with 41% of the segment having a graduate degree.
- Businesses: this group is buying the toys for children who are the business’ clients. These organizations typically are either day care based, or school based such as nursery school or pre school. The number of children that they care for generally ranges from seven to 25.


| Market Analysis | |||||||
| Year 1 | Year 2 | Year 3 | Year 4 | Year 5 | |||
| Potential Customers | Growth | CAGR | |||||
| Individuals | 8% | 3,354,430 | 3,622,784 | 3,912,607 | 4,225,616 | 4,563,665 | 8.00% |
| Wholesale | 10% | 102,335 | 112,569 | 123,826 | 136,209 | 149,830 | 10.00% |
| Total | 8.06% | 3,456,765 | 3,735,353 | 4,036,433 | 4,361,825 | 4,713,495 | 8.06% |
4.2 Target Market Segment Strategy
ToyLearn will focus on individual consumers and wholesale customers for several good reasons:
- Better margins. Although sales volume will be less relative to using wholesale distributors, margins will be higher.
- Closer contact with customers. By selling direct to consumers, a stronger relationship will be developed. This is advantageous because it provides a more accurate feedback loop which is instrumental in product development.
- More efficient. Fewer layers involved in distribution.
4.3 Industry Analysis
The toy industry is characterized by many different toy manufacturers. Within the larger toy industry, there is a niche of educational toy manufacturers. This niche is fairly new (within the last five years) as the convergence of toys and educational tools becomes more legitimized. For years there was no awareness that a toy could have educational value, it was assumed that a toy was a mindless way of occupying a child’s time and attention, giving the parent a break. Only recently has there been studies published that clearly show the ability to design a toy that captivates a child’s attention while teaching them constructive skills.
4.3.1 Competition and Buying Patterns
The small niche educational toy industry is comprised of two market leaders and several smaller, primarily regional manufacturers. The two main competitors are:
- LeapFrog Enterprises. An Emeryville, CA company. They currently have one main product line that teaches phonic.
- Knowledge Universe. This company was founded by financier Michael Milken and Oracle President Lawrence J. Ellison. Knowledge Universe has a total of seven different products.
In addition, ToyLearn competes with products produced by large game manufacturers.
Strategy and Implementation Summary
ToyLearn will leverage its two competitive edges (educational and engineering expertise) to produce educational toys that are fun to use and at the same time successful at building important skills for youngsters. By recognizing and exploiting its core competencies, ToyLearn will quickly gain market share as well as develop a reputation for making effective teaching toys.
5.1 Competitive Edge
ToyLearn has two competitive edges which are based on their core competencies, education and engineering. Please refer to the Management summary for more detail, but basically ToyLearn will be leveraging what they do best to create a product that is in demand by the market.
5.2 Marketing Strategy
The marketing strategy will emphasize the fact that ToyLearn’s products are truly educational devices that are fun. This is an important message because parents will want their children to play with this type of toy. The element of “toy” in the product is used to keep the children engaged in the product, something often difficult to do with most educational devices.
The marketing strategy will recognize and account for the fact that there are two distinct customer groups that must be attracted. To capture the awareness of both groups, ToyLearn recognizes that the groups are very different regardless that they are buying the same product.
ToyLearn will use advertisements and direct mailings. The advertisements will be placed in magazines or journals chosen specifically recognizing who the target audience is. Magazines will be used for the individuals market and a combination of magazines and journals will be used for the businesses segment.
5.3 Sales Strategy
The sales strategy will be tailored for each customer group. The sales strategy for individuals is to create enough awareness of ToyLearn so that customers are asking their retailers to carry ToyLearn for them. To address the business segment, it is ToyLearn’s goal that the businesses are not just buying one or two of the products but that they are buying all of them addressing different skills, all of which are important. This is especially important as businesses are generally repeat customers, meaning that if the customer is happy with the product, it is more than likely that they will become a long-term customer and not look for new vendors.
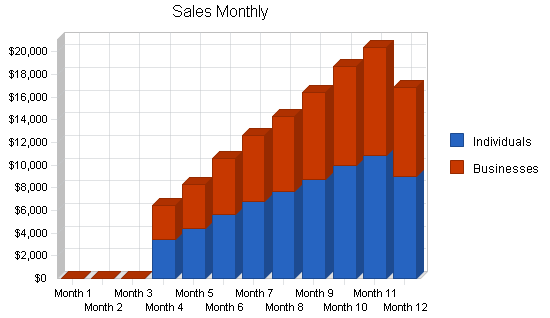
5.3.1 Sales Forecast
The first three months will not see any sales as the organization will be ramping up production and establishing sales channels. The first year is forecasted to have a fairly slow sales forecast because of the fact that ToyLearn is a start-up organization. Growth for year two and year three should be fairly steep. After year four it is forecasted that growth will continue, but at a more sustainable rate than during the second and third year.
| Sales Forecast | |||
| Year 1 | Year 2 | Year 3 | |
| Sales | |||
| Individuals | $66,580 | $196,554 | $254,332 |
| Businesses | $57,925 | $171,002 | $221,269 |
| Total Sales | $124,505 | $367,556 | $475,601 |
| Direct Cost of Sales | Year 1 | Year 2 | Year 3 |
| Individuals | $26,632 | $78,622 | $101,733 |
| Businesses | $23,170 | $68,401 | $88,508 |
| Subtotal Direct Cost of Sales | $49,802 | $147,022 | $190,240 |
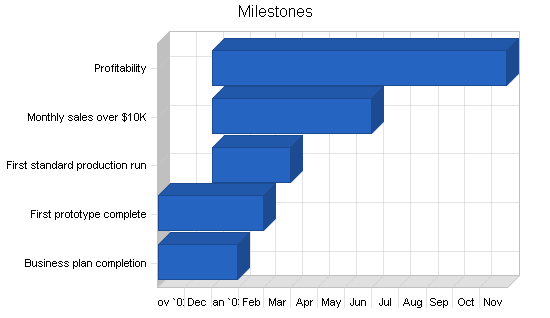
5.4 Milestones
- Business plan completion;
- First prototype complete;
- First standard production run;
- Monthly sales over $10,000;
- Profitability.
| Milestones | |||||
| Milestone | Start Date | End Date | Budget | Manager | Department |
| Business plan completion | 11/1/2002 | 1/30/2003 | $0 | Jen & David | Management |
| First prototype complete | 11/1/2002 | 2/28/2003 | $0 | David | Engineering |
| First standard production run | 1/1/2003 | 3/30/2003 | $0 | David | Engineering |
| Monthly sales over $10K | 1/1/2003 | 6/30/2003 | $0 | Jen | Marketing |
| Profitability | 1/1/2003 | 11/30/2003 | $0 | Jen & David | Management |
| Totals | $0 | ||||
5.5 Operations Strategy
ToyLearn will outsource the manufacture of all of its products. Jen and David opted for an outsourcing model for a number of reasons.
- Neither of them have a manufacturing operations/supply chain experience.
- Outsourcing will keep overhead costs to a minimum, making all production costs variable.
- Outsourcing will allow the management team to focus on marketing and new product development.
- Reducing the financial risks by not committing to the expense of a manufacturing facility.
- Increasing the scalability of the business model.
Web Plan Summary
ToyLearn’s website will be used as the key marketing tool to distribute the products. It will be an inexpensive and effective method of distributing information regarding ToyLearn and its products. The site will have two areas, one for general information, a second for retailers/distributors. The second area will have more information beyond marketing information such as inventory, etc.
6.1 Website Marketing Strategy
The website marketing strategy is simple and straightforward. Include the URL on all printed material as well as reference it in communications with customers. In order for as many people as possible to find it, ToyLearn will submit the site to a wide range of search engines so even if a perspective customer is not aware of ToyLearn but knows about the product category, they will still be directed to ToyLearn’s site.
6.2 Development Requirements
The site will be developed by programmers found by leveraging personal contacts of David’s. It is expected that once the architecture of the site is developed it will take no longer than one month to build and test. The site will be monitored on an ongoing basis in terms of traffic, sales and usage patterns. The programmer will be kept on a retainer basis and the site will be appended as necessary.
Management Summary
ToyLearn has been founded and will be run by the husband and wife team of David and Jen Funster, each bringing specific and valuable skills to the venture.
- David: received his Engineering Degree from the University of Rochester. Upon graduation David went to work at HP where he worked on product development. While this work was enjoyable, he longed for more autonomy and began looking for a new position. David found what he thought was the perfect opportunity at Nintendo dealing with handheld game development. David spent four years at Nintendo becoming quite proficient at game development. At the end of his third year he began having serious conversations with his wife Jen about starting their own company. David spent one more year at Nintendo, saving up money for the newly anticipated venture.
- Jen: received her Bachelor of Arts and her Masters of Education from Case Western Reserve. Following her Master’s Jen went to work for the Montessori Institute. At the institute, Jen developed educational tools for two to six year old children. While this was a rewarding experience, there was a decent amount of bureaucracy which prevented Jen from working on projects that she thought were of greatest importance.
At some point Jen began to chat with David and they had the epiphany that between the two of them they had the skills to develop learning toys. They welcomed the chance to work for themselves and began to work on their first product. Jen was able to provide incredible insight as to the design of a product that incorporated the fun aspect of a toy with the teaching capacity of a educational tool. David immeasurable contributions was the schematic development and one-off manufacture of the prototypes.
7.1 Personnel Plan
- Jen: marketing, product development and operations.
- David: product development and engineering.
- Sales
- Customer service: this position will also help out with bookkeeping functions.
| Personnel Plan | |||
| Year 1 | Year 2 | Year 3 | |
| Jen | $24,000 | $30,000 | $40,000 |
| David | $24,000 | $30,000 | $40,000 |
| Sales | $25,000 | $34,000 | $38,000 |
| Customer Service | $25,000 | $34,000 | $38,000 |
| Total People | 4 | 4 | 0 |
| Total Payroll | $98,000 | $128,000 | $156,000 |
Financial Plan
The following sections will outline important financial information.
8.1 Important Assumptions
The following table details important financial assumptions.
| General Assumptions | |||
| Year 1 | Year 2 | Year 3 | |
| Plan Month | 1 | 2 | 3 |
| Current Interest Rate | 10.00% | 10.00% | 10.00% |
| Long-term Interest Rate | 10.00% | 10.00% | 10.00% |
| Tax Rate | 30.00% | 30.00% | 30.00% |
| Other | 0 | 0 | 0 |
8.2 Break-even Analysis
The Break-even Analysis indicates that $30,290 will be needed in monthly revenue to reach the break-even point.

| Break-even Analysis | |
| Monthly Revenue Break-even | $18,596 |
| Assumptions: | |
| Average Percent Variable Cost | 40% |
| Estimated Monthly Fixed Cost | $11,158 |
8.3 Projected Profit and Loss
The following table and charts will indicate Projected Profit and Loss.


| Pro Forma Profit and Loss | |||
| Year 1 | Year 2 | Year 3 | |
| Sales | $124,505 | $367,556 | $475,601 |
| Direct Cost of Sales | $49,802 | $147,022 | $190,240 |
| Other Costs of Goods | $0 | $0 | $0 |
| Total Cost of Sales | $49,802 | $147,022 | $190,240 |
| Gross Margin | $74,703 | $220,534 | $285,361 |
| Gross Margin % | 60.00% | 60.00% | 60.00% |
| Expenses | |||
| Payroll | $98,000 | $128,000 | $156,000 |
| Sales and Marketing and Other Expenses | $4,200 | $4,200 | $4,200 |
| Depreciation | $1,992 | $1,992 | $1,992 |
| Rent | $7,200 | $7,200 | $7,200 |
| Utilities | $3,600 | $3,600 | $3,600 |
| Insurance | $3,000 | $3,000 | $3,000 |
| Payroll Taxes | $14,700 | $19,200 | $23,400 |
| Other | $1,200 | $1,200 | $1,200 |
| Total Operating Expenses | $133,892 | $168,392 | $200,592 |
| Profit Before Interest and Taxes | ($59,189) | $52,142 | $84,769 |
| EBITDA | ($57,197) | $54,134 | $86,761 |
| Interest Expense | $0 | $0 | $0 |
| Taxes Incurred | $0 | $15,642 | $25,431 |
| Net Profit | ($59,189) | $36,499 | $59,338 |
| Net Profit/Sales | -47.54% | 9.93% | 12.48% |
8.4 Projected Cash Flow
The following table and chart will indicate Projected Cash Flow.

| Pro Forma Cash Flow | |||
| Year 1 | Year 2 | Year 3 | |
| Cash Received | |||
| Cash from Operations | |||
| Cash Sales | $31,126 | $91,889 | $118,900 |
| Cash from Receivables | $66,011 | $222,242 | $332,951 |
| Subtotal Cash from Operations | $97,137 | $314,131 | $451,852 |
| Additional Cash Received | |||
| Sales Tax, VAT, HST/GST Received | $0 | $0 | $0 |
| New Current Borrowing | $0 | $0 | $0 |
| New Other Liabilities (interest-free) | $0 | $0 | $0 |
| New Long-term Liabilities | $0 | $0 | $0 |
| Sales of Other Current Assets | $0 | $0 | $0 |
| Sales of Long-term Assets | $0 | $0 | $0 |
| New Investment Received | $0 | $0 | $0 |
| Subtotal Cash Received | $97,137 | $314,131 | $451,852 |
| Expenditures | Year 1 | Year 2 | Year 3 |
| Expenditures from Operations | |||
| Cash Spending | $98,000 | $128,000 | $156,000 |
| Bill Payments | $74,351 | $193,890 | $253,569 |
| Subtotal Spent on Operations | $172,351 | $321,890 | $409,569 |
| Additional Cash Spent | |||
| Sales Tax, VAT, HST/GST Paid Out | $0 | $0 | $0 |
| Principal Repayment of Current Borrowing | $0 | $0 | $0 |
| Other Liabilities Principal Repayment | $0 | $0 | $0 |
| Long-term Liabilities Principal Repayment | $0 | $0 | $0 |
| Purchase Other Current Assets | $0 | $0 | $0 |
| Purchase Long-term Assets | $0 | $0 | $0 |
| Dividends | $0 | $0 | $0 |
| Subtotal Cash Spent | $172,351 | $321,890 | $409,569 |
| Net Cash Flow | ($75,213) | ($7,759) | $42,283 |
| Cash Balance | $41,387 | $33,628 | $75,911 |
8.5 Projected Balance Sheet
The following table will indicate the Projected Balance Sheet.
| Pro Forma Balance Sheet | |||
| Year 1 | Year 2 | Year 3 | |
| Assets | |||
| Current Assets | |||
| Cash | $41,387 | $33,628 | $75,911 |
| Accounts Receivable | $27,367 | $80,792 | $104,541 |
| Other Current Assets | $0 | $0 | $0 |
| Total Current Assets | $68,754 | $114,420 | $180,452 |
| Long-term Assets | |||
| Long-term Assets | $10,000 | $10,000 | $10,000 |
| Accumulated Depreciation | $1,992 | $3,984 | $5,976 |
| Total Long-term Assets | $8,008 | $6,016 | $4,024 |
| Total Assets | $76,762 | $120,436 | $184,476 |
| Liabilities and Capital | Year 1 | Year 2 | Year 3 |
| Current Liabilities | |||
| Accounts Payable | $9,351 | $16,526 | $21,228 |
| Current Borrowing | $0 | $0 | $0 |
| Other Current Liabilities | $0 | $0 | $0 |
| Subtotal Current Liabilities | $9,351 | $16,526 | $21,228 |
| Long-term Liabilities | $0 | $0 | $0 |
| Total Liabilities | $9,351 | $16,526 | $21,228 |
| Paid-in Capital | $140,000 | $140,000 | $140,000 |
| Retained Earnings | ($13,400) | ($72,589) | ($36,090) |
| Earnings | ($59,189) | $36,499 | $59,338 |
| Total Capital | $67,411 | $103,910 | $163,248 |
| Total Liabilities and Capital | $76,762 | $120,436 | $184,476 |
| Net Worth | $67,411 | $103,910 | $163,248 |
8.6 Business Ratios
The following chart offers Business Ratios for this company as well as the industry averages.
| Ratio Analysis | ||||
| Year 1 | Year 2 | Year 3 | Industry Profile | |
| Sales Growth | 0.00% | 195.21% | 29.40% | 3.34% |
| Percent of Total Assets | ||||
| Accounts Receivable | 35.65% | 67.08% | 56.67% | 16.20% |
| Other Current Assets | 0.00% | 0.00% | 0.00% | 23.64% |
| Total Current Assets | 89.57% | 95.00% | 97.82% | 79.15% |
| Long-term Assets | 10.43% | 5.00% | 2.18% | 20.85% |
| Total Assets | 100.00% | 100.00% | 100.00% | 100.00% |
| Current Liabilities | 12.18% | 13.72% | 11.51% | 36.32% |
| Long-term Liabilities | 0.00% | 0.00% | 0.00% | 15.56% |
| Total Liabilities | 12.18% | 13.72% | 11.51% | 51.88% |
| Net Worth | 87.82% | 86.28% | 88.49% | 48.12% |
| Percent of Sales | ||||
| Sales | 100.00% | 100.00% | 100.00% | 100.00% |
| Gross Margin | 60.00% | 60.00% | 60.00% | 34.87% |
| Selling, General & Administrative Expenses | 107.54% | 50.07% | 47.52% | 22.04% |
| Advertising Expenses | 0.00% | 0.00% | 0.00% | 1.89% |
| Profit Before Interest and Taxes | -47.54% | 14.19% | 17.82% | 1.46% |
| Main Ratios | ||||
| Current | 7.35 | 6.92 | 8.50 | 1.95 |
| Quick | 7.35 | 6.92 | 8.50 | 0.75 |
| Total Debt to Total Assets | 12.18% | 13.72% | 11.51% | 59.08% |
| Pre-tax Return on Net Worth | -87.80% | 50.18% | 51.93% | 3.36% |
| Pre-tax Return on Assets | -77.11% | 43.29% | 45.95% | 8.20% |
| Additional Ratios | Year 1 | Year 2 | Year 3 | |
| Net Profit Margin | -47.54% | 9.93% | 12.48% | n.a |
| Return on Equity | -87.80% | 35.13% | 36.35% | n.a |
| Activity Ratios | ||||
| Accounts Receivable Turnover | 3.41 | 3.41 | 3.41 | n.a |
| Collection Days | 56 | 72 | 95 | n.a |
| Accounts Payable Turnover | 8.95 | 12.17 | 12.17 | n.a |
| Payment Days | 27 | 23 | 27 | n.a |
| Total Asset Turnover | 1.62 | 3.05 | 2.58 | n.a |
| Debt Ratios | ||||
| Debt to Net Worth | 0.14 | 0.16 | 0.13 | n.a |
| Current Liab. to Liab. | 1.00 | 1.00 | 1.00 | n.a |
| Liquidity Ratios | ||||
| Net Working Capital | $59,403 | $97,894 | $159,224 | n.a |
| Interest Coverage | 0.00 | 0.00 | 0.00 | n.a |
| Additional Ratios | ||||
| Assets to Sales | 0.62 | 0.33 | 0.39 | n.a |
| Current Debt/Total Assets | 12% | 14% | 12% | n.a |
| Acid Test | 4.43 | 2.03 | 3.58 | n.a |
| Sales/Net Worth | 1.85 | 3.54 | 2.91 | n.a |
| Dividend Payout | 0.00 | 0.00 | 0.00 | n.a |
Appendix
| Sales Forecast | |||||||||||||
| Month 1 | Month 2 | Month 3 | Month 4 | Month 5 | Month 6 | Month 7 | Month 8 | Month 9 | Month 10 | Month 11 | Month 12 | ||
| Sales | |||||||||||||
| Individuals | 0% | $0 | $0 | $0 | $3,432 | $4,454 | $5,645 | $6,754 | $7,656 | $8,776 | $9,987 | $10,887 | $8,989 |
| Businesses | 0% | $0 | $0 | $0 | $2,986 | $3,875 | $4,911 | $5,876 | $6,661 | $7,635 | $8,689 | $9,472 | $7,820 |
| Total Sales | $0 | $0 | $0 | $6,418 | $8,329 | $10,556 | $12,630 | $14,317 | $16,411 | $18,676 | $20,359 | $16,809 | |
| Direct Cost of Sales | Month 1 | Month 2 | Month 3 | Month 4 | Month 5 | Month 6 | Month 7 | Month 8 | Month 9 | Month 10 | Month 11 | Month 12 | |
| Individuals | $0 | $0 | $0 | $1,373 | $1,782 | $2,258 | $2,702 | $3,062 | $3,510 | $3,995 | $4,355 | $3,596 | |
| Businesses | $0 | $0 | $0 | $1,194 | $1,550 | $1,964 | $2,350 | $2,664 | $3,054 | $3,475 | $3,789 | $3,128 | |
| Subtotal Direct Cost of Sales | $0 | $0 | $0 | $2,567 | $3,332 | $4,222 | $5,052 | $5,727 | $6,564 | $7,470 | $8,143 | $6,724 | |
| Personnel Plan | |||||||||||||
| Month 1 | Month 2 | Month 3 | Month 4 | Month 5 | Month 6 | Month 7 | Month 8 | Month 9 | Month 10 | Month 11 | Month 12 | ||
| Jen | 0% | $2,000 | $2,000 | $2,000 | $2,000 | $2,000 | $2,000 | $2,000 | $2,000 | $2,000 | $2,000 | $2,000 | $2,000 |
| David | 0% | $2,000 | $2,000 | $2,000 | $2,000 | $2,000 | $2,000 | $2,000 | $2,000 | $2,000 | $2,000 | $2,000 | $2,000 |
| Sales | 0% | $0 | $0 | $2,500 | $2,500 | $2,500 | $2,500 | $2,500 | $2,500 | $2,500 | $2,500 | $2,500 | $2,500 |
| Customer Service | 0% | $0 | $0 | $2,500 | $2,500 | $2,500 | $2,500 | $2,500 | $2,500 | $2,500 | $2,500 | $2,500 | $2,500 |
| Total People | 2 | 2 | 4 | 4 | 4 | 4 | 4 | 4 | 4 | 4 | 4 | 4 | |
| Total Payroll | $4,000 | $4,000 | $9,000 | $9,000 | $9,000 | $9,000 | $9,000 | $9,000 | $9,000 | $9,000 | $9,000 | $9,000 | |
| General Assumptions | |||||||||||||
| Month 1 | Month 2 | Month 3 | Month 4 | Month 5 | Month 6 | Month 7 | Month 8 | Month 9 | Month 10 | Month 11 | Month 12 | ||
| Plan Month | 1 | 2 | 3 | 4 | 5 | 6 | 7 | 8 | 9 | 10 | 11 | 12 | |
| Current Interest Rate | 10.00% | 10.00% | 10.00% | 10.00% | 10.00% | 10.00% | 10.00% | 10.00% | 10.00% | 10.00% | 10.00% | 10.00% | |
| Long-term Interest Rate | 10.00% | 10.00% | 10.00% | 10.00% | 10.00% | 10.00% | 10.00% | 10.00% | 10.00% | 10.00% | 10.00% | 10.00% | |
| Tax Rate | 30.00% | 30.00% | 30.00% | 30.00% | 30.00% | 30.00% | 30.00% | 30.00% | 30.00% | 30.00% | 30.00% | 30.00% | |
| Other | 0 | 0 | 0 | 0 | 0 | 0 | 0 | 0 | 0 | 0 | 0 | 0 | |
| Pro Forma Profit and Loss | |||||||||||||
| Month 1 | Month 2 | Month 3 | Month 4 | Month 5 | Month 6 | Month 7 | Month 8 | Month 9 | Month 10 | Month 11 | Month 12 | ||
| Sales | $0 | $0 | $0 | $6,418 | $8,329 | $10,556 | $12,630 | $14,317 | $16,411 | $18,676 | $20,359 | $16,809 | |
| Direct Cost of Sales | $0 | $0 | $0 | $2,567 | $3,332 | $4,222 | $5,052 | $5,727 | $6,564 | $7,470 | $8,143 | $6,724 | |
| Other Costs of Goods | $0 | $0 | $0 | $0 | $0 | $0 | $0 | $0 | $0 | $0 | $0 | $0 | |
| Total Cost of Sales | $0 | $0 | $0 | $2,567 | $3,332 | $4,222 | $5,052 | $5,727 | $6,564 | $7,470 | $8,143 | $6,724 | |
| Gross Margin | $0 | $0 | $0 | $3,851 | $4,997 | $6,334 | $7,578 | $8,590 | $9,847 | $11,205 | $12,215 | $10,086 | |
| Gross Margin % | 0.00% | 0.00% | 0.00% | 60.00% | 60.00% | 60.00% | 60.00% | 60.00% | 60.00% | 60.00% | 60.00% | 60.00% | |
| Expenses | |||||||||||||
| Payroll | $4,000 | $4,000 | $9,000 | $9,000 | $9,000 | $9,000 | $9,000 | $9,000 | $9,000 | $9,000 | $9,000 | $9,000 | |
| Sales and Marketing and Other Expenses | $350 | $350 | $350 | $350 | $350 | $350 | $350 | $350 | $350 | $350 | $350 | $350 | |
| Depreciation | $166 | $166 | $166 | $166 | $166 | $166 | $166 | $166 | $166 | $166 | $166 | $166 | |
| Rent | $600 | $600 | $600 | $600 | $600 | $600 | $600 | $600 | $600 | $600 | $600 | $600 | |
| Utilities | $300 | $300 | $300 | $300 | $300 | $300 | $300 | $300 | $300 | $300 | $300 | $300 | |
| Insurance | $250 | $250 | $250 | $250 | $250 | $250 | $250 | $250 | $250 | $250 | $250 | $250 | |
| Payroll Taxes | 15% | $600 | $600 | $1,350 | $1,350 | $1,350 | $1,350 | $1,350 | $1,350 | $1,350 | $1,350 | $1,350 | $1,350 |
| Other | $100 | $100 | $100 | $100 | $100 | $100 | $100 | $100 | $100 | $100 | $100 | $100 | |
| Total Operating Expenses | $6,366 | $6,366 | $12,116 | $12,116 | $12,116 | $12,116 | $12,116 | $12,116 | $12,116 | $12,116 | $12,116 | $12,116 | |
| Profit Before Interest and Taxes | ($6,366) | ($6,366) | ($12,116) | ($8,265) | ($7,119) | ($5,782) | ($4,538) | ($3,526) | ($2,269) | ($911) | $99 | ($2,030) | |
| EBITDA | ($6,200) | ($6,200) | ($11,950) | ($8,099) | ($6,953) | ($5,616) | ($4,372) | ($3,360) | ($2,103) | ($745) | $265 | ($1,864) | |
| Interest Expense | $0 | $0 | $0 | $0 | $0 | $0 | $0 | $0 | $0 | $0 | $0 | $0 | |
| Taxes Incurred | $0 | $0 | $0 | $0 | $0 | $0 | $0 | $0 | $0 | $0 | $0 | $0 | |
| Net Profit | ($6,366) | ($6,366) | ($12,116) | ($8,265) | ($7,119) | ($5,782) | ($4,538) | ($3,526) | ($2,269) | ($911) | $99 | ($2,030) | |
| Net Profit/Sales | 0.00% | 0.00% | 0.00% | -128.79% | -85.47% | -54.78% | -35.93% | -24.63% | -13.83% | -4.88% | 0.49% | -12.08% | |
| Pro Forma Cash Flow | |||||||||||||
| Month 1 | Month 2 | Month 3 | Month 4 | Month 5 | Month 6 | Month 7 | Month 8 | Month 9 | Month 10 | Month 11 | Month 12 | ||
| Cash Received | |||||||||||||
| Cash from Operations | |||||||||||||
| Cash Sales | $0 | $0 | $0 | $1,604 | $2,082 | $2,639 | $3,157 | $3,579 | $4,103 | $4,669 | $5,090 | $4,202 | |
| Cash from Receivables | $0 | $0 | $0 | $0 | $160 | $4,861 | $6,302 | $7,969 | $9,515 | $10,790 | $12,365 | $14,049 | |
| Subtotal Cash from Operations | $0 | $0 | $0 | $1,604 | $2,243 | $7,500 | $9,460 | $11,548 | $13,617 | $15,459 | $17,455 | $18,251 | |
| Additional Cash Received | |||||||||||||
| Sales Tax, VAT, HST/GST Received | 0.00% | $0 | $0 | $0 | $0 | $0 | $0 | $0 | $0 | $0 | $0 | $0 | $0 |
| New Current Borrowing | $0 | $0 | $0 | $0 | $0 | $0 | $0 | $0 | $0 | $0 | $0 | $0 | |
| New Other Liabilities (interest-free) | $0 | $0 | $0 | $0 | $0 | $0 | $0 | $0 | $0 | $0 | $0 | $0 | |
| New Long-term Liabilities | $0 | $0 | $0 | $0 | $0 | $0 | $0 | $0 | $0 | $0 | $0 | $0 | |
| Sales of Other Current Assets | $0 | $0 | $0 | $0 | $0 | $0 | $0 | $0 | $0 | $0 | $0 | $0 | |
| Sales of Long-term Assets | $0 | $0 | $0 | $0 | $0 | $0 | $0 | $0 | $0 | $0 | $0 | $0 | |
| New Investment Received | $0 | $0 | $0 | $0 | $0 | $0 | $0 | $0 | $0 | $0 | $0 | $0 | |
| Subtotal Cash Received | $0 | $0 | $0 | $1,604 | $2,243 | $7,500 | $9,460 | $11,548 | $13,617 | $15,459 | $17,455 | $18,251 | |
| Expenditures | Month 1 | Month 2 | Month 3 | Month 4 | Month 5 | Month 6 | Month 7 | Month 8 | Month 9 | Month 10 | Month 11 | Month 12 | |
| Expenditures from Operations | |||||||||||||
| Cash Spending | $4,000 | $4,000 | $9,000 | $9,000 | $9,000 | $9,000 | $9,000 | $9,000 | $9,000 | $9,000 | $9,000 | $9,000 | |
| Bill Payments | $73 | $2,200 | $2,225 | $3,036 | $5,543 | $6,311 | $7,200 | $8,024 | $8,705 | $9,545 | $10,443 | $11,046 | |
| Subtotal Spent on Operations | $4,073 | $6,200 | $11,225 | $12,036 | $14,543 | $15,311 | $16,200 | $17,024 | $17,705 | $18,545 | $19,443 | $20,046 | |
| Additional Cash Spent | |||||||||||||
| Sales Tax, VAT, HST/GST Paid Out | $0 | $0 | $0 | $0 | $0 | $0 | $0 | $0 | $0 | $0 | $0 | $0 | |
| Principal Repayment of Current Borrowing | $0 | $0 | $0 | $0 | $0 | $0 | $0 | $0 | $0 | $0 | $0 | $0 | |
| Other Liabilities Principal Repayment | $0 | $0 | $0 | $0 | $0 | $0 | $0 | $0 | $0 | $0 | $0 | $0 | |
| Long-term Liabilities Principal Repayment | $0 | $0 | $0 | $0 | $0 | $0 | $0 | $0 | $0 | $0 | $0 | $0 | |
| Purchase Other Current Assets | $0 | $0 | $0 | $0 | $0 | $0 | $0 | $0 | $0 | $0 | $0 | $0 | |
| Purchase Long-term Assets | $0 | $0 | $0 | $0 | $0 | $0 | $0 | $0 | $0 | $0 | $0 | $0 | |
| Dividends | $0 | $0 | $0 | $0 | $0 | $0 | $0 | $0 | $0 | $0 | $0 | $0 | |
| Subtotal Cash Spent | $4,073 | $6,200 | $11,225 | $12,036 | $14,543 | $15,311 | $16,200 | $17,024 | $17,705 | $18,545 | $19,443 | $20,046 | |
| Net Cash Flow | ($4,073) | ($6,200) | ($11,225) | ($10,431) | ($12,300) | ($7,811) | ($6,740) | ($5,476) | ($4,087) | ($3,086) | ($1,988) | ($1,795) | |
| Cash Balance | $112,527 | $106,327 | $95,102 | $84,671 | $72,371 | $64,560 | $57,819 | $52,343 | $48,256 | $45,170 | $43,182 | $41,387 | |
| Pro Forma Balance Sheet | |||||||||||||
| Month 1 | Month 2 | Month 3 | Month 4 | Month 5 | Month 6 | Month 7 | Month 8 | Month 9 | Month 10 | Month 11 | Month 12 | ||
| Assets | Starting Balances | ||||||||||||
| Current Assets | |||||||||||||
| Cash | $116,600 | $112,527 | $106,327 | $95,102 | $84,671 | $72,371 | $64,560 | $57,819 | $52,343 | $48,256 | $45,170 | $43,182 | $41,387 |
| Accounts Receivable | $0 | $0 | $0 | $0 | $4,813 | $10,900 | $13,956 | $17,126 | $19,894 | $22,688 | $25,905 | $28,809 | $27,367 |
| Other Current Assets | $0 | $0 | $0 | $0 | $0 | $0 | $0 | $0 | $0 | $0 | $0 | $0 | $0 |
| Total Current Assets | $116,600 | $112,527 | $106,327 | $95,102 | $89,484 | $83,270 | $78,515 | $74,945 | $72,237 | $70,944 | $71,075 | $71,991 | $68,754 |
| Long-term Assets | |||||||||||||
| Long-term Assets | $10,000 | $10,000 | $10,000 | $10,000 | $10,000 | $10,000 | $10,000 | $10,000 | $10,000 | $10,000 | $10,000 | $10,000 | $10,000 |
| Accumulated Depreciation | $0 | $166 | $332 | $498 | $664 | $830 | $996 | $1,162 | $1,328 | $1,494 | $1,660 | $1,826 | $1,992 |
| Total Long-term Assets | $10,000 | $9,834 | $9,668 | $9,502 | $9,336 | $9,170 | $9,004 | $8,838 | $8,672 | $8,506 | $8,340 | $8,174 | $8,008 |
| Total Assets | $126,600 | $122,361 | $115,995 | $104,604 | $98,820 | $92,440 | $87,519 | $83,783 | $80,909 | $79,450 | $79,415 | $80,165 | $76,762 |
| Liabilities and Capital | Month 1 | Month 2 | Month 3 | Month 4 | Month 5 | Month 6 | Month 7 | Month 8 | Month 9 | Month 10 | Month 11 | Month 12 | |
| Current Liabilities | |||||||||||||
| Accounts Payable | $0 | $2,127 | $2,127 | $2,852 | $5,333 | $6,072 | $6,933 | $7,735 | $8,387 | $9,197 | $10,073 | $10,724 | $9,351 |
| Current Borrowing | $0 | $0 | $0 | $0 | $0 | $0 | $0 | $0 | $0 | $0 | $0 | $0 | $0 |
| Other Current Liabilities | $0 | $0 | $0 | $0 | $0 | $0 | $0 | $0 | $0 | $0 | $0 | $0 | $0 |
| Subtotal Current Liabilities | $0 | $2,127 | $2,127 | $2,852 | $5,333 | $6,072 | $6,933 | $7,735 | $8,387 | $9,197 | $10,073 | $10,724 | $9,351 |
| Long-term Liabilities | $0 | $0 | $0 | $0 | $0 | $0 | $0 | $0 | $0 | $0 | $0 | $0 | $0 |
| Total Liabilities | $0 | $2,127 | $2,127 | $2,852 | $5,333 | $6,072 | $6,933 | $7,735 | $8,387 | $9,197 | $10,073 | $10,724 | $9,351 |
| Paid-in Capital | $140,000 | $140,000 | $140,000 | $140,000 | $140,000 | $140,000 | $140,000 | $140,000 | $140,000 | $140,000 | $140,000 | $140,000 | $140,000 |
| Retained Earnings | ($13,400) | ($13,400) | ($13,400) | ($13,400) | ($13,400) | ($13,400) | ($13,400) | ($13,400) | ($13,400) | ($13,400) | ($13,400) | ($13,400) | ($13,400) |
| Earnings | $0 | ($6,366) | ($12,732) | ($24,848) | ($33,113) | ($40,232) | ($46,014) | ($50,552) | ($54,078) | ($56,348) | ($57,258) | ($57,159) | ($59,189) |
| Total Capital | $126,600 | $120,234 | $113,868 | $101,752 | $93,487 | $86,368 | $80,586 | $76,048 | $72,522 | $70,252 | $69,342 | $69,441 | $67,411 |
| Total Liabilities and Capital | $126,600 | $122,361 | $115,995 | $104,604 | $98,820 | $92,440 | $87,519 | $83,783 | $80,909 | $79,450 | $79,415 | $80,165 | $76,762 |
| Net Worth | $126,600 | $120,234 | $113,868 | $101,752 | $93,487 | $86,368 | $80,586 | $76,048 | $72,522 | $70,252 | $69,342 | $69,441 | $67,411 |

