
Granite Industries, Inc.
Executive Summary
Granite Industries, Inc. (Granite) is a specialty chemical formulator, lab analysis agency, and toll manufacturer, selling products to companies from cosmetics manufacturers to food supplement marketers. We manufacture and distribute Creatine Monohydrate, an approved food supplement used to improve strength, endurance, and muscle mass. Granite also produces five other speciality chemicals that will be detailed later in this document. A strong knowledge-based management team, with a combined thirty-years of experience in this industry, incorporated Granite.
Granite is a niche player in the speciality- and industrial-chemicals business, focusing on value-added products which are not widely or readily available in the United States. We have perfected unique manufacturing processes resulting in lower manufacturing costs and high profitability. We have established a network of strategic alliances with distribution companies who lack our capability to ascend from laboratory to commercial scale and manufacture products in accordance with quality specifications.
Our distributors and our customers have given us an opportunity to provide products beyond our present capability. We need to add equipment, increase our inventory, and establish marketing and support activities.
Sales and Projections
We have had sales increase steadily over the last three years. These numbers give us a strong reference point on which we have based our sales projection for the upcoming three fiscal years. Our projected sales for the three years of this plan are shown in the Sales Forecast table.
Funding Requirements
We are seeking adequate capital to enable us to expand our operation and become a major factor in the production of chemicals in the industrial, consumer, and textile markets Our signature product is Creatine Monohydrate; we manufacture both the powdered and liquid forms. We are the only company in the world capable of manufacturing this product in liquid form. Our market research shows that the demand for this product alone justifies the expansion of our facilities.
Note: Customer and Distributor company names and financial information have been removed from this sample plan to protect proprietary and confidential information.
1.1 Objectives
The objectives of this business plan are outlined below:
- Sales increasing by leaps and bounds through Year 3.
- Gross Margin the envy of the industry.
- Net Profits increases commensurate with sales growth.

1.2 Mission
We have the management team and the chemical formulations to become a major player in the specialized niche we serve. We have developed new technology and processes that are in demand by other chemical manufacturers as well as by major distributors who do not have the ability to produce our speciality products. We see our mission as not only that of toll and custom manufacturer, but as a trade supplier where we can reach the end-user market with products we consider to be proprietary. We seek a fair and responsible profit, enough to keep the company financially healthy for the long term and to satisfactorily compensate owners and investors for their money and risk.
Company Summary
Granite began operations as a custom and toll chemical manufacturer. The management team consists of a president and CEO, a vice president of operations and marketing and a physician.
Note: Names have been removed for confidentiality.
2.1 Company History
Beginning in June, we spent the remainder of our first year outfitting our manufacturing facility, which included equipment installation and build-out. We became fully operational the first quarter of our second year. Our concentration was on small lot toll manufacturing and custom orders. In that same quarter we were approached by Customer A, LLC to become a subcontractor for a $23 million order they had from Manufacturer A. They offered us a mirror contract to produce Creatine Monohydrate. It was necessary for us to expand facilities to meet the requirements and we were successful in obtaining an SBA loan through Wachovia Bank. The loan process took 12 months and we were only able to accommodate a small part of the Customer A order during that period through financial support from the principals. Customer A had to have a back-up producer during this period. Unfortunately that producer failed to meet Manufacturer A’s quality standards and Customer A defaulted on the contract. This also ended our contract.
We returned to our original plan which has continued to the present time. Our experience with Customer A brought us to realize that the market for Creatine Monohydrate exceeds $300 million. Creatine is an FDA approved food supplement which is used by athletes and weekend sports enthusiasts alike. More importantly, we realized that we would be the only domestic source of this product. Proceeding from that point, and with no marketing program other than word-of-mouth, we achieved increasing sales in the succeeding years. Our financials in this document provide the details as well as our projections. We are convinced that this is a lucrative market and that, with adequate equipment and marketing, we can capture a significant part of it.
Note: Customer and Distributor company names and financial information have been removed from this sample plan to protect proprietary and confidential information.
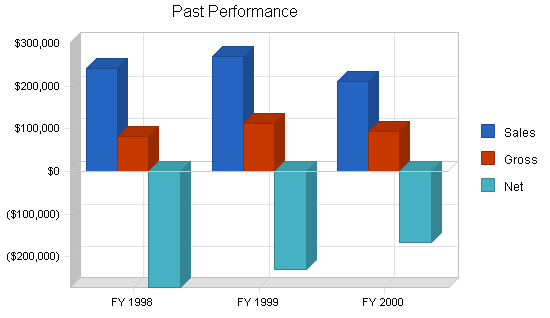
| Past Performance | |||
| FY 1998 | FY 1999 | FY 2000 | |
| Sales | $241,782 | $269,507 | $210,102 |
| Gross Margin | $82,812 | $112,178 | $94,234 |
| Gross Margin % | 34.25% | 41.62% | 44.85% |
| Operating Expenses | $388,109 | $332,338 | $247,060 |
| Collection Period (days) | 0 | 0 | 73 |
| Inventory Turnover | 6.00 | 6.00 | 0.00 |
| Balance Sheet | |||
| FY 1998 | FY 1999 | FY 2000 | |
| Current Assets | |||
| Cash | $481 | $7,644 | $12,000 |
| Accounts Receivable | $16,452 | $52,499 | $15,500 |
| Inventory | $27,888 | $17,526 | $18,873 |
| Other Current Assets | $0 | $0 | $0 |
| Total Current Assets | $44,821 | $77,669 | $46,373 |
| Long-term Assets | |||
| Long-term Assets | $258,795 | $157,530 | $149,118 |
| Accumulated Depreciation | $31,013 | $39,731 | $23,605 |
| Total Long-term Assets | $227,782 | $117,799 | $125,513 |
| Total Assets | $272,603 | $195,468 | $171,886 |
| Current Liabilities | |||
| Accounts Payable | $120,509 | $76,789 | $26,513 |
| Current Borrowing | $0 | $40,785 | $7,291 |
| Other Current Liabilities (interest free) | $0 | $0 | $43,503 |
| Total Current Liabilities | $120,509 | $117,574 | $77,307 |
| Long-term Liabilities | $262,368 | $280,000 | $324,550 |
| Total Liabilities | $382,877 | $397,574 | $401,857 |
| Paid-in Capital | $386,759 | $535,007 | $814,820 |
| Retained Earnings | ($224,683) | ($507,974) | ($877,599) |
| Earnings | ($272,350) | ($229,139) | ($167,192) |
| Total Capital | ($110,274) | ($202,106) | ($229,971) |
| Total Capital and Liabilities | $272,603 | $195,468 | $171,886 |
| Other Inputs | |||
| Payment Days | 0 | 0 | 30 |
| Sales on Credit | $0 | $0 | $170,102 |
| Receivables Turnover | 0.00 | 0.00 | 10.97 |
2.2 Company Ownership
Granite incorporated in Delaware as a C Corporation. The company is owned in equal shares by the three members of the management team.
Products
Creatine Monohydrate. This is a dietary supplement commonly used by athletes to improve strength, endurance, and muscle mass. Creatine has become the most popular body building supplement in use today. It is sold in many forms through health food stores, drug stores, and discount chains. The leading producers of Creatine are in Europe, and only a few recently in the United States. The distribution system is complex, with manufacturers selling through a layered system. We have developed a Creatine-based drink which is one-of-a-kind. We hope to begin marketing the product in 2001. Sales potential is well over $1 million per year.
Kelate Cu. This is a specialty product used in cosmetics. It is distributed through Distributor A by special arrangement. Their largest customers are Estee Lauder and Revlon. We project sales of this product to be between $140,000 and $175,000 per year.
Melasyn 100. This is a synthetic form of natural melanin. It is used as a pigment for vitiligo preparation and as a self tanning agent. It is water soluble, which makes it easy to formulate in cosmetic preparations. We are working with Customer A to supply this product to Distributor A. We project sales of $250,000 in 2001.
G-REZ DB. This is a specialty coating material used on industrial buffing pads. We developed the product at the request of the Customer C and sales can reach $300,000 in 2001.
Becrosan 2128A. This is a corrosion inhibitor with a bright future. Similar chemistry has been very successful in Europe for several years. We have manufactured this product on a toll arrangement for Customer B at a level of $65,000 per year. With marketing, we estimate the potential to be $260,000.

Ion Exchange Resins. We provide a toll drying service for Customer D at a level of $35,000 per year. We feel this can increase substantially with additional equipment.
Recrystallized Flavoring Product A. This is a crude Flavor A extract. We purify the extract into an edible grade flavoring using our proprietary recrystallization process. It is then used in both food and tobacco industries. We teamed with Distributor B, the world’s largest distributor of Flavor A, to develop the process. Broker A is the broker. Estimated sales based on current demand levels are $75,000 in 2001.
Note: Customer and Distributor company names and financial information have been removed from this sample plan to protect proprietary and confidential information.
Market Analysis Summary
We are a highly technical niche player with a specialized product line that is in great demand. Our target markets are the distributors who have established relationships with speciality products firms, textile chemical companies, and consumer products outlets. We are essentially the manufacturing arm for these distributors and can provide development services, as well as products for them.
4.1 Market Segmentation
Our market is divided into three segments:
- Industrial Products: In this segment our customers include Customer B, Customer D and Distributor A.
- Consumer Products: Handled primarily through distributors.
- Textile Products: Customers are: Customer E, Customer C, Customer F and Customer G.
Customer Profiles:
- Customer E. This family of companies are manufacturers and distributors of textile speciality chemicals. Our sales to them in 1999 were $59,000, and were $72,000 in 2000. Our sales to them are estimated to grow to $250,000.
- Customer A. A marketing and chemical broker company. We provide product and process development and manufacturing services. They are the agent for Creatine Monohydrate, Kelate CU, and Melasyn 100. The potential here is over $2 million in sales.
- Broker A. A marketing company and chemical broker. We process ion exchange resins and purified Flavoring Product A for them. We can anticipate $200 to $300,000 in sales to them per year.
- Distributor A. A marketing company. They specialize in cosmetic and personal care products. They are the distributors of Kelate Cu, Melasyn 100, and Provitamin B-5, all of which we produce for them.
- Customer B. We produce corrosion inhibitors for them.
- Customer C. The world’s largest supplier of industrial buffing pads. We have developed special coatings for them which have been approved and recommended to their worldwide subsidiaries.
- Customer D. Manufacturers and distributors of ion exchange resins. We provide both custom and toll manufacturing processes for them. Custom and toll manufacturers are two types of distributors that Granite serves. A custom manufacturer may provide the materials for Granite to use the formula and processes on. A toll manufacturer provides their own materials and formulation for Granite to mix the product.
Note: Customer and Distributor company names and financial information have been removed from this sample plan to protect proprietary and confidential information.
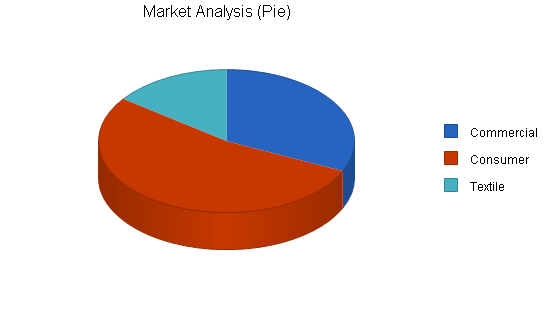
| Market Analysis | |||||||
| 2000 | 2001 | 2002 | 2003 | 2004 | |||
| Potential Customers | Growth | CAGR | |||||
| Commercial | 10% | 75,000 | 52,500 | 57,750 | 63,525 | 69,878 | -1.75% |
| Consumer | 22% | 125,000 | 152,500 | 186,050 | 226,981 | 276,917 | 22.00% |
| Textile | 4% | 35,000 | 36,400 | 37,856 | 39,370 | 40,945 | 4.00% |
| Total | 13.34% | 235,000 | 241,400 | 281,656 | 329,876 | 387,740 | 13.34% |
4.2 Target Market Segment Strategy
Consumer Market: This is potentially our biggest market for Creatine Monohydrate; it is limited only by our ability to produce. We have distributors who are begging for the product and we have back orders now, so it is only logical that we will devote most of our time meeting this demand. We look at the potential in this market as the basis for our growth.
Industrial Products: Here, we are selling both through distributors as well as direct to manufacturers. This is an untapped market and has been sustained by our reputation and ability to meet formulation criteria. We know that a marketing effort in this segment will produce sales that could quite possibly bring this segment to an equal level with the consumer market.
Textile Products: We have enough experience within this segment to know that once our manufacturing capability is up and running we could actually devote an entire marketing effort to this segment alone. Both our toll and custom manufacturing capability is strategically attractive to all textile manufacturers, including growing markets outside the U.S.
4.3 Industry Analysis
The chemical industry is characterized by a wide variety of companies ranging in size from the large companies such as DuPont and Monsanto to smaller specialty firms such as ours. The companies are generally organized by either end-use markets or product technology. In the past decade there has been a general trend in the industry to change emphasis from chemicals to biotechnology and pharmaceuticals. The cost of product development and the need to operate factories at high levels of capacity have caused chemical companies of every size to outsource parts of the chemical and manufacturing processes. This has created opportunities for smaller companies to create and occupy niches in development and contract manufacturing. The outsource industry providers occupy a market segment commonly identified as custom and toll manufacturers.
4.3.1 Competition and Buying Patterns
In the mainstream business, channels are critical to volume. Manufacturers and distributors with impact in the international chemical market desperately need speciality and toll manufacturers like us to meet the demand. There are many specialty manufacturers, all of whom seem to have carved out a specific niche of expertise, and upon whom these major manufacturers depend for products. In competition, it seems that the line is drawn at the level of quality performance. We have achieved that level and are recognized for a high standard of quality performance. Companies who would seem to be our competition have subcontracted production to us because they do not have the ability to supply that level of quality.
We have achieved another milestone in the industry by developing certain formulations which we estimate would cost another firm $450,000 to duplicate. The Creatine Monohydrate formulation and process is one of them. We have the only process in the world that can produce this supplement in liquid form. It is extremely important that we seize this opportunity and begin to exclusively market this product.
Strategy and Implementation Summary
We address the market through three business segments: speciality products, textile chemicals, and consumer products. We are a highly technical niche player who has developed strong alliances with distributors who have powerful channel relationships but lack manufacturing or product development capabilities.
Our marketing strategy assumes that we will serve these distributors in three ways:
- Toll Manufacturers, where our customer provides the raw materials and the formulation and we mix to his/her specifications.
- Custom Manufacturers, where our customer may provide materials but we provide the formulation and the processes.
- Trade Supplier, where we develop and sell our own lines of products based on industry and customer needs.
5.1 Competitive Edge
Our competitive edge is in the formulations and manufacturing processes we have developed for the production of the seven products in which we specialize. As detailed above, we are in an excellent position to capture a significant part of the $300 million Creatine Monohydrate market. We simply need to establish a marketing program and begin to promote our capability.
5.2 Sales Strategy
Our sales strategy is outlined below in three phases.
- Phase One is to accommodate our existing customers and to make sure that current orders and subsequent orders are maintained.
- Phase Two will commence when our facilities are expanded. We will then be able to accept new clients and contact companies who have shown interest in our products and be able to accommodate their orders.We plan to hire a high-quality sales person to assist in defining our marketing program.
Both phase one and two will primarily be toll and custom manufacturing.
- Phase Three will begin with the hiring of two additional sales representatives who will develop our end-user program wherein we will begin to sell our own product lines.
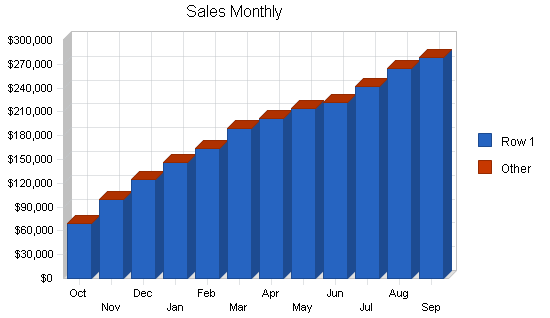
5.2.1 Sales Forecast
Our sales forecast assumes no significant change in costs or prices, which is a reasonable assumption for the past two years.
Our sales increased from 1997 to 1999. We anticipate a slight drop in 2000 due to financial constraints. All of these sales were without the benefit of a marketing program. We feel that with a good marketing program and adequate manufacturing facilities we can achieve substantially increased sales goals in 2001 and 2002. While this seems ambitious, we rely on our distributors’ projections and based on that, we know we will be able to literally sell to the production capacity of our manufacturing facilities.

| Sales Forecast | |||
| FY 2001 | FY 2002 | FY 2003 | |
| Sales | |||
| Row 1 | $2,217,375 | $2,653,800 | $3,450,000 |
| Other | $0 | $0 | $0 |
| Total Sales | $2,217,375 | $2,653,800 | $3,450,000 |
| Direct Cost of Sales | FY 2001 | FY 2002 | FY 2003 |
| Row 1 | $975,445 | $928,830 | $1,207,500 |
| Other | $0 | $0 | $0 |
| Subtotal Direct Cost of Sales | $975,445 | $928,830 | $1,207,500 |
5.3 Milestones
The following table shows specific milestones, with responsibilities assigned, dates, and budgets. We are focusing, in this plan, on a few key milestones that can be accomplished. In addition, shortly following funding we will hire a vice president of marketing and two office personnel. Plant personnel will be added as equipment and facilities are operational.

| Milestones | |||||
| Milestone | Start Date | End Date | Budget | Manager | Department |
| Business Plan | 10/16/2000 | 12/1/2000 | $2,000 | Pres | Total |
| Presentation to Funding Source | 12/5/2000 | 2/15/2001 | $0 | Team | Total |
| Stage One New Funding | 2/15/2001 | 2/30/2001 | $523,500 | Team | Total |
| Location move and up-fit | 3/15/2001 | 3/30/2001 | $15,000 | VP | Manufacturing |
| Equipment Acquisition | 4/10/2001 | 4/20/2000 | $350,000 | VP | Manufacturing |
| Raw Materials | 4/20/2001 | 4/30/2001 | $90,000 | VP | Manufacturing |
| Marketing and Promotion | 4/20/2001 | 12/1/2001 | $400,000 | Pres | Marketing |
| Totals | $1,380,500 | ||||
Management Summary
We have a strong management team that can boast of over 30 years experience in technical and management expertise. Each member has a specific contribution. The president and CEO has spent 20 years working in the chemical industry, and is adept at expanding companies that are well-grounded, but lacking in funding. The vice president of Granite is a specialist in consulting for small business on strategic planning and growth programs. And the final member of the team contributes expertise in start-ups among the pharmaceutical industry. Together, this team has a proven background of expertise and is more than capable of transforming Granite into a leading specialty chemical manufacturer.
Note: Names and resume information have been removed from this sample plan to protect proprietary and confidential information.
6.1 Personnel Plan
Our present plan is to immediately bring two people into the manufacturing operation, followed by an additional two or three throughout the next year. We need to begin looking for a capable marketing professional who has a background in chemical sales. We would like to bring that person on board mid 2001. Followed by one or two sales representatives with both interpersonal and telephone marketing skills. We will also employ support personnel as required.
| Personnel Plan | |||
| FY 2001 | FY 2002 | FY 2003 | |
| Manufacturing | $214,026 | $220,000 | $230,000 |
| Sales | $15,000 | $30,000 | $80,000 |
| Total People | 11 | 11 | 14 |
| Total Payroll | $229,026 | $250,000 | $310,000 |
Financial Plan
We plan to support our growth and debt obligations through increased sales and cash flow. Our major debt with Wachovia Bank is secured by personal and company collateral. Our financials do not include our estimate of the value of proprietary chemical formulations, nor the value of assignable customer contracts.
7.1 Important Assumptions
Positive
The assumptions that support our projections in these tables are: The move to larger facilities and the additional equipment will result in increased production; and the back orders and new orders will be shipped. We have excellent agreements with our primary sources of supply and assume there will be no change in these relationships.We also assume that the demand for Creatine and our other products will continue to increase as evidenced in our market research.
Negative
Another company could develop some of the formulations we have, in which case we would lose some of the technical and market advantage we now have. This will also decrease our valuation. If we cannot find a capable marketing person, who is both sales and technically savvy, in time to get into this market, we would be at a disadvantage. Our hope is that whomever takes an equity position in this project will add marketing expertise. Technology changes, as do buying habits and social structure. A major change in any one of these areas can have a detrimental effect on our business.
| General Assumptions | |||
| FY 2001 | FY 2002 | FY 2003 | |
| Plan Month | 1 | 2 | 3 |
| Current Interest Rate | 10.00% | 10.00% | 10.00% |
| Long-term Interest Rate | 10.00% | 10.00% | 10.00% |
| Tax Rate | 25.00% | 25.00% | 25.00% |
| Other | 0 | 0 | 0 |
7.2 Break-even Analysis
Our Break-even Analysis is based on running costs, the “burn rate” costs we incur to keep the business running, not on theoretical fixed costs that would be relevant only if we were closing. Between payroll, rent, utilities, and other basic day to day costs, we think the monthly figure shown below is a good estimate of fixed costs. Our average variable costs are shown as well. Our COS will be approximately 44% of sales, and we anticipate a healthy profit margin before taxes and debt service in 2001, increasing in 2002.
Our assumptions in average unit sales and average cost per kilogram depend on averaging. We do not really need to calculate an exact average because this is sufficiently close to help us to understand what the real break-even point will be.

| Break-even Analysis | |
| Monthly Revenue Break-even | $68,486 |
| Assumptions: | |
| Average Percent Variable Cost | 44% |
| Estimated Monthly Fixed Cost | $38,358 |
7.3 Projected Profit and Loss
Our profit projection before taxes or debt service for 2001 is attainable. In 2002, we anticipate an increase in net profit, and in 2003 as well.


| Pro Forma Profit and Loss | |||
| FY 2001 | FY 2002 | FY 2003 | |
| Sales | $2,217,375 | $2,653,800 | $3,450,000 |
| Direct Cost of Sales | $975,445 | $928,830 | $1,207,500 |
| Other | $0 | $0 | $0 |
| Total Cost of Sales | $975,445 | $928,830 | $1,207,500 |
| Gross Margin | $1,241,930 | $1,724,970 | $2,242,500 |
| Gross Margin % | 56.01% | 65.00% | 65.00% |
| Expenses | |||
| Payroll | $229,026 | $250,000 | $310,000 |
| Sales and Marketing and Other Expenses | $104,800 | $104,000 | $29,000 |
| Depreciation | $36,000 | $36,000 | $36,000 |
| Leased Equipment | $11,172 | $25,000 | $25,000 |
| Utilities | $12,000 | $15,000 | $18,000 |
| Insurance | $3,545 | $5,000 | $0 |
| Rent | $29,400 | $30,000 | $30,000 |
| Payroll Taxes | $34,354 | $37,500 | $46,500 |
| Other | $0 | $0 | $0 |
| Total Operating Expenses | $460,297 | $502,500 | $494,500 |
| Profit Before Interest and Taxes | $781,633 | $1,222,470 | $1,748,000 |
| EBITDA | $817,633 | $1,258,470 | $1,784,000 |
| Interest Expense | $34,739 | $37,855 | $41,455 |
| Taxes Incurred | $186,723 | $296,154 | $426,636 |
| Net Profit | $560,170 | $888,461 | $1,279,909 |
| Net Profit/Sales | 25.26% | 33.48% | 37.10% |
7.4 Projected Cash Flow
Our cash position at the present time is negligible due to financial constraints in maintaining production for existing orders and being unable to expand to meet future demand. We expect to manage cash flow over the next three years with a couple infusions of new equity investment. We feel that, with the accompanying increases in accounts receivable and inventory, we can extend our line of short term credit. Because of our toll manufacturing capability, inventory can be maintained at a fairly constant level. Receivables, however, will increase dramatically in 2001, and possibly double by 2003.

| Pro Forma Cash Flow | |||
| FY 2001 | FY 2002 | FY 2003 | |
| Cash Received | |||
| Cash from Operations | |||
| Cash Sales | $221,738 | $265,380 | $345,000 |
| Cash from Receivables | $1,530,100 | $2,293,742 | $2,932,272 |
| Subtotal Cash from Operations | $1,751,837 | $2,559,122 | $3,277,272 |
| Additional Cash Received | |||
| Sales Tax, VAT, HST/GST Received | $0 | $0 | $0 |
| New Current Borrowing | $0 | $0 | $0 |
| New Other Liabilities (interest-free) | $7,500 | $0 | $0 |
| New Long-term Liabilities | $60,000 | $60,000 | $60,000 |
| Sales of Other Current Assets | $0 | $0 | $0 |
| Sales of Long-term Assets | $0 | $0 | $0 |
| New Investment Received | $875,000 | $425,000 | $0 |
| Subtotal Cash Received | $2,694,337 | $3,044,122 | $3,337,272 |
| Expenditures | FY 2001 | FY 2002 | FY 2003 |
| Expenditures from Operations | |||
| Cash Spending | $229,026 | $250,000 | $310,000 |
| Bill Payments | $1,364,802 | $1,515,967 | $1,829,035 |
| Subtotal Spent on Operations | $1,593,828 | $1,765,967 | $2,139,035 |
| Additional Cash Spent | |||
| Sales Tax, VAT, HST/GST Paid Out | $0 | $0 | $0 |
| Principal Repayment of Current Borrowing | $7,291 | $0 | $0 |
| Other Liabilities Principal Repayment | $9,000 | $12,000 | $12,000 |
| Long-term Liabilities Principal Repayment | $24,000 | $24,000 | $24,000 |
| Purchase Other Current Assets | $45,000 | $35,000 | $35,000 |
| Purchase Long-term Assets | $50,000 | $25,000 | $25,000 |
| Dividends | $0 | $0 | $0 |
| Subtotal Cash Spent | $1,729,119 | $1,861,967 | $2,235,035 |
| Net Cash Flow | $965,218 | $1,182,155 | $1,102,237 |
| Cash Balance | $977,218 | $2,159,373 | $3,261,611 |
7.5 Projected Balance Sheet
Our projected balance sheet shows an increase in net worth in 2003, at which point we expect to be making enviable profits. Our financial projections show a significant part of our net worth to be from paid-in capital and a positive figure in retained earnings. We are increasing assets in order to meet our equipment and facility requirements, and because we need to increase our receivables and inventory to support our growth in sales. Monthly projections are in the appendices.
| Pro Forma Balance Sheet | |||
| FY 2001 | FY 2002 | FY 2003 | |
| Assets | |||
| Current Assets | |||
| Cash | $977,218 | $2,159,373 | $3,261,611 |
| Accounts Receivable | $481,038 | $575,716 | $748,444 |
| Inventory | $128,852 | $122,694 | $159,505 |
| Other Current Assets | $45,000 | $80,000 | $115,000 |
| Total Current Assets | $1,632,108 | $2,937,784 | $4,284,560 |
| Long-term Assets | |||
| Long-term Assets | $199,118 | $224,118 | $249,118 |
| Accumulated Depreciation | $59,605 | $95,605 | $131,605 |
| Total Long-term Assets | $139,513 | $128,513 | $117,513 |
| Total Assets | $1,771,621 | $3,066,297 | $4,402,073 |
| Liabilities and Capital | FY 2001 | FY 2002 | FY 2003 |
| Current Liabilities | |||
| Accounts Payable | $163,869 | $121,083 | $152,951 |
| Current Borrowing | $0 | $0 | $0 |
| Other Current Liabilities | $42,003 | $30,003 | $18,003 |
| Subtotal Current Liabilities | $205,872 | $151,086 | $170,954 |
| Long-term Liabilities | $360,550 | $396,550 | $432,550 |
| Total Liabilities | $566,422 | $547,636 | $603,504 |
| Paid-in Capital | $1,689,820 | $2,114,820 | $2,114,820 |
| Retained Earnings | ($1,044,791) | ($484,621) | $403,840 |
| Earnings | $560,170 | $888,461 | $1,279,909 |
| Total Capital | $1,205,199 | $2,518,660 | $3,798,569 |
| Total Liabilities and Capital | $1,771,621 | $3,066,297 | $4,402,073 |
| Net Worth | $1,205,199 | $2,518,660 | $3,798,569 |
7.6 Business Ratios
The following table outlines some of the more important ratios from the Chemical Products and Preparations manufacturing industry. The final column, Industry Profile, details specific ratios based on the industry as it is classified by the NAICS code, 325998.
| Ratio Analysis | ||||
| FY 2001 | FY 2002 | FY 2003 | Industry Profile | |
| Sales Growth | 955.38% | 19.68% | 30.00% | 9.54% |
| Percent of Total Assets | ||||
| Accounts Receivable | 27.15% | 18.78% | 17.00% | 32.42% |
| Inventory | 7.27% | 4.00% | 3.62% | 17.28% |
| Other Current Assets | 2.54% | 2.61% | 2.61% | 38.61% |
| Total Current Assets | 92.13% | 95.81% | 97.33% | 88.31% |
| Long-term Assets | 7.87% | 4.19% | 2.67% | 11.69% |
| Total Assets | 100.00% | 100.00% | 100.00% | 100.00% |
| Current Liabilities | 11.62% | 4.93% | 3.88% | 24.17% |
| Long-term Liabilities | 20.35% | 12.93% | 9.83% | 30.99% |
| Total Liabilities | 31.97% | 17.86% | 13.71% | 55.16% |
| Net Worth | 68.03% | 82.14% | 86.29% | 44.84% |
| Percent of Sales | ||||
| Sales | 100.00% | 100.00% | 100.00% | 100.00% |
| Gross Margin | 56.01% | 65.00% | 65.00% | 23.42% |
| Selling, General & Administrative Expenses | 39.81% | 40.16% | 26.99% | 10.99% |
| Advertising Expenses | 3.38% | 2.83% | 0.00% | 0.13% |
| Profit Before Interest and Taxes | 35.25% | 46.06% | 50.67% | 4.87% |
| Main Ratios | ||||
| Current | 7.93 | 19.44 | 25.06 | 2.71 |
| Quick | 7.30 | 18.63 | 24.13 | 1.81 |
| Total Debt to Total Assets | 31.97% | 17.86% | 13.71% | 67.53% |
| Pre-tax Return on Net Worth | 61.97% | 47.03% | 44.93% | 4.59% |
| Pre-tax Return on Assets | 42.16% | 38.63% | 38.77% | 14.15% |
| Additional Ratios | FY 2001 | FY 2002 | FY 2003 | |
| Net Profit Margin | 25.26% | 33.48% | 37.10% | n.a |
| Return on Equity | 46.48% | 35.28% | 33.69% | n.a |
| Activity Ratios | ||||
| Accounts Receivable Turnover | 4.15 | 4.15 | 4.15 | n.a |
| Collection Days | 56 | 81 | 78 | n.a |
| Inventory Turnover | 10.91 | 7.38 | 8.56 | n.a |
| Accounts Payable Turnover | 9.17 | 12.17 | 12.17 | n.a |
| Payment Days | 28 | 35 | 27 | n.a |
| Total Asset Turnover | 1.25 | 0.87 | 0.78 | n.a |
| Debt Ratios | ||||
| Debt to Net Worth | 0.47 | 0.22 | 0.16 | n.a |
| Current Liab. to Liab. | 0.36 | 0.28 | 0.28 | n.a |
| Liquidity Ratios | ||||
| Net Working Capital | $1,426,236 | $2,786,697 | $4,113,606 | n.a |
| Interest Coverage | 22.50 | 32.29 | 42.17 | n.a |
| Additional Ratios | ||||
| Assets to Sales | 0.80 | 1.16 | 1.28 | n.a |
| Current Debt/Total Assets | 12% | 5% | 4% | n.a |
| Acid Test | 4.97 | 14.82 | 19.75 | n.a |
| Sales/Net Worth | 1.84 | 1.05 | 0.91 | n.a |
| Dividend Payout | 0.00 | 0.00 | 0.00 | n.a |
Appendix
| Sales Forecast | |||||||||||||
| Oct | Nov | Dec | Jan | Feb | Mar | Apr | May | Jun | Jul | Aug | Sep | ||
| Sales | |||||||||||||
| Row 1 | 0% | $69,525 | $99,100 | $125,175 | $146,450 | $164,425 | $188,600 | $201,650 | $214,600 | $222,150 | $242,400 | $264,400 | $278,900 |
| Other | 0% | $0 | $0 | $0 | $0 | $0 | $0 | $0 | $0 | $0 | $0 | $0 | $0 |
| Total Sales | $69,525 | $99,100 | $125,175 | $146,450 | $164,425 | $188,600 | $201,650 | $214,600 | $222,150 | $242,400 | $264,400 | $278,900 | |
| Direct Cost of Sales | Oct | Nov | Dec | Jan | Feb | Mar | Apr | May | Jun | Jul | Aug | Sep | |
| Row 1 | $29,200 | $44,595 | $52,573 | $65,902 | $75,635 | $90,528 | $96,792 | $92,278 | $95,524 | $104,232 | $111,048 | $117,138 | |
| Other | $0 | $0 | $0 | $0 | $0 | $0 | $0 | $0 | $0 | $0 | $0 | $0 | |
| Subtotal Direct Cost of Sales | $29,200 | $44,595 | $52,573 | $65,902 | $75,635 | $90,528 | $96,792 | $92,278 | $95,524 | $104,232 | $111,048 | $117,138 | |
| Personnel Plan | |||||||||||||
| Oct | Nov | Dec | Jan | Feb | Mar | Apr | May | Jun | Jul | Aug | Sep | ||
| Manufacturing | 0% | $13,282 | $13,282 | $13,282 | $15,760 | $18,920 | $18,920 | $18,920 | $19,500 | $19,500 | $19,500 | $21,580 | $21,580 |
| Sales | 0% | $0 | $0 | $0 | $0 | $0 | $0 | $0 | $0 | $0 | $0 | $0 | $15,000 |
| Total People | 6 | 6 | 6 | 6 | 6 | 6 | 6 | 9 | 9 | 9 | 9 | 11 | |
| Total Payroll | $13,282 | $13,282 | $13,282 | $15,760 | $18,920 | $18,920 | $18,920 | $19,500 | $19,500 | $19,500 | $21,580 | $36,580 | |
| General Assumptions | |||||||||||||
| Oct | Nov | Dec | Jan | Feb | Mar | Apr | May | Jun | Jul | Aug | Sep | ||
| Plan Month | 1 | 2 | 3 | 4 | 5 | 6 | 7 | 8 | 9 | 10 | 11 | 12 | |
| Current Interest Rate | 10.00% | 10.00% | 10.00% | 10.00% | 10.00% | 10.00% | 10.00% | 10.00% | 10.00% | 10.00% | 10.00% | 10.00% | |
| Long-term Interest Rate | 10.00% | 10.00% | 10.00% | 10.00% | 10.00% | 10.00% | 10.00% | 10.00% | 10.00% | 10.00% | 10.00% | 10.00% | |
| Tax Rate | 25.00% | 25.00% | 25.00% | 25.00% | 25.00% | 25.00% | 25.00% | 25.00% | 25.00% | 25.00% | 25.00% | 25.00% | |
| Other | 0 | 0 | 0 | 0 | 0 | 0 | 0 | 0 | 0 | 0 | 0 | 0 | |
| Pro Forma Profit and Loss | |||||||||||||
| Oct | Nov | Dec | Jan | Feb | Mar | Apr | May | Jun | Jul | Aug | Sep | ||
| Sales | $69,525 | $99,100 | $125,175 | $146,450 | $164,425 | $188,600 | $201,650 | $214,600 | $222,150 | $242,400 | $264,400 | $278,900 | |
| Direct Cost of Sales | $29,200 | $44,595 | $52,573 | $65,902 | $75,635 | $90,528 | $96,792 | $92,278 | $95,524 | $104,232 | $111,048 | $117,138 | |
| Other | $0 | $0 | $0 | $0 | $0 | $0 | $0 | $0 | $0 | $0 | $0 | $0 | |
| Total Cost of Sales | $29,200 | $44,595 | $52,573 | $65,902 | $75,635 | $90,528 | $96,792 | $92,278 | $95,524 | $104,232 | $111,048 | $117,138 | |
| Gross Margin | $40,325 | $54,505 | $72,602 | $80,548 | $88,790 | $98,072 | $104,858 | $122,322 | $126,626 | $138,168 | $153,352 | $161,762 | |
| Gross Margin % | 58.00% | 55.00% | 58.00% | 55.00% | 54.00% | 52.00% | 52.00% | 57.00% | 57.00% | 57.00% | 58.00% | 58.00% | |
| Expenses | |||||||||||||
| Payroll | $13,282 | $13,282 | $13,282 | $15,760 | $18,920 | $18,920 | $18,920 | $19,500 | $19,500 | $19,500 | $21,580 | $36,580 | |
| Sales and Marketing and Other Expenses | $1,400 | $1,400 | $2,000 | $2,500 | $4,000 | $1,500 | $2,000 | $1,500 | $27,000 | $27,500 | $27,000 | $7,000 | |
| Depreciation | $3,000 | $3,000 | $3,000 | $3,000 | $3,000 | $3,000 | $3,000 | $3,000 | $3,000 | $3,000 | $3,000 | $3,000 | |
| Leased Equipment | $931 | $931 | $931 | $931 | $931 | $931 | $931 | $931 | $931 | $931 | $931 | $931 | |
| Utilities | $1,000 | $1,000 | $1,000 | $1,000 | $1,000 | $1,000 | $1,000 | $1,000 | $1,000 | $1,000 | $1,000 | $1,000 | |
| Insurance | $285 | $285 | $285 | $285 | $285 | $285 | $285 | $310 | $310 | $310 | $310 | $310 | |
| Rent | $2,450 | $2,450 | $2,450 | $2,450 | $2,450 | $2,450 | $2,450 | $2,450 | $2,450 | $2,450 | $2,450 | $2,450 | |
| Payroll Taxes | 15% | $1,992 | $1,992 | $1,992 | $2,364 | $2,838 | $2,838 | $2,838 | $2,925 | $2,925 | $2,925 | $3,237 | $5,487 |
| Other | $0 | $0 | $0 | $0 | $0 | $0 | $0 | $0 | $0 | $0 | $0 | $0 | |
| Total Operating Expenses | $24,340 | $24,340 | $24,940 | $28,290 | $33,424 | $30,924 | $31,424 | $31,616 | $57,116 | $57,616 | $59,508 | $56,758 | |
| Profit Before Interest and Taxes | $15,985 | $30,165 | $47,662 | $52,258 | $55,366 | $67,148 | $73,434 | $90,706 | $69,510 | $80,552 | $93,844 | $105,004 | |
| EBITDA | $18,985 | $33,165 | $50,662 | $55,258 | $58,366 | $70,148 | $76,434 | $93,706 | $72,510 | $83,552 | $96,844 | $108,004 | |
| Interest Expense | $2,785 | $2,805 | $2,825 | $2,845 | $2,865 | $2,885 | $2,905 | $2,925 | $2,945 | $2,965 | $2,985 | $3,005 | |
| Taxes Incurred | $3,300 | $6,840 | $11,209 | $12,353 | $13,125 | $16,066 | $17,632 | $21,945 | $16,641 | $19,397 | $22,715 | $25,500 | |
| Net Profit | $9,900 | $20,520 | $33,627 | $37,060 | $39,376 | $48,197 | $52,897 | $65,836 | $49,924 | $58,190 | $68,144 | $76,500 | |
| Net Profit/Sales | 14.24% | 20.71% | 26.86% | 25.31% | 23.95% | 25.56% | 26.23% | 30.68% | 22.47% | 24.01% | 25.77% | 27.43% | |
| Pro Forma Cash Flow | |||||||||||||
| Oct | Nov | Dec | Jan | Feb | Mar | Apr | May | Jun | Jul | Aug | Sep | ||
| Cash Received | |||||||||||||
| Cash from Operations | |||||||||||||
| Cash Sales | $6,953 | $9,910 | $12,518 | $14,645 | $16,443 | $18,860 | $20,165 | $21,460 | $22,215 | $24,240 | $26,440 | $27,890 | |
| Cash from Receivables | $7,750 | $9,836 | $63,460 | $89,972 | $113,296 | $132,344 | $148,708 | $170,132 | $181,874 | $193,367 | $200,543 | $218,820 | |
| Subtotal Cash from Operations | $14,703 | $19,746 | $75,977 | $104,617 | $129,738 | $151,204 | $168,873 | $191,592 | $204,089 | $217,607 | $226,983 | $246,710 | |
| Additional Cash Received | |||||||||||||
| Sales Tax, VAT, HST/GST Received | 0.00% | $0 | $0 | $0 | $0 | $0 | $0 | $0 | $0 | $0 | $0 | $0 | $0 |
| New Current Borrowing | $0 | $0 | $0 | $0 | $0 | $0 | $0 | $0 | $0 | $0 | $0 | $0 | |
| New Other Liabilities (interest-free) | $3,000 | $2,500 | $2,000 | $0 | $0 | $0 | $0 | $0 | $0 | $0 | $0 | $0 | |
| New Long-term Liabilities | $5,000 | $5,000 | $5,000 | $5,000 | $5,000 | $5,000 | $5,000 | $5,000 | $5,000 | $5,000 | $5,000 | $5,000 | |
| Sales of Other Current Assets | $0 | $0 | $0 | $0 | $0 | $0 | $0 | $0 | $0 | $0 | $0 | $0 | |
| Sales of Long-term Assets | $0 | $0 | $0 | $0 | $0 | $0 | $0 | $0 | $0 | $0 | $0 | $0 | |
| New Investment Received | $75,000 | $0 | $0 | $300,000 | $0 | $0 | $0 | $500,000 | $0 | $0 | $0 | $0 | |
| Subtotal Cash Received | $97,703 | $27,246 | $82,977 | $409,617 | $134,738 | $156,204 | $173,873 | $696,592 | $209,089 | $222,607 | $231,983 | $251,710 | |
| Expenditures | Oct | Nov | Dec | Jan | Feb | Mar | Apr | May | Jun | Jul | Aug | Sep | |
| Expenditures from Operations | |||||||||||||
| Cash Spending | $13,282 | $13,282 | $13,282 | $15,760 | $18,920 | $18,920 | $18,920 | $19,500 | $19,500 | $19,500 | $21,580 | $36,580 | |
| Bill Payments | $28,399 | $57,345 | $79,393 | $84,750 | $105,577 | $114,537 | $134,827 | $133,309 | $122,365 | $153,896 | $171,551 | $178,851 | |
| Subtotal Spent on Operations | $41,681 | $70,627 | $92,675 | $100,510 | $124,497 | $133,457 | $153,747 | $152,809 | $141,865 | $173,396 | $193,131 | $215,431 | |
| Additional Cash Spent | |||||||||||||
| Sales Tax, VAT, HST/GST Paid Out | $0 | $0 | $0 | $0 | $0 | $0 | $0 | $0 | $0 | $0 | $0 | $0 | |
| Principal Repayment of Current Borrowing | $607 | $607 | $607 | $607 | $607 | $607 | $607 | $607 | $607 | $607 | $607 | $614 | |
| Other Liabilities Principal Repayment | $0 | $0 | $0 | $1,000 | $1,000 | $1,000 | $1,000 | $1,000 | $1,000 | $1,000 | $1,000 | $1,000 | |
| Long-term Liabilities Principal Repayment | $2,000 | $2,000 | $2,000 | $2,000 | $2,000 | $2,000 | $2,000 | $2,000 | $2,000 | $2,000 | $2,000 | $2,000 | |
| Purchase Other Current Assets | $0 | $0 | $5,000 | $5,000 | $5,000 | $5,000 | $5,000 | $5,000 | $5,000 | $5,000 | $5,000 | $0 | |
| Purchase Long-term Assets | $0 | $0 | $0 | $10,000 | $10,000 | $10,000 | $10,000 | $10,000 | $0 | $0 | $0 | $0 | |
| Dividends | $0 | $0 | $0 | $0 | $0 | $0 | $0 | $0 | $0 | $0 | $0 | $0 | |
| Subtotal Cash Spent | $44,288 | $73,234 | $100,282 | $119,117 | $143,104 | $152,064 | $172,354 | $171,416 | $150,472 | $182,003 | $201,738 | $219,045 | |
| Net Cash Flow | $53,414 | ($45,988) | ($17,305) | $290,500 | ($8,366) | $4,141 | $1,519 | $525,175 | $58,616 | $40,603 | $30,244 | $32,665 | |
| Cash Balance | $65,414 | $19,426 | $2,121 | $292,621 | $284,256 | $288,396 | $289,915 | $815,090 | $873,706 | $914,309 | $944,554 | $977,218 | |
| Pro Forma Balance Sheet | |||||||||||||
| Oct | Nov | Dec | Jan | Feb | Mar | Apr | May | Jun | Jul | Aug | Sep | ||
| Assets | Starting Balances | ||||||||||||
| Current Assets | |||||||||||||
| Cash | $12,000 | $65,414 | $19,426 | $2,121 | $292,621 | $284,256 | $288,396 | $289,915 | $815,090 | $873,706 | $914,309 | $944,554 | $977,218 |
| Accounts Receivable | $15,500 | $70,323 | $149,677 | $198,875 | $240,707 | $275,394 | $312,790 | $345,567 | $368,576 | $386,637 | $411,431 | $448,848 | $481,038 |
| Inventory | $18,873 | $32,120 | $49,055 | $57,830 | $72,492 | $83,199 | $99,581 | $106,471 | $101,506 | $105,076 | $114,655 | $122,153 | $128,852 |
| Other Current Assets | $0 | $0 | $0 | $5,000 | $10,000 | $15,000 | $20,000 | $25,000 | $30,000 | $35,000 | $40,000 | $45,000 | $45,000 |
| Total Current Assets | $46,373 | $167,857 | $218,157 | $263,826 | $615,821 | $657,848 | $720,767 | $766,953 | $1,315,171 | $1,400,420 | $1,480,395 | $1,560,554 | $1,632,108 |
| Long-term Assets | |||||||||||||
| Long-term Assets | $149,118 | $149,118 | $149,118 | $149,118 | $159,118 | $169,118 | $179,118 | $189,118 | $199,118 | $199,118 | $199,118 | $199,118 | $199,118 |
| Accumulated Depreciation | $23,605 | $26,605 | $29,605 | $32,605 | $35,605 | $38,605 | $41,605 | $44,605 | $47,605 | $50,605 | $53,605 | $56,605 | $59,605 |
| Total Long-term Assets | $125,513 | $122,513 | $119,513 | $116,513 | $123,513 | $130,513 | $137,513 | $144,513 | $151,513 | $148,513 | $145,513 | $142,513 | $139,513 |
| Total Assets | $171,886 | $290,370 | $337,670 | $380,339 | $739,334 | $788,361 | $858,280 | $911,466 | $1,466,684 | $1,548,933 | $1,625,908 | $1,703,067 | $1,771,621 |
| Liabilities and Capital | Oct | Nov | Dec | Jan | Feb | Mar | Apr | May | Jun | Jul | Aug | Sep | |
| Current Liabilities | |||||||||||||
| Accounts Payable | $26,513 | $54,704 | $76,592 | $81,240 | $101,782 | $110,041 | $130,370 | $129,266 | $117,255 | $148,187 | $165,579 | $173,201 | $163,869 |
| Current Borrowing | $7,291 | $6,684 | $6,077 | $5,470 | $4,863 | $4,256 | $3,649 | $3,042 | $2,435 | $1,828 | $1,221 | $614 | $0 |
| Other Current Liabilities | $43,503 | $46,503 | $49,003 | $51,003 | $50,003 | $49,003 | $48,003 | $47,003 | $46,003 | $45,003 | $44,003 | $43,003 | $42,003 |
| Subtotal Current Liabilities | $77,307 | $107,891 | $131,672 | $137,713 | $156,648 | $163,300 | $182,022 | $179,311 | $165,693 | $195,018 | $210,803 | $216,818 | $205,872 |
| Long-term Liabilities | $324,550 | $327,550 | $330,550 | $333,550 | $336,550 | $339,550 | $342,550 | $345,550 | $348,550 | $351,550 | $354,550 | $357,550 | $360,550 |
| Total Liabilities | $401,857 | $435,441 | $462,222 | $471,263 | $493,198 | $502,850 | $524,572 | $524,861 | $514,243 | $546,568 | $565,353 | $574,368 | $566,422 |
| Paid-in Capital | $814,820 | $889,820 | $889,820 | $889,820 | $1,189,820 | $1,189,820 | $1,189,820 | $1,189,820 | $1,689,820 | $1,689,820 | $1,689,820 | $1,689,820 | $1,689,820 |
| Retained Earnings | ($877,599) | ($1,044,791) | ($1,044,791) | ($1,044,791) | ($1,044,791) | ($1,044,791) | ($1,044,791) | ($1,044,791) | ($1,044,791) | ($1,044,791) | ($1,044,791) | ($1,044,791) | ($1,044,791) |
| Earnings | ($167,192) | $9,900 | $30,419 | $64,047 | $101,106 | $140,482 | $188,679 | $241,576 | $307,412 | $357,336 | $415,526 | $483,671 | $560,170 |
| Total Capital | ($229,971) | ($145,071) | ($124,552) | ($90,924) | $246,135 | $285,511 | $333,708 | $386,605 | $952,441 | $1,002,365 | $1,060,555 | $1,128,700 | $1,205,199 |
| Total Liabilities and Capital | $171,886 | $290,370 | $337,670 | $380,339 | $739,334 | $788,361 | $858,280 | $911,466 | $1,466,684 | $1,548,933 | $1,625,908 | $1,703,067 | $1,771,621 |
| Net Worth | ($229,971) | ($145,071) | ($124,552) | ($90,924) | $246,135 | $285,511 | $333,708 | $386,605 | $952,441 | $1,002,365 | $1,060,555 | $1,128,700 | $1,205,199 |


