
Sumptuous Cuisine Catering
Executive Summary
Sumptuous Cuisine Catering is a local catering company serving both business and private clients in Doeuvreville and the surrounding towns within a ten mile radius. Established in 2005, the business has operated a catering kitchen and specialized in full-service catering and event planning for upscale events in the region. The business event management, event staff, a variety of cuisine for breakfasts, lunches, dinners, and appetizers, alcoholic and non-alcoholic beverage service, floral design, space design and decor, musicians and DJs, event equipment and furniture rentals, and other event services. Sumptuous Cuisine Catering seeks to expand its operations to a dedicated venue, called The Sumptuous Ballroom, located in Doeuvreville, with a mortgage on the space, its own cash reserves and the issuing of a convertible debt to angel investors.
The addition of The Sumptuous Ballroom to the services provided by Sumptuous Cuisine Catering will enable gross margins to rise above their previous levels and industry averages as rentals of space provide high gross margins. Both existing and new clients will be interested in using this space, and in the additional services Sumptuous Cuisine Catering provides. Top line sales will grow from their current level in 2009 to more than double in 2012. Net profits will rise three-fold from 2010 to 2012 after this acquisition, even with the expected increases in operating expenses. Sumptuous Cuisine Catering will seek to utilize the space on at least 40% of days by the end of year 3 to achieve these results.

Objectives
Sumptuous Cuisine Catering has set the following objectives for the first three years of the launch of its ballroom:
- Renovate and upgrade the interior of the ballroom
- Hire and retain a facilities manager to run the logistics of the new space
- Produce a positive return on investment for the ballroom acquisition by the end of the second year
- Utilize the ballroom on 40% of days by the end of the third year
Mission
Sumptuous Cuisine Catering offers top-class event experiences with flawless execution to business and private clients in the Doeuvreville area. With Sumptuous Cuisine Catering running your event, the food will be delicious, the service will be excellent and the guests will be wowed.
Keys to Success
Keys to success in the catering and event business include:
- Managing and exceeding client expectations
- Balancing expert opinions and advice with care for the client’s preferences and vision
- Exhibiting a sense of professional showmanship on the day of the event – the show must go on
- Protecting the client’s interests and liability even when it requires unpopular decisions
Sumptuous Cuisine Catering keeps these keys in mind through all events they have managed and catered in the past and will renew their efforts as they open their own catering venue.
Company Summary
Sumptuous Cuisine Catering is a local catering company serving both business and private clients in Doeuvreville and the surrounding towns within a ten mile radius. Established in 2005, the business has operated a catering kitchen and specialized in full-service catering and event planning for upscale events in the region both at client sites and at event spaces and halls. The business became the in-house caterer at Corporate Hall, a corporate meeting space, in Doeuvreville in 2008, and has developed expertise related to managing client events and event planning. For most events, Sumptuous Cuisine Catering provides referrals to additional vendors, manages client rental equipment needs, and provides event management expertise on the day of the event.
Company Ownership
Sumptuous Cuisine Catering was founded by partners Rudy Electrum and Tosca Cabrini. Built from the ground up by these partners, Rudy owns 49% of the business and Tosca 51%. The business is established as an LLC.
10% of shares will be given to angel investors who purchase $270,000 in convertible debt to help to finance the expansion of Sumptuous Cuisine Catering. This will dilute Electrum’s shares to 44% and Cabrini’s shares to 46%.
Company History
Over the past three years, Sumptuous Cuisine Catering has made significant advances, developing its core business significantly after somewhat slow growth for its first two years of operation. Gross and operating margins have steadily improved and the business has continued to invest in kitchen and delivery equipment, as well as some of its own event furniture.
Sales have grown due to increasing partnerships with venues, like Corporate Hall, and event planners, like Jackie Lyman Associates and Your Perfect Event LLC which refer clients and subcontract work to Sumptuous Cuisine Catering. These referrals and partnerships have accounted for 75% of growth in the past three years. Corporate Hall alone accounted for 15% of sales in 2009. The remaining growth has been due to new client acquisition through marketing and referrals to clients directly.
Inventory has historically included raw materials for food as well as beverages and liquor. These have been accounted for as inventory and attributed to cost of sales for each job. Cost of sales has also included hourly wages to cater-waiters, event managers and other event staff, fuel for delivery, and supplies for the event (paper napkins, etc). Cost of sales also includes vendor subcontractors who the client pays through Sumptuous Cuisine Catering (generally rental equipment, florists, designers and musicians/DJs). Sumptuous Cuisine Catering lets clients contract directly when they prefer and recommends they contract directly with audio-visual and lighting providers.
Operating expenses have dropped from 45% of sales to 40% of sales over these previous three years, while they have grown by $150,000 in absolute value.

| Past Performance | |||
| 2007 | 2008 | 2009 | |
| Sales | $1,000,000 | $1,300,000 | $1,500,000 |
| Gross Margin | $550,000 | $741,000 | $885,000 |
| Gross Margin % | 55.00% | 57.00% | 59.00% |
| Operating Expenses | $450,000 | $552,500 | $600,000 |
| Collection Period (days) | 51 | 58 | 78 |
| Inventory Turnover | 32.14 | 38.55 | 39.68 |
| Balance Sheet | |||
| 2007 | 2008 | 2009 | |
| Current Assets | |||
| Cash | $150,000 | $200,000 | $300,000 |
| Accounts Receivable | $41,667 | $83,333 | $108,333 |
| Inventory | $14,000 | $15,000 | $16,000 |
| Other Current Assets | $2,500 | $2,500 | $2,500 |
| Total Current Assets | $208,167 | $300,833 | $426,833 |
| Long-term Assets | |||
| Long-term Assets | $75,000 | $85,000 | $90,000 |
| Accumulated Depreciation | $20,000 | $27,500 | $40,000 |
| Total Long-term Assets | $55,000 | $57,500 | $50,000 |
| Total Assets | $263,167 | $358,333 | $476,833 |
| Current Liabilities | |||
| Accounts Payable | $37,500 | $46,042 | $50,000 |
| Current Borrowing | $0 | $0 | $0 |
| Other Current Liabilities (interest free) | $0 | $0 | $0 |
| Total Current Liabilities | $37,500 | $46,042 | $50,000 |
| Long-term Liabilities | $5,000 | $2,500 | $0 |
| Total Liabilities | $42,500 | $48,542 | $50,000 |
| Paid-in Capital | $200,000 | $200,000 | $200,000 |
| Retained Earnings | $667 | $59,792 | $151,833 |
| Earnings | $20,000 | $50,000 | $75,000 |
| Total Capital | $220,667 | $309,792 | $426,833 |
| Total Capital and Liabilities | $263,167 | $358,333 | $476,833 |
| Other Inputs | |||
| Payment Days | 30 | 30 | 30 |
| Sales on Credit | $300,000 | $390,000 | $450,000 |
| Receivables Turnover | 7.20 | 4.68 | 4.15 |
Products and Services
Sumptuous Cuisine Catering currently offers the following products and services:
- Event management
- Coat-check, door check, and restroom attendants
- A variety of cuisine for breakfasts, lunches, dinners, and appetizers
- Non-alcoholic, wine, beer, and liquor beverage service
- Wait service
Through subcontractors, Sumptuous Cuisine Catering offers:
- Floral design
- Space design and decor
- Musicians and DJs
- Event equipment and furniture rentals
- Cakes
Through referrals, Sumptuous Cuisine Catering offers:
- Lighting
- Audio-visual rentals and support
- Event security
- Valet service
Future plans include the following additions with the opening of The Sumptuous Ballroom:
- Ballroom rentals for half-day or full-day timespans
- Space rental with a per-head full-service catering fee or as a fee separate from catering and beverage
- Facility management service
Market Analysis Summary
The catering industry serves private, corporate, and non-profit events with food, drinks, event management and other services. Events are generally held by clients in order to celebrate, communicate, or both.
- Celebration: Parties and banquets as part of key events in life (birthdays, weddings, bar and bat mitzvahs, engagements, bridal and baby showers, retirement parties, etc.) or for a business (holiday or end-of-year parties, retirements, honoree galas, etc.)
- Communication: Events to communicate a message for the benefit of attendees or the press (product launches, press events, trade shows, conferences, presentations, lectures, fundraisers) or to stimulate discussion (corporate meetings, summits, etc.)
The U.S. market for caterers was estimated at $6.9 billion in 2008 by IBISWorld. The market is prone to economic cycles, as events, especially corporate events, are one of the first expenses cut during a downturn. Celebratory events may be scaled back a bit, but are generally not canceled during a downturn (i.e., spending on weddings, bar mitzvahs, etc., continues). The industry contracted by 1.5% in 2008 due the economic downturn and a similar decline is apparent for 2009. In 2010 the industry is expected to return to positive growth. The industry is relatively mature, as 33,000 catering companies serve the U.S., or one company for every 9,000 Americans.

There is a movement towards horizontal integration in the greater event industry, with some full-service event providers growing to provide entertainment, audio-visual and technology, catering, rentals, decor, venues and more. Businesses that provide these additional services may take on assets that are not as fully utilized as a specialist’s would be, but they can earn greater margins on the sales they make. With its opening of The Sumptuous Ballroom, Sumptuous Cuisine Catering will become part of this integration movement.
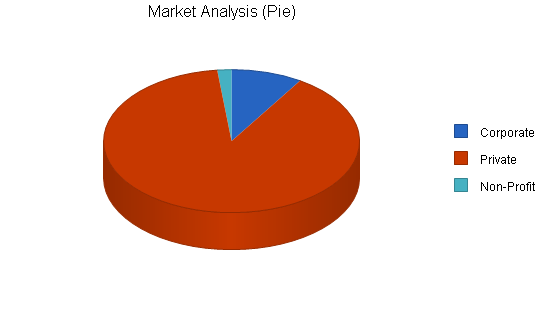
Market Segmentation
The market analysis chart is provided for the Doeuvreville area in a radius of ten miles.
The corporate market is defined as businesses which hold at least one off-site event each year. Businesses often have A/V and public relations needs in concert with their events which may serve a marketing function for the business. Whether entertaining the press, clients, or board members, businesses require professional execution, delicious food and drinks, and alignment between the event managers/caterers and their business’s objectives for the event.
The private market includes households with a combined household income of over $80,000 per year (those most likely to throw an upscale event in a rented venue). This group puts a great deal of pressure on caterers and requires added attention, as lavish events may be uncommon for them. They require hands-on work and planning as well as expert advice and referrals throughout the process.
The non-profit market is defined as non-profit organizations which hold at least one off-site event each year. Very price conscious, the non-profit market looks for in-kind donations and discounted services whenever possible. Some non-profits realize the benefit of paying for great events which lead, in kind, to improved perception of the organization and donations, while others will take the lowest price available at the minimal quality level acceptable.
| Market Analysis | |||||||
| 2010 | 2011 | 2012 | 2013 | 2014 | |||
| Potential Customers | Growth | CAGR | |||||
| Corporate | 1% | 2,500 | 2,525 | 2,550 | 2,576 | 2,602 | 1.00% |
| Private | 2% | 25,000 | 25,500 | 26,010 | 26,530 | 27,061 | 2.00% |
| Non-Profit | 1% | 500 | 505 | 510 | 515 | 520 | 0.99% |
| Total | 1.89% | 28,000 | 28,530 | 29,070 | 29,621 | 30,183 | 1.89% |
Target Market Segment Strategy
Sumptuous Cuisine Catering has, traditionally, targeted the private and corporate markets primarily. They will continue this focus with the launch of The Sumptuous Ballroom. Private clients, although requiring additional labor and handholding, can be charged somewhat higher rates than corporate clients. Furthermore, they help to “recession-proof” the business by providing steadier revenue streams in economic downturns.
Corporate business can lead to repeat engagements with clients who have annual or even quarterly events and are more valuable as clients to acquire than private clients, even though the margin percentages are lower on each event.
Non-profit clients generally seek lower cost providers and venues and, while they do seek out Sumptuous Cuisine Catering without much marketing to that group, the company’s bids are generally does not accepted. Sumptuous Cuisine Catering will continue to choose specific non-profits to sponsor events for to create visibility for strategic purposes or based on the charitable interests of the owners, but will not market directly to non-profits.
Service Business Analysis
The catering industry is extremely fragmented, with 33,000 companies across the United States. Customers find caterers through referrals, online searches, Yellow Pages, and through businesses which run restaurants they are already familiar with. They will generally contact the catering company by phone to discuss the details of their events directly.
Some businesses and private clients hire event planners or producers to handle the details of their event, including choice of caterer. In this case, these firms, which are more familiar with the industry, may act as a buffer between the end client and the caterer, sometimes making the process of planning smoother.
Competition and Buying Patterns
Key competitors of Sumptuous Cuisine Catering include:
- Fancy Fetes: An upscale caterer which is the in-house caterer at the King’s Room, a Doeuvreville area private event space (weddings, bar mitzvahs, etc.)
- Food For Thought: An American cuisine caterer which provides simple drop-off service as well as full-service catering
- Pandora’s: An upscale Italian restaurant which caters a variety of events primarily for private clients
Doeuvreville area customers choose caterers for their events based on the following characteristics:
- Cuisine Options: Private clients will often seek out caterers who can offer, or specialize in, specific cuisine. Businesses looking to use a caterer multiple times are more likely to seek a caterer who can serve many different cuisine so they can vary the options from event to event (or even within a given event) to better please their clients or guests.
- Quality: Quality is determined through reviews and references as well as through tastings of the food. Basic quality is a must, but high-quality is sought out for once-in-a-lifetime private events and the fanciest of business functions.
- Added Services: Private clients and businesses/non-profits who are relatively new to event planning will prefer caterers who offer a wide range of event services (one-stop shops if possible) rather than working with half a dozen separate event vendors.
- Price: Especially for corporate and non-profit customers, price is a key factor. Businesses seek discounted rates for a higher volume of events, which private clients cannot provide.
Sumptuous Cuisine Catering offers a range of cuisine options, high quality, and added services based on the one-stop shop model. The business does not compete on price and offers services at prices higher than average for caterers in general and on the upper side of options for the Doeuvreville area.
Strategy and Implementation Summary
Sumptuous Cuisine Catering intends to open The Sumptuous Ballroom, an event venue in Doeuvreville. The ballroom will be purchased from the previous owner, the city of Doeuvreville, which used the space as a community center until it was abandoned one year ago. After renovations, the ballroom will create synergy with Sumptuous Cuisine Catering’s business by offering a location to bring in current and future clients who will also utilize both the catering and event planning services of Sumptuous Cuisine Catering.
Sumptuous Cuisine Catering will:
- Target high net-worth private clients and corporate clients
- Take on dedicated facility management and salespeople for The Sumptuous Ballroom
- Use a combination of existing and new marketing tactics to promote the space
Competitive Edge
Sumptuous Cuisine Catering will create a competitive edge in Doeuvreville by becoming a true “one-stop-shop” for all-inclusive events with the purchase of The Sumptuous Ballroom. Clients will not have to work with multiple vendors, but can work directly with their assigned Sumptuous Cuisine Catering account executive for all of their event planning and vendor coordination needs.
Currently, competitors in the Doeuvreville area do not offer the same combination of upscale catering, track record, flexibility of cuisine, and a beautiful venue which Sumptuous Cuisine Catering will be able to offer.
Marketing Strategy
Sumptuous Cuisine Catering will focus its marketing for their new ballroom on the corporate and private upscale event markets. The business will use the following media and tactics to reach this audience:
- Advertise in Doeuvreville Magazine, a local luxury-focused magazine with half-page color ads showing a photo of the new space
- Develop a website for The Sumptuous Ballroom which is separate from, but linked to, the Sumptuous Cuisine Catering site
- Promote the website through search engine optimization and search engine marketing around event and rental keywords for the local area
- Revise the Sumptuous Cuisine Catering brochure to include the new ballroom in a featured location
- Email campaign of an e-brochure announcing the new space to all past and current clients
- Create and send press kit with information and details on the new space to key clients and press
- Create a featured listing on BizBash.com, a website devoted to event resources and venues focused at the corporate market
- Promote introductory spring and summer rates to encourage early rentals (the normal rate of $2,500 will be discounted to $2,000 during this period)
- Promote the space at local summer business fair
- Sponsor 4 non-profit events per year, all chosen for the exposure they receive to the press and to high net worth individuals
Sales Strategy
Traditionally, the sales strategy of Sumptuous Cuisine Catering has been spearheaded by Rudy Electrum and two staff account managers who each handle a portfolio of clients. Rudy focuses on new business development and relies on the account managers to service, retain clients, and develop their business by encouraging them to use Sumptuous Cuisine Catering for more events.
This sales strategy will continue with the opening of The Sumptuous Ballroom. Rentals at the ballroom will be promoted by all staff when they work with clients. An additional salesperson will field inquiries made directly about The Sumptuous Ballroom rentals to handle the additional volume of work required to increase the utilization of this space. Salespeople will be added for The Sumptuous Ballroom over the first three years of its operations as business grows. These salespeople will have the same training and knowledge of all of Sumptuous Cuisine Catering’s services, but will work only with clients interested in events at the ballroom.
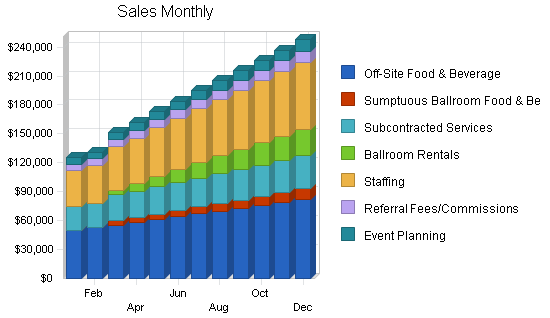
Sales Forecast
Renovation of The Sumptuous Ballroom will occur in the first three months of 2010, preparing for a March 15 opening of the space.
Off-site food and beverage has traditionally been the largest revenue stream for Sumptuous Cuisine Catering, as this is the driver behind all of the other revenue streams. Subcontracted services, staffing, referral fees, and event planning are only offered when there is a core food and beverage package sold for an event. The F & B for The Sumptuous Ballroom events has been separated out for separate tracking, going forward, as have venue rentals of The Sumptuous Ballroom.
A typical event is a $10,000 food and beverage package with $5,000 in subcontracted services, $8,000 in staffing, and $1,500 in event planning fees. Typical events at The Sumptuous Ballroom will also incur a ballroom rental of $2,500 as a base fee.
The F & B cost is low, at 25% of the combined off-site and The Sumptuous Ballroom F & B revenues. Ingredients are purchased in bulk whenever possible at wholesale rates. A high markup can be earned on food and an even higher markup on liquor, which can sometimes cost as little as 15% of sales.
The cost of hourly event staff (bartenders, waiters, coat check, door check, restroom attendants, event managers, etc.) is recognized on the P & L statement under other cost of sales.
The Sumptuous Ballroom revenues will scale up sharply in the first year as the space is better utilized, but this growth will level off in years 2 and 3 as not all event dates are as desirable to clients and the most popular dates will book first. This projection incorporates the objective that the ballroom be utilized on 50% of days by the end of year 3.
Sumptuous Cuisine Catering expects that the existing line of business events at Corporate Hall will continue even with the addition of its own space, The Sumptuous Ballroom, because Corporate Hall hosts primarily smaller meetings than can be accommodated at The Sumptuous Ballroom. Sumptuous Cuisine Catering considers the two spaces to not be in direct competition. The relationship with Corporate Hall will allow Sumptuous Cuisine Catering to refer smaller meetings to that space, perhaps helping to build business at Corporate Hall through new inquiries.

| Sales Forecast | |||
| 2010 | 2011 | 2012 | |
| Sales | |||
| Off-Site Food & Beverage | $784,537 | $941,444 | $1,129,733 |
| Sumptuous Ballroom Food & Beverage | $79,687 | $103,593 | $134,671 |
| Subcontracted Services | $354,801 | $425,761 | $510,913 |
| Ballroom Rentals | $168,750 | $236,250 | $307,125 |
| Staffing | $648,168 | $783,778 | $948,303 |
| Referral Fees/Commissions | $108,028 | $130,630 | $158,051 |
| Event Planning | $108,028 | $130,630 | $158,051 |
| Total Sales | $2,251,998 | $2,752,086 | $3,346,846 |
| Direct Cost of Sales | 2010 | 2011 | 2012 |
| Food and Beverage Cost | $216,056 | $261,259 | $316,101 |
| Other | $0 | $0 | $0 |
| Subtotal Direct Cost of Sales | $216,056 | $261,259 | $316,101 |
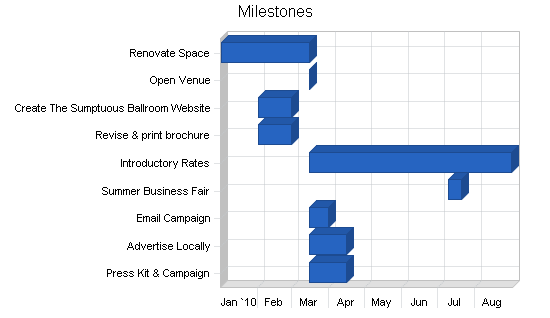
Milestones
The milestones listed are the key steps to launching The Sumptuous Ballroom.
Renovation of the space will be directed by CEO, Tosca Cabrini, with insight from all staff. The work will be directed by a renovations contractor who will subcontract work to electricians, plumbers, painters, floor specialists, etc
The other activities come under the marketing umbrella of Antero MacDougal, Sumptuous Cuisine Catering’s marketing director. The preparations will be made while the venue is being renovated, although finished photos of the new space will not be available until renovation is complete.
Introductory rates will reduce the rate of 100 events by $500 to encourage first-time rentals of the ballroom.
| Milestones | |||||
| Milestone | Start Date | End Date | Budget | Manager | Department |
| Renovate Space | 1/1/2010 | 3/15/2010 | $100,000 | TC | Operations |
| Open Venue | 3/15/2010 | 3/15/2010 | $0 | TC | Operations |
| Create The Sumptuous Ballroom Website | 2/1/2010 | 2/28/2010 | $10,000 | JR | Marketing |
| Revise & print brochure | 2/1/2010 | 2/28/2010 | $5,000 | JR | Marketing |
| Introductory Rates | 3/15/2010 | 8/31/2010 | $50,000 | JR | Marketing |
| Summer Business Fair | 7/9/2010 | 7/20/2010 | $5,000 | JR | Marketing |
| Email Campaign | 3/15/2010 | 3/31/2010 | $500 | JR | Marketing |
| Advertise Locally | 3/15/2010 | 4/15/2010 | $10,000 | JR | Marketing |
| Press Kit & Campaign | 3/15/2010 | 4/15/2010 | $2,000 | JR | Marketing |
| Totals | $182,500 | ||||
Management Summary
Sumptuous Cuisine Catering is directed by CEO Rudy Electrum. Second-in-command is COO Tosca Cabrini.
Electrum heads sales and strategy for the business, in close consultation with Cabrini. Cabrini manages the operations of the kitchen, human resources (hiring and training) and finances.
Marketing is directed and executed by Antero MacDougal. MacDougal is the liaison to outside graphic and Web designers and other marketing service firms used by Sumptuous Cuisine Catering. MacDougal reports to the CEO.
The Facility Manager will be hired to act as a manager of the hall. This will include providing information to vendors setting up in the space, providing access to the clients for set-up, light maintenance and repairs, contracting vendors for heavier repair work, and setting up cleanings of the space. The Facility Manager will have a small office at The Sumptuous Ballroom and will work during the daytime. Event managers from the catering staff will be present during the events. The Facility Manager will be trained by and report to the COO.
Personnel Plan
The personnel table shows full-time personnel only.
A full-time administrative assistant keeps the books for the business and process A/R and A/P.
Sales staff, beginning at one, are managed by the CEO. A salesperson will be added in year 2 and again in year 3. The new salespeople will be dedicated to sales of The Sumptuous Ballroom and will work on salary plus a 3% commission on sales.
The kitchen is staffed by a salaried head cook and one assistant cook paid by the hour.
Events are staffed by a roster of 30 event managers, cater-waiters, bartenders, and other staff. Most staff are cross-trained between the various roles.
| Personnel Plan | |||
| 2010 | 2011 | 2012 | |
| CEO | $84,000 | $87,360 | $90,854 |
| COO | $72,000 | $74,880 | $77,875 |
| Marketing Director | $60,000 | $62,400 | $64,896 |
| Salespeople | $48,000 | $97,440 | $149,083 |
| Administrative Assistant | $48,000 | $49,920 | $51,917 |
| Head Cook | $60,000 | $62,400 | $64,896 |
| Assistant Cooks | $48,000 | $49,920 | $51,917 |
| Facility Manager | $54,000 | $56,160 | $58,406 |
| Total People | 8 | 9 | 10 |
| Total Payroll | $474,000 | $540,480 | $609,845 |
Financial Plan
Sumptuous Cuisine Catering will fund its expansion largely though its own cash reserves and a loan for the purchase of The Sumptuous Ballroom.
The funds needed include:
- $2 million for purchase of The Sumptuous Ballroom
- $100,000 for improvements
- $50,000 for equipment for the ballroom
- $82,500 for marketing devoted to The Sumptuous Ballroom acquisition
Sources for the funds include:
- $1.6 million mortgage
- $270,000 in convertible debt from investors for an equity stake of 10% in Sumptuous Cuisine Catering (diluting the current ownership equally) and 10% interest paid over three years. Likely investors include family and angel investors interested in lower risk than in a start-up firm, along with some guaranteed returns
- $300,000 in cash reserves of Sumptuous Cuisine Catering
- Cash flow surpluses in the later half of 2010 to make up the remainder
The business will return to stronger profits and gross margins after the acquisition.
Important Assumptions
The table below presents the assumptions used in the financial calculations of this business plan.
Break-even Analysis
Due to the high fixed costs of the venue, the monthly break even is rather high, as shown below. This would be approximately 9-10 events at $10,000 per event. Revenue is higher for The Sumptuous Ballroom events due to the ballroom rental fee and greater leverage to provide additional services to clients, than for revenue from off-site events.

| Break-even Analysis | |
| Monthly Revenue Break-even | $93,206 |
| Assumptions: | |
| Average Percent Variable Cost | 10% |
| Estimated Monthly Fixed Cost | $84,264 |
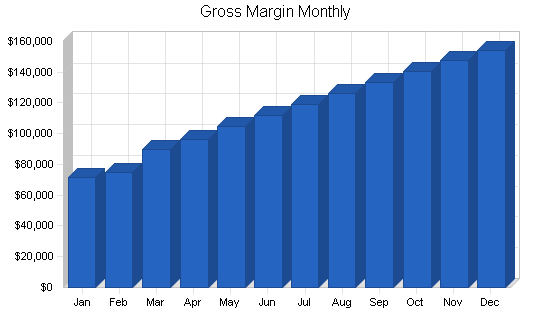
Projected Profit and Loss
Gross margins will improve for the business as ballroom rentals build as a revenue stream. Facility rentals do not have a direct cost of sales, although higher fixed costs are associated with The Sumptuous Ballroom than with the core business.
Subcontracted services are the other major cost of sales category, and incur a higher cost of sales, at 80% of subcontracted services sold, than other categories. These services (like floral design, rental furniture, etc.) are discounted by the vendors because of their relationship with Sumptuous Cuisine Catering. The effect is that Sumptuous Cuisine Catering bills these services on to clients at the vendor’s advertised rates and takes their margin of 20% on those revenues.
Marketing will be higher in the first year to accommodate the additional marketing activities described in the marketing strategy and milestones table. Depreciation will be for the existing equipment in the catering kitchen and for the installed sound and networking equipment in the venue.
Rent is for the catering kitchen and office only, as the ballroom will be purchased by the business. Utilities will be much higher than previously due to the high electric, heating, and air conditioning costs of the new space compared with the kitchen and office alone. Insurance also must increase significantly from previous levels due to the need for general liability for the space and guests.
Payroll taxes are 15% of payroll (which includes the event staff cost of sales) and employee benefits (including health insurance, 401K contributions for employees who with tenure over 2 years, vacation and sick pay) are 10% of payroll and event staff costs.
Office expenses cover maintenance of computer equipment and sundry supplies for the office. Facility cleaning and maintenance includes a budget for $200 of maintenance and an estimate for cleaning which will grow as use of the ballroom scales up. Cleaning will be provided by an outside vendor and managed by the Facility Manager.


| Pro Forma Profit and Loss | |||
| 2010 | 2011 | 2012 | |
| Sales | $2,251,998 | $2,752,086 | $3,346,846 |
| Direct Cost of Sales | $216,056 | $261,259 | $316,101 |
| Event Staff | $382,840 | $467,855 | $568,964 |
| Subcontracted Services | $283,841 | $340,609 | $408,730 |
| Total Cost of Sales | $882,736 | $1,069,723 | $1,293,795 |
| Gross Margin | $1,369,262 | $1,682,363 | $2,053,051 |
| Gross Margin % | 60.80% | 61.13% | 61.34% |
| Expenses | |||
| Payroll | $474,000 | $540,480 | $609,845 |
| Marketing/Promotion | $106,000 | $100,000 | $100,000 |
| Depreciation | $28,000 | $28,000 | $28,000 |
| Rent | $24,000 | $25,200 | $26,460 |
| Utilities | $7,959 | $9,000 | $10,000 |
| Insurance | $36,000 | $37,440 | $38,938 |
| Payroll Taxes | $128,526 | $151,250 | $176,821 |
| Employee Benefits | $85,684 | $100,833 | $117,881 |
| Office Expenses | $6,000 | $6,500 | $7,000 |
| Facility Cleaning & Maintenance | $115,000 | $137,804 | $167,542 |
| Total Operating Expenses | $1,011,168 | $1,136,508 | $1,282,487 |
| Profit Before Interest and Taxes | $358,094 | $545,855 | $770,564 |
| EBITDA | $386,094 | $573,855 | $798,564 |
| Interest Expense | $181,222 | $171,000 | $160,333 |
| Taxes Incurred | $53,061 | $112,457 | $183,069 |
| Net Profit | $123,810 | $262,399 | $427,162 |
| Net Profit/Sales | 5.50% | 9.53% | 12.76% |
Projected Cash Flow
The projected cash flow table and chart show the business’s investment in The Sumptuous Ballroom, a $2 million purchase. The asset will be purchased with 20% down and a $1.6 million 15-year mortgage. An additional $270,000 in convertible debt will be raised at 10% interest for three years.
In addition to this investment, $50,000 in depreciable assets will be purchased (sound system, office set-up for the facility). Small investments in replacing these assets and augmenting them with strategic purchases will be made in future years. Current assets ($100,000) purchased will include signage and improvements to the venue.
The business will reach cash flow break-even in July 2010.

| Pro Forma Cash Flow | |||
| 2010 | 2011 | 2012 | |
| Cash Received | |||
| Cash from Operations | |||
| Cash Sales | $1,125,999 | $1,376,043 | $1,673,423 |
| Cash from Receivables | $1,055,339 | $1,336,295 | $1,626,150 |
| Subtotal Cash from Operations | $2,181,338 | $2,712,337 | $3,299,573 |
| Additional Cash Received | |||
| Sales Tax, VAT, HST/GST Received | $180,160 | $220,167 | $267,748 |
| New Current Borrowing | $0 | $0 | $0 |
| New Other Liabilities (interest-free) | $0 | $0 | $0 |
| New Long-term Liabilities | $1,870,000 | $0 | $0 |
| Sales of Other Current Assets | $0 | $0 | $0 |
| Sales of Long-term Assets | $0 | $0 | $0 |
| New Investment Received | $0 | $0 | $0 |
| Subtotal Cash Received | $4,231,498 | $2,932,504 | $3,567,321 |
| Expenditures | 2010 | 2011 | 2012 |
| Expenditures from Operations | |||
| Cash Spending | $474,000 | $540,480 | $609,845 |
| Bill Payments | $1,508,109 | $1,928,419 | $2,254,866 |
| Subtotal Spent on Operations | $1,982,109 | $2,468,899 | $2,864,711 |
| Additional Cash Spent | |||
| Sales Tax, VAT, HST/GST Paid Out | $180,160 | $220,167 | $267,748 |
| Principal Repayment of Current Borrowing | $0 | $0 | $0 |
| Other Liabilities Principal Repayment | $0 | $0 | $0 |
| Long-term Liabilities Principal Repayment | $106,668 | $106,668 | $106,668 |
| Purchase Other Current Assets | $100,000 | $0 | $0 |
| Purchase Long-term Assets | $2,050,000 | $5,000 | $5,000 |
| Dividends | $0 | $0 | $0 |
| Subtotal Cash Spent | $4,418,937 | $2,800,734 | $3,244,127 |
| Net Cash Flow | ($187,439) | $131,771 | $323,194 |
| Cash Balance | $112,561 | $244,331 | $567,526 |
Projected Balance Sheet
The balance sheet shows the increasing strength of the business as its mortgage is paid off and profits are earned from the expansion of the business. Accounts payable will rise significantly from previous levels due to the added expenses taken on by the business when The Sumptuous Ballroom opens.
| Pro Forma Balance Sheet | |||
| 2010 | 2011 | 2012 | |
| Assets | |||
| Current Assets | |||
| Cash | $112,561 | $244,331 | $567,526 |
| Accounts Receivable | $178,994 | $218,742 | $266,015 |
| Inventory | $11,664 | $13,163 | $15,936 |
| Other Current Assets | $102,500 | $102,500 | $102,500 |
| Total Current Assets | $405,719 | $578,737 | $951,976 |
| Long-term Assets | |||
| Long-term Assets | $2,140,000 | $2,145,000 | $2,150,000 |
| Accumulated Depreciation | $68,000 | $96,000 | $124,000 |
| Total Long-term Assets | $2,072,000 | $2,049,000 | $2,026,000 |
| Total Assets | $2,477,719 | $2,627,737 | $2,977,976 |
| Liabilities and Capital | 2010 | 2011 | 2012 |
| Current Liabilities | |||
| Accounts Payable | $163,743 | $158,031 | $187,776 |
| Current Borrowing | $0 | $0 | $0 |
| Other Current Liabilities | $0 | $0 | $0 |
| Subtotal Current Liabilities | $163,743 | $158,031 | $187,776 |
| Long-term Liabilities | $1,763,332 | $1,656,664 | $1,549,996 |
| Total Liabilities | $1,927,075 | $1,814,695 | $1,737,772 |
| Paid-in Capital | $200,000 | $200,000 | $200,000 |
| Retained Earnings | $226,833 | $350,643 | $613,042 |
| Earnings | $123,810 | $262,399 | $427,162 |
| Total Capital | $550,643 | $813,042 | $1,240,204 |
| Total Liabilities and Capital | $2,477,719 | $2,627,737 | $2,977,976 |
| Net Worth | $550,643 | $813,042 | $1,240,204 |
Business Ratios
The table compares the business ratios of Sumptuous Cuisine Catering to caterers in the $1 million to $5 million revenue category. Caterers with banquet halls are covered by NAICS industry code 722320, or SIC code 5812.
| Ratio Analysis | ||||
| 2010 | 2011 | 2012 | Industry Profile | |
| Sales Growth | 50.13% | 22.21% | 21.61% | 1.65% |
| Percent of Total Assets | ||||
| Accounts Receivable | 7.22% | 8.32% | 8.93% | 3.53% |
| Inventory | 0.47% | 0.50% | 0.54% | 6.34% |
| Other Current Assets | 4.14% | 3.90% | 3.44% | 43.25% |
| Total Current Assets | 16.37% | 22.02% | 31.97% | 53.12% |
| Long-term Assets | 83.63% | 77.98% | 68.03% | 46.88% |
| Total Assets | 100.00% | 100.00% | 100.00% | 100.00% |
| Current Liabilities | 6.61% | 6.01% | 6.31% | 25.40% |
| Long-term Liabilities | 71.17% | 63.05% | 52.05% | 73.91% |
| Total Liabilities | 77.78% | 69.06% | 58.35% | 99.31% |
| Net Worth | 22.22% | 30.94% | 41.65% | 0.69% |
| Percent of Sales | ||||
| Sales | 100.00% | 100.00% | 100.00% | 100.00% |
| Gross Margin | 60.80% | 61.13% | 61.34% | 58.06% |
| Selling, General & Administrative Expenses | 55.30% | 51.60% | 48.58% | 23.02% |
| Advertising Expenses | 4.71% | 3.63% | 2.99% | 1.74% |
| Profit Before Interest and Taxes | 15.90% | 19.83% | 23.02% | 6.52% |
| Main Ratios | ||||
| Current | 2.48 | 3.66 | 5.07 | 1.25 |
| Quick | 2.41 | 3.58 | 4.98 | 1.00 |
| Total Debt to Total Assets | 77.78% | 69.06% | 58.35% | 99.31% |
| Pre-tax Return on Net Worth | 32.12% | 46.11% | 49.20% | 4325.19% |
| Pre-tax Return on Assets | 7.14% | 14.27% | 20.49% | 29.65% |
| Additional Ratios | 2010 | 2011 | 2012 | |
| Net Profit Margin | 5.50% | 9.53% | 12.76% | n.a |
| Return on Equity | 22.48% | 32.27% | 34.44% | n.a |
| Activity Ratios | ||||
| Accounts Receivable Turnover | 6.29 | 6.29 | 6.29 | n.a |
| Collection Days | 44 | 53 | 53 | n.a |
| Inventory Turnover | 24.00 | 21.05 | 21.73 | n.a |
| Accounts Payable Turnover | 9.90 | 12.17 | 12.17 | n.a |
| Payment Days | 28 | 31 | 28 | n.a |
| Total Asset Turnover | 0.91 | 1.05 | 1.12 | n.a |
| Debt Ratios | ||||
| Debt to Net Worth | 3.50 | 2.23 | 1.40 | n.a |
| Current Liab. to Liab. | 0.08 | 0.09 | 0.11 | n.a |
| Liquidity Ratios | ||||
| Net Working Capital | $241,975 | $420,706 | $764,200 | n.a |
| Interest Coverage | 1.98 | 3.19 | 4.81 | n.a |
| Additional Ratios | ||||
| Assets to Sales | 1.10 | 0.95 | 0.89 | n.a |
| Current Debt/Total Assets | 7% | 6% | 6% | n.a |
| Acid Test | 1.31 | 2.19 | 3.57 | n.a |
| Sales/Net Worth | 4.09 | 3.38 | 2.70 | n.a |
| Dividend Payout | 0.00 | 0.00 | 0.00 | n.a |
Appendix
| Sales Forecast | |||||||||||||
| Jan | Feb | Mar | Apr | May | Jun | Jul | Aug | Sep | Oct | Nov | Dec | ||
| Sales | |||||||||||||
| Off-Site Food & Beverage | $50,000 | $52,500 | $55,125 | $57,881 | $60,775 | $63,814 | $67,005 | $69,685 | $72,472 | $75,371 | $78,386 | $81,522 | |
| Sumptuous Ballroom Food & Beverage | $0 | $0 | $5,000 | $5,500 | $6,050 | $6,655 | $7,321 | $8,053 | $8,858 | $9,744 | $10,718 | $11,790 | |
| Subcontracted Services | $25,000 | $25,750 | $26,523 | $27,318 | $28,138 | $28,982 | $29,851 | $30,747 | $31,669 | $32,619 | $33,598 | $34,606 | |
| Ballroom Rentals | $0 | $0 | $5,000 | $7,500 | $11,250 | $13,750 | $16,250 | $18,750 | $21,250 | $23,750 | $25,000 | $26,250 | |
| Staffing | $37,500 | $39,375 | $45,094 | $47,536 | $50,119 | $52,852 | $55,744 | $58,303 | $60,998 | $63,836 | $66,828 | $69,983 | |
| Referral Fees/Commissions | $6,250 | $6,563 | $7,516 | $7,923 | $8,353 | $8,809 | $9,291 | $9,717 | $10,166 | $10,639 | $11,138 | $11,664 | |
| Event Planning | $6,250 | $6,563 | $7,516 | $7,923 | $8,353 | $8,809 | $9,291 | $9,717 | $10,166 | $10,639 | $11,138 | $11,664 | |
| Total Sales | $125,000 | $130,750 | $151,773 | $161,581 | $173,038 | $183,670 | $194,752 | $204,972 | $215,580 | $226,599 | $236,806 | $247,478 | |
| Direct Cost of Sales | Jan | Feb | Mar | Apr | May | Jun | Jul | Aug | Sep | Oct | Nov | Dec | |
| Food and Beverage Cost | 25% | $12,500 | $13,125 | $15,031 | $15,845 | $16,706 | $17,617 | $18,581 | $19,434 | $20,333 | $21,279 | $22,276 | $23,328 |
| Other | $0 | $0 | $0 | $0 | $0 | $0 | $0 | $0 | $0 | $0 | $0 | $0 | |
| Subtotal Direct Cost of Sales | $12,500 | $13,125 | $15,031 | $15,845 | $16,706 | $17,617 | $18,581 | $19,434 | $20,333 | $21,279 | $22,276 | $23,328 | |
| Personnel Plan | |||||||||||||
| Jan | Feb | Mar | Apr | May | Jun | Jul | Aug | Sep | Oct | Nov | Dec | ||
| CEO | $7,000 | $7,000 | $7,000 | $7,000 | $7,000 | $7,000 | $7,000 | $7,000 | $7,000 | $7,000 | $7,000 | $7,000 | |
| COO | $6,000 | $6,000 | $6,000 | $6,000 | $6,000 | $6,000 | $6,000 | $6,000 | $6,000 | $6,000 | $6,000 | $6,000 | |
| Marketing Director | $5,000 | $5,000 | $5,000 | $5,000 | $5,000 | $5,000 | $5,000 | $5,000 | $5,000 | $5,000 | $5,000 | $5,000 | |
| Salespeople | $4,000 | $4,000 | $4,000 | $4,000 | $4,000 | $4,000 | $4,000 | $4,000 | $4,000 | $4,000 | $4,000 | $4,000 | |
| Administrative Assistant | $4,000 | $4,000 | $4,000 | $4,000 | $4,000 | $4,000 | $4,000 | $4,000 | $4,000 | $4,000 | $4,000 | $4,000 | |
| Head Cook | $5,000 | $5,000 | $5,000 | $5,000 | $5,000 | $5,000 | $5,000 | $5,000 | $5,000 | $5,000 | $5,000 | $5,000 | |
| Assistant Cooks | $4,000 | $4,000 | $4,000 | $4,000 | $4,000 | $4,000 | $4,000 | $4,000 | $4,000 | $4,000 | $4,000 | $4,000 | |
| Facility Manager | $4,500 | $4,500 | $4,500 | $4,500 | $4,500 | $4,500 | $4,500 | $4,500 | $4,500 | $4,500 | $4,500 | $4,500 | |
| Total People | 8 | 8 | 8 | 8 | 8 | 8 | 8 | 8 | 8 | 8 | 8 | 8 | |
| Total Payroll | $39,500 | $39,500 | $39,500 | $39,500 | $39,500 | $39,500 | $39,500 | $39,500 | $39,500 | $39,500 | $39,500 | $39,500 | |
| Pro Forma Profit and Loss | |||||||||||||
| Jan | Feb | Mar | Apr | May | Jun | Jul | Aug | Sep | Oct | Nov | Dec | ||
| Sales | $125,000 | $130,750 | $151,773 | $161,581 | $173,038 | $183,670 | $194,752 | $204,972 | $215,580 | $226,599 | $236,806 | $247,478 | |
| Direct Cost of Sales | $12,500 | $13,125 | $15,031 | $15,845 | $16,706 | $17,617 | $18,581 | $19,434 | $20,333 | $21,279 | $22,276 | $23,328 | |
| Event Staff | 17% | $21,250 | $22,228 | $25,801 | $27,469 | $29,417 | $31,224 | $33,108 | $34,845 | $36,649 | $38,522 | $40,257 | $42,071 |
| Subcontracted Services | $20,000 | $20,600 | $21,218 | $21,855 | $22,510 | $23,185 | $23,881 | $24,597 | $25,335 | $26,095 | $26,878 | $27,685 | |
| Total Cost of Sales | $53,750 | $55,953 | $62,051 | $65,169 | $68,633 | $72,027 | $75,570 | $78,877 | $82,316 | $85,896 | $89,411 | $93,084 | |
| Gross Margin | $71,250 | $74,798 | $89,722 | $96,412 | $104,405 | $111,643 | $119,182 | $126,095 | $133,263 | $140,703 | $147,395 | $154,395 | |
| Gross Margin % | 57.00% | 57.21% | 59.12% | 59.67% | 60.34% | 60.78% | 61.20% | 61.52% | 61.82% | 62.09% | 62.24% | 62.39% | |
| Expenses | |||||||||||||
| Payroll | $39,500 | $39,500 | $39,500 | $39,500 | $39,500 | $39,500 | $39,500 | $39,500 | $39,500 | $39,500 | $39,500 | $39,500 | |
| Marketing/Promotion | $10,000 | $10,000 | $10,000 | $10,000 | $10,000 | $10,000 | $10,000 | $8,000 | $8,000 | $8,000 | $6,000 | $6,000 | |
| Depreciation | 50000 | $2,333 | $2,333 | $2,333 | $2,333 | $2,333 | $2,333 | $2,333 | $2,333 | $2,333 | $2,333 | $2,333 | $2,333 |
| Rent | $2,000 | $2,000 | $2,000 | $2,000 | $2,000 | $2,000 | $2,000 | $2,000 | $2,000 | $2,000 | $2,000 | $2,000 | |
| Utilities | $500 | $525 | $551 | $579 | $608 | $638 | $670 | $704 | $739 | $776 | $814 | $855 | |
| Insurance | $3,000 | $3,000 | $3,000 | $3,000 | $3,000 | $3,000 | $3,000 | $3,000 | $3,000 | $3,000 | $3,000 | $3,000 | |
| Payroll Taxes | 15% | $9,113 | $9,259 | $9,795 | $10,045 | $10,337 | $10,609 | $10,891 | $11,152 | $11,422 | $11,703 | $11,964 | $12,236 |
| Employee Benefits | 10% | $6,075 | $6,173 | $6,530 | $6,697 | $6,892 | $7,072 | $7,261 | $7,435 | $7,615 | $7,802 | $7,976 | $8,157 |
| Office Expenses | 15% | $500 | $500 | $500 | $500 | $500 | $500 | $500 | $500 | $500 | $500 | $500 | $500 |
| Facility Cleaning & Maintenance | $6,450 | $6,738 | $7,789 | $8,279 | $8,852 | $9,384 | $9,938 | $10,449 | $10,979 | $11,530 | $12,040 | $12,574 | |
| Total Operating Expenses | $79,471 | $80,028 | $81,999 | $82,933 | $84,022 | $85,036 | $86,093 | $85,072 | $86,088 | $87,144 | $86,127 | $87,155 | |
| Profit Before Interest and Taxes | ($8,221) | ($5,230) | $7,723 | $13,479 | $20,383 | $26,607 | $33,089 | $41,023 | $47,175 | $53,559 | $61,267 | $67,239 | |
| EBITDA | ($5,888) | ($2,897) | $10,057 | $15,812 | $22,717 | $28,941 | $35,422 | $43,356 | $49,508 | $55,892 | $63,601 | $69,573 | |
| Interest Expense | $15,509 | $15,435 | $15,361 | $15,287 | $15,213 | $15,139 | $15,065 | $14,991 | $14,917 | $14,843 | $14,769 | $14,694 | |
| Taxes Incurred | ($7,119) | ($6,200) | ($2,291) | ($542) | $1,551 | $3,441 | $5,407 | $7,810 | $9,677 | $11,615 | $13,950 | $15,763 | |
| Net Profit | ($16,611) | ($14,466) | ($5,346) | ($1,266) | $3,619 | $8,028 | $12,617 | $18,223 | $22,581 | $27,101 | $32,549 | $36,781 | |
| Net Profit/Sales | -13.29% | -11.06% | -3.52% | -0.78% | 2.09% | 4.37% | 6.48% | 8.89% | 10.47% | 11.96% | 13.75% | 14.86% | |
| Pro Forma Cash Flow | |||||||||||||
| Jan | Feb | Mar | Apr | May | Jun | Jul | Aug | Sep | Oct | Nov | Dec | ||
| Cash Received | |||||||||||||
| Cash from Operations | |||||||||||||
| Cash Sales | $62,500 | $65,375 | $75,886 | $80,790 | $86,519 | $91,835 | $97,376 | $102,486 | $107,790 | $113,300 | $118,403 | $123,739 | |
| Cash from Receivables | $72,222 | $69,444 | $64,033 | $70,981 | $78,502 | $83,846 | $89,354 | $94,790 | $100,101 | $105,315 | $110,728 | $116,021 | |
| Subtotal Cash from Operations | $134,722 | $134,819 | $139,920 | $151,771 | $165,021 | $175,681 | $186,730 | $197,276 | $207,891 | $218,614 | $229,131 | $239,761 | |
| Additional Cash Received | |||||||||||||
| Sales Tax, VAT, HST/GST Received | 8.00% | $10,000 | $10,460 | $12,142 | $12,926 | $13,843 | $14,694 | $15,580 | $16,398 | $17,246 | $18,128 | $18,944 | $19,798 |
| New Current Borrowing | $0 | $0 | $0 | $0 | $0 | $0 | $0 | $0 | $0 | $0 | $0 | $0 | |
| New Other Liabilities (interest-free) | $0 | $0 | $0 | $0 | $0 | $0 | $0 | $0 | $0 | $0 | $0 | $0 | |
| New Long-term Liabilities | $1,870,000 | $0 | $0 | $0 | $0 | $0 | $0 | $0 | $0 | $0 | $0 | $0 | |
| Sales of Other Current Assets | $0 | $0 | $0 | $0 | $0 | $0 | $0 | $0 | $0 | $0 | $0 | $0 | |
| Sales of Long-term Assets | $0 | $0 | $0 | $0 | $0 | $0 | $0 | $0 | $0 | $0 | $0 | $0 | |
| New Investment Received | $0 | $0 | $0 | $0 | $0 | $0 | $0 | $0 | $0 | $0 | $0 | $0 | |
| Subtotal Cash Received | $2,014,722 | $145,279 | $152,061 | $164,698 | $178,864 | $190,374 | $202,310 | $213,674 | $225,137 | $236,742 | $248,076 | $259,559 | |
| Expenditures | Jan | Feb | Mar | Apr | May | Jun | Jul | Aug | Sep | Oct | Nov | Dec | |
| Expenditures from Operations | |||||||||||||
| Cash Spending | $39,500 | $39,500 | $39,500 | $39,500 | $39,500 | $39,500 | $39,500 | $39,500 | $39,500 | $39,500 | $39,500 | $39,500 | |
| Bill Payments | $53,001 | $90,483 | $104,113 | $116,411 | $121,640 | $128,225 | $134,482 | $140,936 | $145,552 | $151,832 | $158,297 | $163,138 | |
| Subtotal Spent on Operations | $92,501 | $129,983 | $143,613 | $155,911 | $161,140 | $167,725 | $173,982 | $180,436 | $185,052 | $191,332 | $197,797 | $202,638 | |
| Additional Cash Spent | |||||||||||||
| Sales Tax, VAT, HST/GST Paid Out | $10,000 | $10,460 | $12,142 | $12,926 | $13,843 | $14,694 | $15,580 | $16,398 | $17,246 | $18,128 | $18,944 | $19,798 | |
| Principal Repayment of Current Borrowing | $0 | $0 | $0 | $0 | $0 | $0 | $0 | $0 | $0 | $0 | $0 | $0 | |
| Other Liabilities Principal Repayment | $0 | $0 | $0 | $0 | $0 | $0 | $0 | $0 | $0 | $0 | $0 | $0 | |
| Long-term Liabilities Principal Repayment | $8,889 | $8,889 | $8,889 | $8,889 | $8,889 | $8,889 | $8,889 | $8,889 | $8,889 | $8,889 | $8,889 | $8,889 | |
| Purchase Other Current Assets | $100,000 | $0 | $0 | $0 | $0 | $0 | $0 | $0 | $0 | $0 | $0 | $0 | |
| Purchase Long-term Assets | $2,050,000 | $0 | $0 | $0 | $0 | $0 | $0 | $0 | $0 | $0 | $0 | $0 | |
| Dividends | $0 | $0 | $0 | $0 | $0 | $0 | $0 | $0 | $0 | $0 | $0 | $0 | |
| Subtotal Cash Spent | $2,261,390 | $149,332 | $164,644 | $177,727 | $183,872 | $191,307 | $198,451 | $205,723 | $211,187 | $218,349 | $225,631 | $231,325 | |
| Net Cash Flow | ($246,668) | ($4,053) | ($12,582) | ($13,029) | ($5,008) | ($933) | $3,860 | $7,951 | $13,951 | $18,393 | $22,445 | $28,234 | |
| Cash Balance | $53,332 | $49,279 | $36,697 | $23,668 | $18,660 | $17,727 | $21,587 | $29,538 | $43,488 | $61,882 | $84,327 | $112,561 | |
| Pro Forma Balance Sheet | |||||||||||||
| Jan | Feb | Mar | Apr | May | Jun | Jul | Aug | Sep | Oct | Nov | Dec | ||
| Assets | Starting Balances | ||||||||||||
| Current Assets | |||||||||||||
| Cash | $300,000 | $53,332 | $49,279 | $36,697 | $23,668 | $18,660 | $17,727 | $21,587 | $29,538 | $43,488 | $61,882 | $84,327 | $112,561 |
| Accounts Receivable | $108,333 | $98,611 | $94,542 | $106,395 | $116,204 | $124,221 | $132,211 | $140,232 | $147,928 | $155,617 | $163,601 | $171,276 | $178,994 |
| Inventory | $16,000 | $6,250 | $6,563 | $7,516 | $7,923 | $8,353 | $8,809 | $9,291 | $9,717 | $10,166 | $10,639 | $11,138 | $11,664 |
| Other Current Assets | $2,500 | $102,500 | $102,500 | $102,500 | $102,500 | $102,500 | $102,500 | $102,500 | $102,500 | $102,500 | $102,500 | $102,500 | $102,500 |
| Total Current Assets | $426,833 | $260,693 | $252,884 | $253,107 | $250,294 | $253,734 | $261,246 | $273,610 | $289,683 | $311,771 | $338,622 | $369,241 | $405,719 |
| Long-term Assets | |||||||||||||
| Long-term Assets | $90,000 | $2,140,000 | $2,140,000 | $2,140,000 | $2,140,000 | $2,140,000 | $2,140,000 | $2,140,000 | $2,140,000 | $2,140,000 | $2,140,000 | $2,140,000 | $2,140,000 |
| Accumulated Depreciation | $40,000 | $42,333 | $44,667 | $47,000 | $49,333 | $51,667 | $54,000 | $56,333 | $58,667 | $61,000 | $63,333 | $65,667 | $68,000 |
| Total Long-term Assets | $50,000 | $2,097,667 | $2,095,333 | $2,093,000 | $2,090,667 | $2,088,333 | $2,086,000 | $2,083,667 | $2,081,333 | $2,079,000 | $2,076,667 | $2,074,333 | $2,072,000 |
| Total Assets | $476,833 | $2,358,360 | $2,348,217 | $2,346,107 | $2,340,961 | $2,342,068 | $2,347,246 | $2,357,276 | $2,371,017 | $2,390,771 | $2,415,289 | $2,443,574 | $2,477,719 |
| Liabilities and Capital | Jan | Feb | Mar | Apr | May | Jun | Jul | Aug | Sep | Oct | Nov | Dec | |
| Current Liabilities | |||||||||||||
| Accounts Payable | $50,000 | $87,027 | $100,238 | $112,364 | $117,373 | $123,749 | $129,789 | $136,091 | $140,498 | $146,561 | $152,866 | $157,491 | $163,743 |
| Current Borrowing | $0 | $0 | $0 | $0 | $0 | $0 | $0 | $0 | $0 | $0 | $0 | $0 | $0 |
| Other Current Liabilities | $0 | $0 | $0 | $0 | $0 | $0 | $0 | $0 | $0 | $0 | $0 | $0 | $0 |
| Subtotal Current Liabilities | $50,000 | $87,027 | $100,238 | $112,364 | $117,373 | $123,749 | $129,789 | $136,091 | $140,498 | $146,561 | $152,866 | $157,491 | $163,743 |
| Long-term Liabilities | $0 | $1,861,111 | $1,852,222 | $1,843,333 | $1,834,444 | $1,825,555 | $1,816,666 | $1,807,777 | $1,798,888 | $1,789,999 | $1,781,110 | $1,772,221 | $1,763,332 |
| Total Liabilities | $50,000 | $1,948,138 | $1,952,460 | $1,955,697 | $1,951,817 | $1,949,304 | $1,946,455 | $1,943,868 | $1,939,386 | $1,936,560 | $1,933,976 | $1,929,712 | $1,927,075 |
| Paid-in Capital | $200,000 | $200,000 | $200,000 | $200,000 | $200,000 | $200,000 | $200,000 | $200,000 | $200,000 | $200,000 | $200,000 | $200,000 | $200,000 |
| Retained Earnings | $151,833 | $226,833 | $226,833 | $226,833 | $226,833 | $226,833 | $226,833 | $226,833 | $226,833 | $226,833 | $226,833 | $226,833 | $226,833 |
| Earnings | $75,000 | ($16,611) | ($31,077) | ($36,423) | ($37,689) | ($34,070) | ($26,042) | ($13,425) | $4,797 | $27,378 | $54,479 | $87,029 | $123,810 |
| Total Capital | $426,833 | $410,222 | $395,756 | $390,410 | $389,144 | $392,763 | $400,791 | $413,408 | $431,631 | $454,212 | $481,313 | $513,862 | $550,643 |
| Total Liabilities and Capital | $476,833 | $2,358,360 | $2,348,217 | $2,346,107 | $2,340,961 | $2,342,068 | $2,347,246 | $2,357,276 | $2,371,017 | $2,390,771 | $2,415,289 | $2,443,574 | $2,477,719 |
| Net Worth | $426,833 | $410,222 | $395,756 | $390,410 | $389,144 | $392,763 | $400,791 | $413,408 | $431,631 | $454,212 | $481,313 | $513,862 | $550,643 |


