
Like New Carpet Cleaners
Company Summary
Like New Carpet Cleaners will be a local carpet-cleaning service doing business in Fairfield County, Connecticut. Established in June 2009 as an LLC, Like New Carpet Cleaners was founded by Fred and Rebecca Smith, who operate the business out of their home office in Danbury, CT.
Company Ownership
Fred and Rebecca Smith founded Like New Carpet Cleaners as an LLC in June 2009. Each own 50% of the company.
Start-up Summary
The startup expenses for the business are primarily in three strategic areas:
- Website: A website will be developed and tested, with functionality to allow online ordering, scheduling, rescheduling, and customer support. ($30,000 estimate)
- Delivery Van: A delivery van must be purchased to transport cleaning staff and equipment to customer homes. One van will be used to transport multiple cleaning crews during initial operations. ($15,000 estimate)
- Cleaning Equipment: 3 portable extractors and additional specialized equipment for cleanings. ($15,000 estimate)
The business will be based out of a home office, which will limit initial rent and overhead costs.

| Start-up | |
| Requirements | |
| Start-up Expenses | |
| Legal | $1,500 |
| Stationery etc. | $1,000 |
| Insurance | $2,000 |
| Rent | $1,000 |
| Website | $30,000 |
| Other | $2,000 |
| Total Start-up Expenses | $37,500 |
| Start-up Assets | |
| Cash Required | $30,000 |
| Other Current Assets | $0 |
| Long-term Assets | $30,000 |
| Total Assets | $60,000 |
| Total Requirements | $97,500 |
Services
Like New Carpet Cleaners services and products will include:
- Regular Carpet Cleaning
- Spot Treatment for Carpets
- Furniture Cleaning
- Leather Furniture Cleaning
- Area Rugs
- Gift Certificates
The company will focus on cleaning carpets, rugs, and upholstered items and will seek to build and maintain its expertise in this area; its services will not include hardwood floors or other home-cleaning services.
Through its website, the company will offer the service of easy scheduling and the set-up of automated recurring appointments for its regular customers.
Market Analysis Summary
The U.S. carpet and upholstery cleaning service sector was estimated at $5.3 billion in 2006 by Marketdata Enterprises. The market is broken into residential and commercial services. While only moderate growth is estimated for the next five years, the national market is highly competitive.
The initial market for Like New Carpet Cleaners is residential services in Fairfield County, CT, beginning with a five-mile radius of Danbury, CT. The population of Fairfield County is approximately 895,000 with 225,000 owner-occupied condos and homes. It is estimated that 40,000 of these owner-occupied homes and condos are within that five-mile radius. These 40,000 owners spend an estimated $4 million per year on carpet, upholstery, and other floor-cleaning services. For that reason, we have chosen this as our initial market.
Market Segmentation
Customers for this industry are broken into the following targets:
- Residences (including individuals, families, and landlords)
- Businesses (including small businesses, larger businesses, insurance companies, and commercial landlords)
Residences require a higher level of customer support, pay higher rates on average, and often include additional opportunities to sell related services to homeowners.
Businesses require less customer support and service, pay lower rates on average, and generally seek ongoing services which can repeat the same tasks without much room for upselling.
| Market Analysis | |||||||
| Year 1 | Year 2 | Year 3 | Year 4 | Year 5 | |||
| Potential Customers | Growth | CAGR | |||||
| Large Homes | 25% | 10,000 | 12,500 | 15,625 | 19,531 | 24,414 | 25.00% |
| Medium Homes | 25% | 20,000 | 25,000 | 31,250 | 39,063 | 48,829 | 25.00% |
| Condos and Small Homes | 25% | 10,000 | 12,500 | 15,625 | 19,531 | 24,414 | 25.00% |
| Total | 25.00% | 40,000 | 50,000 | 62,500 | 78,125 | 97,657 | 25.00% |
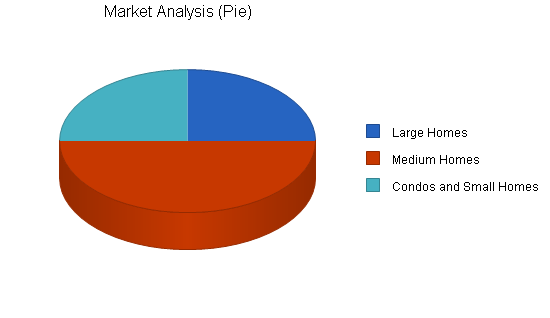
Target Market Segment Strategy
Like New Carpet Cleaners will focus on residential cleaning services, rather than businesses, because it believes this market is more likely to accept technological advances and Internet customer service. Like New has divided the market into these segments:
- Large homes (over 5,000 square feet) – Generally have many rooms needing regular service as well as the need for upholstery and spot treatments. Service may require a full day of cleaning.
- Medium homes (2000 to 5000 square feet) – Generally have a couple of rooms needing regular service and may require service as often or more often than large homes as each room is given more wear and tear by families. Service may require half a day (four hours) of cleaning.
- Small homes and condos (under 2000 square feet) – Generally have at least one carpeted room requiring regular service. Service may often be completed in two hours or less.
Service Business Analysis
The carpet-cleaning business is characterized by multiple local businesses serving a town or a few towns, and some national franchises. Each town can have from ten to twenty businesses.
Cleaning services are generally managed out of a central office. Delivery vans are used to transport equipment and cleaning crews from the central office to customer homes.
Services are generally ordered by phone. For large homes, on-site consultations are given to develop a more accurate quote for cleaning service, rather than quoting a price site unseen. Some online ordering is done, but most small businesses rely on phone conversations to gather the information needed to quote a price to customers.
Competition and Buying Patterns
Marketdata Enterprises reports that the carpet and upholstery industry for the U.S. is comprised of 40,000 mostly small companies and that the industry is relatively mature. Although some large franchised organizations exist, the top ten franchises make up only 22% of the market. These top competitors include Sears, Stanley Steemer, Chem-Dry, ServiceMaster Clean, ServPro, Duraclean, Heaven’s Best, Rainbow Intl., MilliCare Commercial Carpet Care, and Professional Carpet Systems.
Customers choose between these competitors based on brand name, positive references from trusted sources (friends, family and colleagues, and customer-review websites, such as www.yelp.com), and price. Most cleaning services do not compete specifically on price, although franchises sometimes use this lever. While brand name is important for some customers, many realize that small businesses use the same equipment and hire the same basic labor as the known brands and, therefore, that positive word-of-mouth is more important.
Web Plan Summary
The website for Like New Carpet Cleaners will convert Web users to ordering cleaning services because of the simplicity of the process, customization of services, and the ability of the online system to red flag inquiries which require additional attention.
For new customers, the site will include:
- Graphics and tutorials to go through the booking and scheduling process
- Client testimonials
- Explanations of how pricing is determined
- A list of services
- “Frequently-asked questions” page to answer common questions and to explain how the service works, what the time frame is to complete the work, etc.
- “About us” page – details on the founders and mission of the company
For current customers, the website will also be an account management tool, allowing them to:
- Schedule and reschedule cleanings
- Set up automated, recurring appointments
The website will have the functionality to provide quotes to most customers, based on their entries about the services needed, size of their space, furniture, carpets, etc. For certain specifications (determined by the founders) the system will be unable to provide a quote and will refer the inquiry to the sales department for further investigation. Clients will pay by credit card (using a security protocol connection for sending credit card information over the Internet) and can have their credit card saved on file for easier booking in the future.
Website Marketing Strategy
The website will be marketed through search engine marketing and search engine optimization. Search engine marketing will require bidding on keywords relevant to carpet cleaning for the local market, with Google Adwords. Like New Carpet Cleaners will retain the services of a search engine marketing firm to set up and optimize its Google Adwords account.
Search engine optimization will be based on the initial design of the website to make it search-engine friendly, and on building links over time from other related websites to increase its Google ranking. Content will also be added to the website, including informative articles about carpet cleaning, written by the company founders and other experts, in order to increase the website’s standing on the Internet as a resource for information on carpet cleaning.
Brought to you by
Create a professional business plan
Using AI and step-by-step instructions
Create Your PlanSecure funding
Validate ideas
Build a strategy
Development Requirements
The front end of the website will require the pages previously discussed in the summary as well as the standard contact page and legal disclaimers.
The back end of the website will require:
-
Ability for managers to adjust pricing and service options.
-
Automatic integration of scheduling and orders from the website to accounting and calendar systems, with alerts sent by email to relevant staff.
The website will be built over two months. A quote of $30,000 has been given for the needed functionality and has been verified by advisors with web development expertise as an appropriate rate. The two-month period will allow three weeks for testing and debugging at the end of the period.
The website will require ongoing maintenance which is shown on the profit and loss statement as an operating expense. Either the same firm that created the site will be retained for ongoing maintenance and updates, or a new firm will be selected.
Strategy and Implementation Summary
The strategy of Like New Carpet Cleaning is to expand rapidly within Fairfield County, CT, targeting residential customers only, with an eye towards proving its model as scalable on a statewide level. To that end, it will seek funding for its initial five years of growth and then an additional round of funding to support that growth after five years. The strategy includes the following priorities:
- Ensure high-quality, moderately-priced service using a web-based model of sales and customer support.
- Keep overhead low by operating out of one office and keeping full-time staff at a minimum.
- Build its brand around the fact that carpets will look “like new” after cleanings, saving customers worry and expense.
Competitive Edge
The website of Like New Carpet Cleaning will offer complete sales, service, and scheduling applications online. This allows the business to reduce its operating costs, establish a business that can scale up quickly, and still provide a good customer experience. This online scheduling approach lets customers sign up for carpet cleaning services any time, day or night. This is a convenience that will be appreciated by the customer. It is an asset which it will be difficult for competitors to imitate because of the high cost of implementation.
Marketing Strategy
The marketing strategy is to promote and build a base of residential customers within a five-mile radius of Danbury, CT.
This will include:
-
A direct mail campaign targeting homeowners with large homes (more than 5,000 sq. ft). This group spends a higher amount on carpet cleaning per home than the other target markets, and they are more likely to create positive word-of-mouth about the service.
-
Poster advertising built around the simplicity with which the company can make customer carpets look “like new.” Locations will include bus stops, public parks, the sides of buses and taxi cabs, and movie theater advertising.
The marketing campaign will then move to web advertising via search engine marketing (Google Adwords) and search engine optimization to capitalize on converting those searching for carpet cleaning services locally into sales.
Sales Strategy
Like New Carpet Cleaners will automate its sales on its website. In the first year a target of 75% of sales will be conducted entirely on its website with minimal need for interaction with a salesperson. By its fifth year of operation, 90% of sales will be conducted entirely on its website. This includes the customer entry of details on their needs, the quoting of prices, client acceptance of the price and entry of a credit card, and scheduling of the services. The back-end of the website will store customer data and allow the owners to change pricing and services offered.
The owners, Rebecca and Fred Smith, will answer client queries which cannot be handled by the website service, based on specific emails that come in or website inquiries which are flagged as requiring personal attention. They will serve these clients with home estimates when necessary, using this experience to develop a stronger web-based model going forward. No commissioned salespeople will be hired, as the intention is to create a web-based model.
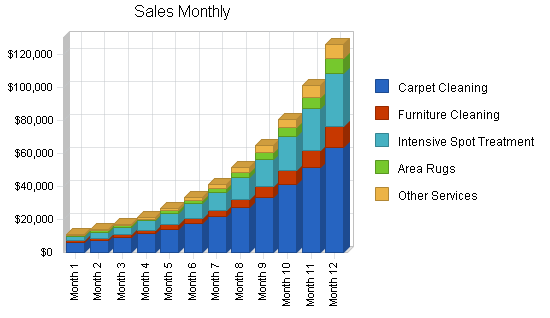
Sales Forecast
The primary revenue streams for Like New Carpet Cleaners will be carpet cleaning and intensive spot treatments. As the company will brand itself as the leader in making carpets look “like new,” these will be the drivers of growth. Additional services will be sold primarily to customers who seek out Like New for its carpet treatments.
Average services are defined as the following, for the purpose of the sales forecast:
-
Average carpet cleaning is two rooms (a small, semi-carpeted apartment)
-
Average furniture cleaning is one large couch
-
Average intensive spot treatment is one carpet
-
Average area rug cleaning is one area rug
Cost of sales is expected to be 35% for the labor of cleaning staff. The remaining 4-10%, depending on the service, is for cleaning supplies and gasoline applied to the job to transport crew and equipment.
Over the first year, rapid growth is anticipated month over month as customer reviews come in and the simplicity and assurance of the web model is tested by the customer. A 25% annual growth is estimated as the business expands to cover all of Fairfield County, with additional bases of operation throughout the county. Growth will be primarily through the company’s geographic expansion and secondarily through deeper penetration in each town as word-of-mouth grows.
The main impediment to this rapid growth would be the reluctance of customers to switch from their current carpet cleaning services. This risk will be mitigated by offering incentives to customers who switch and no-commitment trial prices. Competitors are unlikely to offer the same web-based model as their entire infrastructures are built around the use of salespeople, customer service reps, and in-person sales appointments.

| Sales Forecast | |||||
| Year 1 | Year 2 | Year 3 | Year 4 | Year 5 | |
| Unit Sales | |||||
| Carpet Cleaning | 3,054 | 3817 | 4772 | 5965 | 7456 |
| Furniture Cleaning | 2,310 | 2888 | 3609 | 4512 | 5640 |
| Intensive Spot Treatment | 3,054 | 3817 | 4772 | 5964 | 7456 |
| Area Rugs | 1,486 | 1857 | 2322 | 2902 | 3628 |
| Other Services | 1,486 | 1857 | 2322 | 2902 | 3628 |
| Total Unit Sales | 11,390 | 14,237 | 17,796 | 22,245 | 27,806 |
| Unit Prices | Year 1 | Year 2 | Year 3 | Year 4 | Year 5 |
| Carpet Cleaning | $100.00 | $100.00 | $100.00 | $100.00 | $100.00 |
| Furniture Cleaning | $25.00 | $25.00 | $25.00 | $25.00 | $25.00 |
| Intensive Spot Treatment | $50.00 | $50.00 | $50.00 | $50.00 | $50.00 |
| Area Rugs | $25.00 | $25.00 | $25.00 | $25.00 | $25.00 |
| Other Services | $25.00 | $25.00 | $25.00 | $25.00 | $25.00 |
| Sales | |||||
| Carpet Cleaning | $305,395 | $381,744 | $477,180 | $596,475 | $745,593 |
| Furniture Cleaning | $57,750 | $72,188 | $90,234 | $112,793 | $140,991 |
| Intensive Spot Treatment | $152,691 | $190,864 | $238,580 | $298,225 | $372,781 |
| Area Rugs | $37,147 | $46,434 | $58,042 | $72,553 | $90,691 |
| Other Services | $37,147 | $46,434 | $58,042 | $72,553 | $90,691 |
| Total Sales | $590,130 | $737,663 | $922,078 | $1,152,598 | $1,440,747 |
| Direct Unit Costs | Year 1 | Year 2 | Year 3 | Year 4 | Year 5 |
| Carpet Cleaning | $30.00 | $30.00 | $30.00 | $30.00 | $30.00 |
| Furniture Cleaning | $7.50 | $7.50 | $7.50 | $7.50 | $7.50 |
| Intensive Spot Treatment | $22.50 | $22.50 | $22.50 | $22.50 | $22.50 |
| Area Rugs | $9.75 | $9.75 | $9.75 | $9.75 | $9.75 |
| Other Services | $11.25 | $11.25 | $11.25 | $11.25 | $11.25 |
| Direct Cost of Sales | |||||
| Carpet Cleaning | $91,619 | $114,523 | $143,154 | $178,942 | $223,678 |
| Furniture Cleaning | $17,325 | $21,656 | $27,070 | $33,838 | $42,297 |
| Intensive Spot Treatment | $68,711 | $85,889 | $107,361 | $134,201 | $167,751 |
| Area Rugs | $14,487 | $18,109 | $22,636 | $28,296 | $35,369 |
| Other Services | $16,716 | $20,895 | $26,119 | $32,649 | $40,811 |
| Subtotal Direct Cost of Sales | $208,858 | $261,072 | $326,341 | $407,926 | $509,907 |
Milestones
The marketing program depends on timely completion of the key marketing tasks. Before any public marketing can begin, the website service must be well tested. This will happen over a two-month period. Upon completion of this work, direct mail and poster/movie screen advertising will begin concurrently with the goal of making thousands of local residents aware of the new business and its value proposition. Web advertising will follow with the goal of converting those locals searching for carpet cleaning to sales.

| Milestones | |||||
| Milestone | Start Date | End Date | Budget | Manager | Department |
| Website Build | 8/1/2009 | 10/3/2009 | $30,000 | RS | Operations |
| Direct Mail Campaign | 10/3/2009 | 12/31/2009 | $10,000 | FS | Marketing |
| Public Advertising | 11/23/2009 | 12/31/2009 | $20,000 | FS | Marketing |
| Search Engine Advertising | 11/3/2009 | 12/31/2009 | $10,000 | FS | Marketing |
| Totals | $70,000 | ||||
Management Summary
The business will be managed the owners, Fred and Rebecca Smith.
Fred Smith, CEO, will be head of sales and marketing. He will make client appointments, when needed, and will orchestrate all marketing activities.
Brought to you by
Create a professional business plan
Using AI and step-by-step instructions
Create Your PlanSecure funding
Validate ideas
Build a strategy
Rebecca Smith, COO, will be head of operations and finances. She will manage all financial aspects of the business, including bookkeeping, accounting, and financing. She will project manage the development of the Web service (working with temporary programming help to program the service). She will do sales work as necessary, under the direction of Fred Smith. She will be responsible for the establishment of operations systems, including the hiring of cleaning crews, the purchase of equipment, and quality assurance.
In the fourth year of operation, experienced business managers will be hired to take over the positions of CEO and COO with the goal of preparing the company for franchising. At this point, Fred and Rebecca Smith will move to entirely strategic roles.
Personnel Plan
A full-time administrative assistant will be hired after six months of operation to take over bookkeeping, accounts payable, and support of sales and marketing activities. This will allow Fred and Rebecca Smith to concentrate their time on strategic endeavors, including opportunities for expansion, with new bases of operation beyond their initial target area. This individual will transition into the role of administrative manager, or be replaced by an individual who can handle management. After two years of operation, an additional administrative assistant will be hired.
| Personnel Plan | |||||
| Year 1 | Year 2 | Year 3 | Year 4 | Year 5 | |
| CEO | $60,000 | $60,000 | $60,000 | $70,000 | $75,000 |
| COO | $60,000 | $60,000 | $60,000 | $70,000 | $75,000 |
| Administrative Assistant/ Manager | $18,000 | $40,000 | $50,000 | $55,000 | $60,000 |
| Administrative Assistant 2 | $0 | $0 | $40,000 | $42,000 | $45,000 |
| Total People | 3 | 3 | 4 | 4 | 4 |
| Total Payroll | $138,000 | $160,000 | $210,000 | $237,000 | $255,000 |
Financial Plan
Like New Carpet Cleaning will add at least one new local base each year, consisting of parking for the company van and storage for cleaning equipment and supplies. This future growth will be financed by cash generated from existing locations and debt to finance vehicle and cleaning equipment purchases.
Start-up Funding
Start-up funding will be provided by a combination of owner investment and investor funding, with a small amount of debt. The owners will contribute $20,000 of initial funding to develop a prototype of the website. Investors will contribute $57,500 for a 30% share of the company.
| Start-up Funding | |
| Start-up Expenses to Fund | $37,500 |
| Start-up Assets to Fund | $60,000 |
| Total Funding Required | $97,500 |
| Assets | |
| Non-cash Assets from Start-up | $30,000 |
| Cash Requirements from Start-up | $30,000 |
| Additional Cash Raised | $0 |
| Cash Balance on Starting Date | $30,000 |
| Total Assets | $60,000 |
| Liabilities and Capital | |
| Liabilities | |
| Current Borrowing | $0 |
| Long-term Liabilities | $15,000 |
| Accounts Payable (Outstanding Bills) | $5,000 |
| Other Current Liabilities (interest-free) | $0 |
| Total Liabilities | $20,000 |
| Capital | |
| Planned Investment | |
| Owners | $20,000 |
| Investor | $57,500 |
| Additional Investment Requirement | $0 |
| Total Planned Investment | $77,500 |
| Loss at Start-up (Start-up Expenses) | ($37,500) |
| Total Capital | $40,000 |
| Total Capital and Liabilities | $60,000 |
| Total Funding | $97,500 |
Break-even Analysis
The business will benefit from a low monthly break-even point due to the assignment of most costs directly to the cleaning service (gasoline, cleaning crew labor, and cleaning products) and the low payroll that is achieved by leveraging Like New’s website, which will reduce administrative costs.

| Break-even Analysis | |
| Monthly Units Break-even | 705 |
| Monthly Revenue Break-even | $36,506 |
| Assumptions: | |
| Average Per-Unit Revenue | $51.81 |
| Average Per-Unit Variable Cost | $18.34 |
| Estimated Monthly Fixed Cost | $23,586 |
Projected Profit and Loss
The business will experience modest profits for its first three years of operation. This is due to the fact that the operations of the organization will be built to scale up over a larger geographic region. In the fourth and fifth years of operation, this will begin to pay off with healthy profits.This will prove the viability of the business model for a franchise or statewide expansion.
Direct labor is estimated at 35% of sales revenue (the actual cleaning representing about a 280% markup of the labor). Direct labor is included in the cost of sales.


| Pro Forma Profit and Loss | |||||
| Year 1 | Year 2 | Year 3 | Year 4 | Year 5 | |
| Sales | $590,130 | $737,663 | $922,078 | $1,152,598 | $1,440,747 |
| Direct Cost of Sales | $208,858 | $261,072 | $326,341 | $407,926 | $509,907 |
| Other Costs of Sales | $0 | $0 | $0 | $0 | $0 |
| Total Cost of Sales | $208,858 | $261,072 | $326,341 | $407,926 | $509,907 |
| Gross Margin | $381,272 | $476,590 | $595,738 | $744,672 | $930,840 |
| Gross Margin % | 64.61% | 64.61% | 64.61% | 64.61% | 64.61% |
| Expenses | |||||
| Payroll | $138,000 | $160,000 | $210,000 | $237,000 | $255,000 |
| Marketing/Promotion | $60,000 | $70,000 | $80,000 | $90,000 | $100,000 |
| Depreciation | $6,000 | $10,000 | $12,000 | $18,000 | $30,000 |
| Rent | $10,200 | $30,000 | $40,000 | $50,000 | $60,000 |
| Utilities | $1,200 | $2,000 | $2,500 | $3,000 | $3,500 |
| Insurance | $3,600 | $4,000 | $5,000 | $6,500 | $8,000 |
| Payroll Taxes | $52,029 | $63,161 | $80,451 | $35,550 | $38,250 |
| Website Maintenance/Hosting | $6,000 | $7,000 | $8,000 | $9,000 | $10,000 |
| Other | $6,000 | $7,000 | $8,000 | $9,000 | $10,000 |
| Total Operating Expenses | $283,029 | $353,161 | $445,951 | $458,050 | $514,750 |
| Profit Before Interest and Taxes | $98,243 | $123,429 | $149,787 | $286,622 | $416,090 |
| EBITDA | $104,243 | $133,429 | $161,787 | $304,622 | $446,090 |
| Interest Expense | $688 | $0 | $0 | $0 | $0 |
| Taxes Incurred | $29,267 | $37,029 | $44,936 | $85,987 | $124,827 |
| Net Profit | $68,289 | $86,400 | $104,851 | $200,635 | $291,263 |
| Net Profit/Sales | 11.57% | 11.71% | 11.37% | 17.41% | 20.22% |
Projected Cash Flow
In the first year, cash flow will be supported by start-up funding and full payment by customers in advance Company vans will be purchased with auto loans. When the business expands to new offices across the county, additional vans and cleaning equipment must be purchased. These will be financed through debt, including a company credit line.

| Pro Forma Cash Flow | |||||
| Year 1 | Year 2 | Year 3 | Year 4 | Year 5 | |
| Cash Received | |||||
| Cash from Operations | |||||
| Cash Sales | $590,130 | $737,663 | $922,078 | $1,152,598 | $1,440,747 |
| Subtotal Cash from Operations | $590,130 | $737,663 | $922,078 | $1,152,598 | $1,440,747 |
| Additional Cash Received | |||||
| Sales Tax, VAT, HST/GST Received | $0 | $0 | $0 | $0 | $0 |
| New Current Borrowing | $0 | $0 | $0 | $0 | $0 |
| New Other Liabilities (interest-free) | $0 | $0 | $0 | $0 | $0 |
| New Long-term Liabilities | $0 | $0 | $0 | $0 | $0 |
| Sales of Other Current Assets | $0 | $0 | $0 | $0 | $0 |
| Sales of Long-term Assets | $0 | $0 | $0 | $0 | $0 |
| New Investment Received | $0 | $0 | $0 | $0 | $0 |
| Subtotal Cash Received | $590,130 | $737,663 | $922,078 | $1,152,598 | $1,440,747 |
| Expenditures | Year 1 | Year 2 | Year 3 | Year 4 | Year 5 |
| Expenditures from Operations | |||||
| Cash Spending | $138,000 | $160,000 | $210,000 | $237,000 | $255,000 |
| Bill Payments | $308,546 | $516,001 | $585,861 | $688,600 | $850,715 |
| Subtotal Spent on Operations | $446,546 | $676,001 | $795,861 | $925,600 | $1,105,715 |
| Additional Cash Spent | |||||
| Sales Tax, VAT, HST/GST Paid Out | $0 | $0 | $0 | $0 | $0 |
| Principal Repayment of Current Borrowing | $0 | $0 | $0 | $0 | $0 |
| Other Liabilities Principal Repayment | $0 | $0 | $0 | $0 | $0 |
| Long-term Liabilities Principal Repayment | $15,000 | $0 | $0 | $0 | $0 |
| Purchase Other Current Assets | $0 | $0 | $0 | $0 | $0 |
| Purchase Long-term Assets | $18,000 | $30,000 | $30,000 | $30,000 | $30,000 |
| Dividends | $0 | $0 | $0 | $0 | $0 |
| Subtotal Cash Spent | $479,546 | $706,001 | $825,861 | $955,600 | $1,135,715 |
| Net Cash Flow | $110,584 | $31,662 | $96,218 | $196,997 | $305,032 |
| Cash Balance | $140,584 | $172,245 | $268,463 | $465,460 | $770,492 |
Projected Balance Sheet
The net worth of the business will show healthy growth, even while liabilities will increase due to the growth of the business and the need to purchase additional assets. Liabilities will initially decrease in the second year as accounts payable from the first large expansion are paid off. After that point, growth will be more even. A cash balance will be built up with the plan of financing expansion of the business.
| Pro Forma Balance Sheet | |||||
| Year 1 | Year 2 | Year 3 | Year 4 | Year 5 | |
| Assets | |||||
| Current Assets | |||||
| Cash | $140,584 | $172,245 | $268,463 | $465,460 | $770,492 |
| Other Current Assets | $0 | $0 | $0 | $0 | $0 |
| Total Current Assets | $140,584 | $172,245 | $268,463 | $465,460 | $770,492 |
| Long-term Assets | |||||
| Long-term Assets | $48,000 | $78,000 | $108,000 | $138,000 | $168,000 |
| Accumulated Depreciation | $6,000 | $16,000 | $28,000 | $46,000 | $76,000 |
| Total Long-term Assets | $42,000 | $62,000 | $80,000 | $92,000 | $92,000 |
| Total Assets | $182,584 | $234,245 | $348,463 | $557,460 | $862,492 |
| Liabilities and Capital | Year 1 | Year 2 | Year 3 | Year 4 | Year 5 |
| Current Liabilities | |||||
| Accounts Payable | $74,295 | $39,556 | $48,923 | $57,285 | $71,053 |
| Current Borrowing | $0 | $0 | $0 | $0 | $0 |
| Other Current Liabilities | $0 | $0 | $0 | $0 | $0 |
| Subtotal Current Liabilities | $74,295 | $39,556 | $48,923 | $57,285 | $71,053 |
| Long-term Liabilities | $0 | $0 | $0 | $0 | $0 |
| Total Liabilities | $74,295 | $39,556 | $48,923 | $57,285 | $71,053 |
| Paid-in Capital | $77,500 | $77,500 | $77,500 | $77,500 | $77,500 |
| Retained Earnings | ($37,500) | $30,789 | $117,190 | $222,040 | $422,676 |
| Earnings | $68,289 | $86,400 | $104,851 | $200,635 | $291,263 |
| Total Capital | $108,289 | $194,690 | $299,540 | $500,176 | $791,439 |
| Total Liabilities and Capital | $182,584 | $234,245 | $348,463 | $557,460 | $862,492 |
| Net Worth | $108,289 | $194,690 | $299,540 | $500,176 | $791,439 |
Business Ratios
The business will have higher SGA expenses as a ratio of sales compared to the carpet and upholstery cleaning industry as it requires a more professional, senior-level staff during its first years of operation. These years are key to establishing the systems and procedures which can be scaled for expansion. SGA as a percentage of sales will drop to lower than the industry average after this expansion due to the reduction in staff and office overhead allowed by its Web-based sales model. Savings from this will be put into advertising to support the rapid growth of the business.
| Ratio Analysis | ||||||
| Year 1 | Year 2 | Year 3 | Year 4 | Year 5 | Industry Profile | |
| Sales Growth | n.a. | 25.00% | 25.00% | 25.00% | 25.00% | -0.71% |
| Percent of Total Assets | ||||||
| Other Current Assets | 0.00% | 0.00% | 0.00% | 0.00% | 0.00% | 53.59% |
| Total Current Assets | 77.00% | 73.53% | 77.04% | 83.50% | 89.33% | 70.11% |
| Long-term Assets | 23.00% | 26.47% | 22.96% | 16.50% | 10.67% | 29.89% |
| Total Assets | 100.00% | 100.00% | 100.00% | 100.00% | 100.00% | 100.00% |
| Current Liabilities | 40.69% | 16.89% | 14.04% | 10.28% | 8.24% | 37.94% |
| Long-term Liabilities | 0.00% | 0.00% | 0.00% | 0.00% | 0.00% | 54.53% |
| Total Liabilities | 40.69% | 16.89% | 14.04% | 10.28% | 8.24% | 92.47% |
| Net Worth | 59.31% | 83.11% | 85.96% | 89.72% | 91.76% | 7.53% |
| Percent of Sales | ||||||
| Sales | 100.00% | 100.00% | 100.00% | 100.00% | 100.00% | 100.00% |
| Gross Margin | 64.61% | 64.61% | 64.61% | 64.61% | 64.61% | 59.56% |
| Selling, General & Administrative Expenses | 53.04% | 52.90% | 53.24% | 47.20% | 44.39% | 28.35% |
| Advertising Expenses | 10.17% | 9.49% | 8.68% | 7.81% | 6.94% | 1.21% |
| Profit Before Interest and Taxes | 16.65% | 16.73% | 16.24% | 24.87% | 28.88% | 8.19% |
| Main Ratios | ||||||
| Current | 1.89 | 4.35 | 5.49 | 8.13 | 10.84 | 1.24 |
| Quick | 1.89 | 4.35 | 5.49 | 8.13 | 10.84 | 1.18 |
| Total Debt to Total Assets | 40.69% | 16.89% | 14.04% | 10.28% | 8.24% | 92.47% |
| Pre-tax Return on Net Worth | 90.09% | 63.40% | 50.01% | 57.30% | 52.57% | 696.24% |
| Pre-tax Return on Assets | 53.43% | 52.69% | 42.98% | 51.42% | 48.24% | 52.41% |
| Additional Ratios | Year 1 | Year 2 | Year 3 | Year 4 | Year 5 | |
| Net Profit Margin | 11.57% | 11.71% | 11.37% | 17.41% | 20.22% | n.a |
| Return on Equity | 63.06% | 44.38% | 35.00% | 40.11% | 36.80% | n.a |
| Activity Ratios | ||||||
| Accounts Payable Turnover | 5.09 | 12.17 | 12.17 | 12.17 | 12.17 | n.a |
| Payment Days | 28 | 43 | 27 | 28 | 27 | n.a |
| Total Asset Turnover | 3.23 | 3.15 | 2.65 | 2.07 | 1.67 | n.a |
| Debt Ratios | ||||||
| Debt to Net Worth | 0.69 | 0.20 | 0.16 | 0.11 | 0.09 | n.a |
| Current Liab. to Liab. | 1.00 | 1.00 | 1.00 | 1.00 | 1.00 | n.a |
| Liquidity Ratios | ||||||
| Net Working Capital | $66,289 | $132,690 | $219,540 | $408,176 | $699,439 | n.a |
| Interest Coverage | 142.90 | 0.00 | 0.00 | 0.00 | 0.00 | n.a |
| Additional Ratios | ||||||
| Assets to Sales | 0.31 | 0.32 | 0.38 | 0.48 | 0.60 | n.a |
| Current Debt/Total Assets | 41% | 17% | 14% | 10% | 8% | n.a |
| Acid Test | 1.89 | 4.35 | 5.49 | 8.13 | 10.84 | n.a |
| Sales/Net Worth | 5.45 | 3.79 | 3.08 | 2.30 | 1.82 | n.a |
| Dividend Payout | 0.00 | 0.00 | 0.00 | 0.00 | 0.00 | n.a |
Long-term Plan
The business’s financial strategy is to grow rapidly to the point where its investment in its website and infrastructure can be shown to provide much greater revenue than that of the competition’s more traditional approach of working with salaried salespeople. At this point, the business will present a viable model for a second round of equity financing to move towards a regional and then statewide franchise. At this point there will be the potential for initial investors to cash out of the business.
Brought to you by
Create a professional business plan
Using AI and step-by-step instructions
Create Your PlanSecure funding
Validate ideas
Build a strategy
Appendix
| Sales Forecast | |||||||||||||
| Month 1 | Month 2 | Month 3 | Month 4 | Month 5 | Month 6 | Month 7 | Month 8 | Month 9 | Month 10 | Month 11 | Month 12 | ||
| Unit Sales | |||||||||||||
| Carpet Cleaning | 60 | 74 | 92 | 114 | 142 | 176 | 218 | 270 | 335 | 416 | 516 | 639 | |
| Furniture Cleaning | 40 | 50 | 64 | 80 | 101 | 127 | 160 | 202 | 254 | 320 | 404 | 508 | |
| Intensive Spot Treatment | 60 | 74 | 92 | 114 | 142 | 176 | 218 | 270 | 335 | 416 | 516 | 639 | |
| Area Rugs | 20 | 26 | 34 | 44 | 57 | 74 | 96 | 125 | 163 | 212 | 276 | 358 | |
| Other Services | 20 | 26 | 34 | 44 | 57 | 74 | 96 | 125 | 163 | 212 | 276 | 358 | |
| Total Unit Sales | 200 | 251 | 316 | 397 | 499 | 627 | 789 | 994 | 1,251 | 1,576 | 1,986 | 2,504 | |
| Unit Prices | Month 1 | Month 2 | Month 3 | Month 4 | Month 5 | Month 6 | Month 7 | Month 8 | Month 9 | Month 10 | Month 11 | Month 12 | |
| Carpet Cleaning | $100.00 | $100.00 | $100.00 | $100.00 | $100.00 | $100.00 | $100.00 | $100.00 | $100.00 | $100.00 | $100.00 | $100.00 | |
| Furniture Cleaning | $25.00 | $25.00 | $25.00 | $25.00 | $25.00 | $25.00 | $25.00 | $25.00 | $25.00 | $25.00 | $25.00 | $25.00 | |
| Intensive Spot Treatment | $50.00 | $50.00 | $50.00 | $50.00 | $50.00 | $50.00 | $50.00 | $50.00 | $50.00 | $50.00 | $50.00 | $50.00 | |
| Area Rugs | $25.00 | $25.00 | $25.00 | $25.00 | $25.00 | $25.00 | $25.00 | $25.00 | $25.00 | $25.00 | $25.00 | $25.00 | |
| Other Services | $25.00 | $25.00 | $25.00 | $25.00 | $25.00 | $25.00 | $25.00 | $25.00 | $25.00 | $25.00 | $25.00 | $25.00 | |
| Sales | |||||||||||||
| Carpet Cleaning | $6,000 | $7,440 | $9,226 | $11,440 | $14,186 | $17,591 | $21,813 | $27,048 | $33,540 | $41,590 | $51,572 | $63,949 | |
| Furniture Cleaning | $1,000 | $1,260 | $1,588 | $2,001 | $2,521 | $3,176 | $4,002 | $5,043 | $6,354 | $8,006 | $10,088 | $12,711 | |
| Intensive Spot Treatment | $3,000 | $3,720 | $4,613 | $5,720 | $7,093 | $8,795 | $10,906 | $13,523 | $16,769 | $20,794 | $25,785 | $31,973 | |
| Area Rugs | $500 | $650 | $845 | $1,098 | $1,427 | $1,855 | $2,412 | $3,136 | $4,077 | $5,300 | $6,890 | $8,957 | |
| Other Services | $500 | $650 | $845 | $1,098 | $1,427 | $1,855 | $2,412 | $3,136 | $4,077 | $5,300 | $6,890 | $8,957 | |
| Total Sales | $11,000 | $13,720 | $17,117 | $21,357 | $26,654 | $33,272 | $41,545 | $51,886 | $64,817 | $80,990 | $101,225 | $126,547 | |
| Direct Unit Costs | Month 1 | Month 2 | Month 3 | Month 4 | Month 5 | Month 6 | Month 7 | Month 8 | Month 9 | Month 10 | Month 11 | Month 12 | |
| Carpet Cleaning | 30.00% | $30.00 | $30.00 | $30.00 | $30.00 | $30.00 | $30.00 | $30.00 | $30.00 | $30.00 | $30.00 | $30.00 | $30.00 |
| Furniture Cleaning | 30.00% | $7.50 | $7.50 | $7.50 | $7.50 | $7.50 | $7.50 | $7.50 | $7.50 | $7.50 | $7.50 | $7.50 | $7.50 |
| Intensive Spot Treatment | 45.00% | $22.50 | $22.50 | $22.50 | $22.50 | $22.50 | $22.50 | $22.50 | $22.50 | $22.50 | $22.50 | $22.50 | $22.50 |
| Area Rugs | 39.00% | $9.75 | $9.75 | $9.75 | $9.75 | $9.75 | $9.75 | $9.75 | $9.75 | $9.75 | $9.75 | $9.75 | $9.75 |
| Other Services | 45.00% | $11.25 | $11.25 | $11.25 | $11.25 | $11.25 | $11.25 | $11.25 | $11.25 | $11.25 | $11.25 | $11.25 | $11.25 |
| Direct Cost of Sales | |||||||||||||
| Carpet Cleaning | $1,800 | $2,232 | $2,768 | $3,432 | $4,256 | $5,277 | $6,544 | $8,114 | $10,062 | $12,477 | $15,472 | $19,185 | |
| Furniture Cleaning | $300 | $378 | $476 | $600 | $756 | $953 | $1,201 | $1,513 | $1,906 | $2,402 | $3,026 | $3,813 | |
| Intensive Spot Treatment | $1,350 | $1,674 | $2,076 | $2,574 | $3,192 | $3,958 | $4,908 | $6,085 | $7,546 | $9,357 | $11,603 | $14,388 | |
| Area Rugs | $195 | $254 | $330 | $428 | $557 | $723 | $941 | $1,223 | $1,590 | $2,067 | $2,687 | $3,493 | |
| Other Services | $225 | $293 | $380 | $494 | $642 | $835 | $1,085 | $1,411 | $1,835 | $2,385 | $3,101 | $4,031 | |
| Subtotal Direct Cost of Sales | $3,870 | $4,830 | $6,030 | $7,529 | $9,403 | $11,746 | $14,678 | $18,347 | $22,939 | $28,688 | $35,889 | $44,910 | |
| Personnel Plan | |||||||||||||
| Month 1 | Month 2 | Month 3 | Month 4 | Month 5 | Month 6 | Month 7 | Month 8 | Month 9 | Month 10 | Month 11 | Month 12 | ||
| CEO | $5,000 | $5,000 | $5,000 | $5,000 | $5,000 | $5,000 | $5,000 | $5,000 | $5,000 | $5,000 | $5,000 | $5,000 | |
| COO | $5,000 | $5,000 | $5,000 | $5,000 | $5,000 | $5,000 | $5,000 | $5,000 | $5,000 | $5,000 | $5,000 | $5,000 | |
| Administrative Assistant/ Manager | $0 | $0 | $0 | $0 | $0 | $0 | $3,000 | $3,000 | $3,000 | $3,000 | $3,000 | $3,000 | |
| Administrative Assistant 2 | $0 | $0 | $0 | $0 | $0 | $0 | $0 | $0 | $0 | $0 | $0 | $0 | |
| Total People | 2 | 2 | 2 | 2 | 2 | 2 | 3 | 3 | 3 | 3 | 3 | 3 | |
| Total Payroll | $10,000 | $10,000 | $10,000 | $10,000 | $10,000 | $10,000 | $13,000 | $13,000 | $13,000 | $13,000 | $13,000 | $13,000 | |
| Pro Forma Profit and Loss | |||||||||||||
| Month 1 | Month 2 | Month 3 | Month 4 | Month 5 | Month 6 | Month 7 | Month 8 | Month 9 | Month 10 | Month 11 | Month 12 | ||
| Sales | $11,000 | $13,720 | $17,117 | $21,357 | $26,654 | $33,272 | $41,545 | $51,886 | $64,817 | $80,990 | $101,225 | $126,547 | |
| Direct Cost of Sales | $3,870 | $4,830 | $6,030 | $7,529 | $9,403 | $11,746 | $14,678 | $18,347 | $22,939 | $28,688 | $35,889 | $44,910 | |
| Other Costs of Sales | $0 | $0 | $0 | $0 | $0 | $0 | $0 | $0 | $0 | $0 | $0 | $0 | |
| Total Cost of Sales | $3,870 | $4,830 | $6,030 | $7,529 | $9,403 | $11,746 | $14,678 | $18,347 | $22,939 | $28,688 | $35,889 | $44,910 | |
| Gross Margin | $7,130 | $8,890 | $11,087 | $13,828 | $17,251 | $21,526 | $26,867 | $33,539 | $41,878 | $52,302 | $65,336 | $81,637 | |
| Gross Margin % | 64.82% | 64.80% | 64.77% | 64.75% | 64.72% | 64.70% | 64.67% | 64.64% | 64.61% | 64.58% | 64.55% | 64.51% | |
| Expenses | |||||||||||||
| Payroll | $10,000 | $10,000 | $10,000 | $10,000 | $10,000 | $10,000 | $13,000 | $13,000 | $13,000 | $13,000 | $13,000 | $13,000 | |
| Marketing/Promotion | $5,000 | $5,000 | $5,000 | $5,000 | $5,000 | $5,000 | $5,000 | $5,000 | $5,000 | $5,000 | $5,000 | $5,000 | |
| Depreciation | $500 | $500 | $500 | $500 | $500 | $500 | $500 | $500 | $500 | $500 | $500 | $500 | |
| Rent | $500 | $500 | $500 | $500 | $500 | $500 | $1,200 | $1,200 | $1,200 | $1,200 | $1,200 | $1,200 | |
| Utilities | $50 | $50 | $50 | $50 | $50 | $50 | $150 | $150 | $150 | $150 | $150 | $150 | |
| Insurance | $200 | $200 | $200 | $200 | $200 | $200 | $400 | $400 | $400 | $400 | $400 | $400 | |
| Payroll Taxes | 15% | $2,081 | $2,225 | $2,404 | $2,629 | $2,910 | $3,262 | $4,152 | $4,702 | $5,391 | $6,253 | $7,333 | $8,686 |
| Website Maintenance/Hosting | 15% | $500 | $500 | $500 | $500 | $500 | $500 | $500 | $500 | $500 | $500 | $500 | $500 |
| Other | $500 | $500 | $500 | $500 | $500 | $500 | $500 | $500 | $500 | $500 | $500 | $500 | |
| Total Operating Expenses | $19,331 | $19,475 | $19,654 | $19,879 | $20,160 | $20,512 | $25,402 | $25,952 | $26,641 | $27,503 | $28,583 | $29,936 | |
| Profit Before Interest and Taxes | ($12,201) | ($10,585) | ($8,567) | ($6,051) | ($2,909) | $1,014 | $1,465 | $7,587 | $15,237 | $24,799 | $36,753 | $51,701 | |
| EBITDA | ($11,701) | ($10,085) | ($8,067) | ($5,551) | ($2,409) | $1,514 | $1,965 | $8,087 | $15,737 | $25,299 | $37,253 | $52,201 | |
| Interest Expense | $115 | $104 | $94 | $83 | $73 | $63 | $52 | $42 | $31 | $21 | $10 | $0 | |
| Taxes Incurred | ($3,695) | ($3,207) | ($2,598) | ($1,840) | ($895) | $285 | $424 | $2,264 | $4,562 | $7,433 | $11,023 | $15,510 | |
| Net Profit | ($8,621) | ($7,482) | ($6,063) | ($4,294) | ($2,087) | $666 | $989 | $5,282 | $10,644 | $17,344 | $25,720 | $36,191 | |
| Net Profit/Sales | -78.37% | -54.53% | -35.42% | -20.11% | -7.83% | 2.00% | 2.38% | 10.18% | 16.42% | 21.42% | 25.41% | 28.60% | |
| Pro Forma Cash Flow | |||||||||||||
| Month 1 | Month 2 | Month 3 | Month 4 | Month 5 | Month 6 | Month 7 | Month 8 | Month 9 | Month 10 | Month 11 | Month 12 | ||
| Cash Received | |||||||||||||
| Cash from Operations | |||||||||||||
| Cash Sales | $11,000 | $13,720 | $17,117 | $21,357 | $26,654 | $33,272 | $41,545 | $51,886 | $64,817 | $80,990 | $101,225 | $126,547 | |
| Subtotal Cash from Operations | $11,000 | $13,720 | $17,117 | $21,357 | $26,654 | $33,272 | $41,545 | $51,886 | $64,817 | $80,990 | $101,225 | $126,547 | |
| Additional Cash Received | |||||||||||||
| Sales Tax, VAT, HST/GST Received | 0.00% | $0 | $0 | $0 | $0 | $0 | $0 | $0 | $0 | $0 | $0 | $0 | $0 |
| New Current Borrowing | $0 | $0 | $0 | $0 | $0 | $0 | $0 | $0 | $0 | $0 | $0 | $0 | |
| New Other Liabilities (interest-free) | $0 | $0 | $0 | $0 | $0 | $0 | $0 | $0 | $0 | $0 | $0 | $0 | |
| New Long-term Liabilities | $0 | $0 | $0 | $0 | $0 | $0 | $0 | $0 | $0 | $0 | $0 | $0 | |
| Sales of Other Current Assets | $0 | $0 | $0 | $0 | $0 | $0 | $0 | $0 | $0 | $0 | $0 | $0 | |
| Sales of Long-term Assets | $0 | $0 | $0 | $0 | $0 | $0 | $0 | $0 | $0 | $0 | $0 | $0 | |
| New Investment Received | $0 | $0 | $0 | $0 | $0 | $0 | $0 | $0 | $0 | $0 | $0 | $0 | |
| Subtotal Cash Received | $11,000 | $13,720 | $17,117 | $21,357 | $26,654 | $33,272 | $41,545 | $51,886 | $64,817 | $80,990 | $101,225 | $126,547 | |
| Expenditures | Month 1 | Month 2 | Month 3 | Month 4 | Month 5 | Month 6 | Month 7 | Month 8 | Month 9 | Month 10 | Month 11 | Month 12 | |
| Expenditures from Operations | |||||||||||||
| Cash Spending | $10,000 | $10,000 | $10,000 | $10,000 | $10,000 | $10,000 | $13,000 | $13,000 | $13,000 | $13,000 | $13,000 | $13,000 | |
| Bill Payments | $5,304 | $9,173 | $10,768 | $12,762 | $15,254 | $18,370 | $22,271 | $27,258 | $33,356 | $40,989 | $50,541 | $62,500 | |
| Subtotal Spent on Operations | $15,304 | $19,173 | $20,768 | $22,762 | $25,254 | $28,370 | $35,271 | $40,258 | $46,356 | $53,989 | $63,541 | $75,500 | |
| Additional Cash Spent | |||||||||||||
| Sales Tax, VAT, HST/GST Paid Out | $0 | $0 | $0 | $0 | $0 | $0 | $0 | $0 | $0 | $0 | $0 | $0 | |
| Principal Repayment of Current Borrowing | $0 | $0 | $0 | $0 | $0 | $0 | $0 | $0 | $0 | $0 | $0 | $0 | |
| Other Liabilities Principal Repayment | $0 | $0 | $0 | $0 | $0 | $0 | $0 | $0 | $0 | $0 | $0 | $0 | |
| Long-term Liabilities Principal Repayment | $1,250 | $1,250 | $1,250 | $1,250 | $1,250 | $1,250 | $1,250 | $1,250 | $1,250 | $1,250 | $1,250 | $1,250 | |
| Purchase Other Current Assets | $0 | $0 | $0 | $0 | $0 | $0 | $0 | $0 | $0 | $0 | $0 | $0 | |
| Purchase Long-term Assets | $0 | $0 | $0 | $0 | $0 | $0 | $3,000 | $0 | $15,000 | $0 | $0 | $0 | |
| Dividends | $0 | $0 | $0 | $0 | $0 | $0 | $0 | $0 | $0 | $0 | $0 | $0 | |
| Subtotal Cash Spent | $16,554 | $20,423 | $22,018 | $24,012 | $26,504 | $29,620 | $39,521 | $41,508 | $62,606 | $55,239 | $64,791 | $76,750 | |
| Net Cash Flow | ($5,554) | ($6,703) | ($4,901) | ($2,655) | $150 | $3,652 | $2,024 | $10,378 | $2,211 | $25,751 | $36,434 | $49,797 | |
| Cash Balance | $24,446 | $17,743 | $12,842 | $10,187 | $10,337 | $13,988 | $16,013 | $26,391 | $28,601 | $54,353 | $90,787 | $140,584 | |
| Pro Forma Balance Sheet | |||||||||||||
| Month 1 | Month 2 | Month 3 | Month 4 | Month 5 | Month 6 | Month 7 | Month 8 | Month 9 | Month 10 | Month 11 | Month 12 | ||
| Assets | Starting Balances | ||||||||||||
| Current Assets | |||||||||||||
| Cash | $30,000 | $24,446 | $17,743 | $12,842 | $10,187 | $10,337 | $13,988 | $16,013 | $26,391 | $28,601 | $54,353 | $90,787 | $140,584 |
| Other Current Assets | $0 | $0 | $0 | $0 | $0 | $0 | $0 | $0 | $0 | $0 | $0 | $0 | $0 |
| Total Current Assets | $30,000 | $24,446 | $17,743 | $12,842 | $10,187 | $10,337 | $13,988 | $16,013 | $26,391 | $28,601 | $54,353 | $90,787 | $140,584 |
| Long-term Assets | |||||||||||||
| Long-term Assets | $30,000 | $30,000 | $30,000 | $30,000 | $30,000 | $30,000 | $30,000 | $33,000 | $33,000 | $48,000 | $48,000 | $48,000 | $48,000 |
| Accumulated Depreciation | $0 | $500 | $1,000 | $1,500 | $2,000 | $2,500 | $3,000 | $3,500 | $4,000 | $4,500 | $5,000 | $5,500 | $6,000 |
| Total Long-term Assets | $30,000 | $29,500 | $29,000 | $28,500 | $28,000 | $27,500 | $27,000 | $29,500 | $29,000 | $43,500 | $43,000 | $42,500 | $42,000 |
| Total Assets | $60,000 | $53,946 | $46,743 | $41,342 | $38,187 | $37,837 | $40,988 | $45,513 | $55,391 | $72,101 | $97,353 | $133,287 | $182,584 |
| Liabilities and Capital | Month 1 | Month 2 | Month 3 | Month 4 | Month 5 | Month 6 | Month 7 | Month 8 | Month 9 | Month 10 | Month 11 | Month 12 | |
| Current Liabilities | |||||||||||||
| Accounts Payable | $5,000 | $8,817 | $10,345 | $12,257 | $14,646 | $17,633 | $21,369 | $26,154 | $32,001 | $39,317 | $48,474 | $59,938 | $74,295 |
| Current Borrowing | $0 | $0 | $0 | $0 | $0 | $0 | $0 | $0 | $0 | $0 | $0 | $0 | $0 |
| Other Current Liabilities | $0 | $0 | $0 | $0 | $0 | $0 | $0 | $0 | $0 | $0 | $0 | $0 | $0 |
| Subtotal Current Liabilities | $5,000 | $8,817 | $10,345 | $12,257 | $14,646 | $17,633 | $21,369 | $26,154 | $32,001 | $39,317 | $48,474 | $59,938 | $74,295 |
| Long-term Liabilities | $15,000 | $13,750 | $12,500 | $11,250 | $10,000 | $8,750 | $7,500 | $6,250 | $5,000 | $3,750 | $2,500 | $1,250 | $0 |
| Total Liabilities | $20,000 | $22,567 | $22,845 | $23,507 | $24,646 | $26,383 | $28,869 | $32,404 | $37,001 | $43,067 | $50,974 | $61,188 | $74,295 |
| Paid-in Capital | $77,500 | $77,500 | $77,500 | $77,500 | $77,500 | $77,500 | $77,500 | $77,500 | $77,500 | $77,500 | $77,500 | $77,500 | $77,500 |
| Retained Earnings | ($37,500) | ($37,500) | ($37,500) | ($37,500) | ($37,500) | ($37,500) | ($37,500) | ($37,500) | ($37,500) | ($37,500) | ($37,500) | ($37,500) | ($37,500) |
| Earnings | $0 | ($8,621) | ($16,103) | ($22,165) | ($26,459) | ($28,547) | ($27,881) | ($26,892) | ($21,610) | ($10,966) | $6,379 | $32,099 | $68,289 |
| Total Capital | $40,000 | $31,379 | $23,897 | $17,835 | $13,541 | $11,453 | $12,119 | $13,108 | $18,390 | $29,034 | $46,379 | $72,099 | $108,289 |
| Total Liabilities and Capital | $60,000 | $53,946 | $46,743 | $41,342 | $38,187 | $37,837 | $40,988 | $45,513 | $55,391 | $72,101 | $97,353 | $133,287 | $182,584 |
| Net Worth | $40,000 | $31,379 | $23,897 | $17,835 | $13,541 | $11,453 | $12,119 | $13,108 | $18,390 | $29,034 | $46,379 | $72,099 | $108,289 |

