
Vashon Solicitation Services
Executive Summary
Introduction
It is the mission of Vashon Solicitation Services to provide clients with top quality call center services 24 hours-a-day. A service that provides our clients with the greatest chance of communicating with their end customers. We do B2B and B2C services including both inbound and outbound calls. We have a dedicated and well trained cadre of customer support specialists who are able to consistently provide excellent services delivered in a timely and cost-effective manner.
Whatever a client’s customer relations goals are: quantifying sales leads, taking orders, responding to ad inquiries, market research, or general information requests, VSS has the people with the expertise to professionally service those needs.
The Company
VSS will be a limited liability partnership registered in the state of Delaware for tax purposes. Its founder is Mr. Martin Gibbs, a former telemarketing head with Medfone, Inc. Mr. Gibbs has brought together a highly respected group of telemarketing and customer relations specialists who have a total of 35 years of combined experience with this industry.
The company has a limited number of private investors and does not plan to go public. The company has its main offices in Gig Harbor, Washington. The facilities include office spaces, conference rooms, and a phone center. The company expects to begin offering services in June of Year 1.
The Services
Vashon offers a wide range of call center service including both inbound and outbound calls. We provide bilingual services in both english and spanish. The most common needs that we can fulfill are:
- Generate sales leads
- Set appointments
- Market research
- Surveys (including statistical analysis and political surveys)
- First level help desk
- Database or mailing list information
- Business development
- Point-of-sale product promotion
- Seminar and conference invitations
VSS is not a telemarketing company, we do not create the marketing campaigns for our clients. Experience has shown that many companies desire to create their own marketing campaign since they already have marketing personnel with extensive contact and experience in the industry.
The Market
The telemarketing industry is a growing industry with most companies having an annual growth between 6.5% and 8%. This is due to businesses that are becoming increasingly aware of the need for market information and the desire to reduce customer turnover rates in a hard hit economy. A significant trend in this industry is the growing number of clients who wish to outsource telemarketing functions to client companies instead of developing such infrastructure in-house. This makes for an excellent opportunity for VSS. However, long-term analysis of growth rates in this industry show a cyclical pattern and VSS does not expect this high growth rate to continue.
VSS plans to enter into two market segments. First, we will work in the medical services industry since they have a high need to maintain contact with their patients at all times. We will also be working as a first level help desk for a number of small high-tech companies, and be taking on short-term projects such as surveys from small clients.
Financial Considerations
Start-up assets required are shown in the tables accompanying the Start-up Summary topic. This includes expenses and the cash needed to support operations until revenues reach an acceptable level. Most of the company’s liabilities will come from outside private investors and management investment, however, we have obtained current borrowing from Bank of America Commercial Investments, the principal to be paid off in two years. A long-term loan through Charter Bank of Tillamook will be paid off in ten years. We also have a line of credit from Viking Bank that we can draw upon if need be.
The company expects to reach profitability in year two and does not anticipate any serious cash flow problems. We conservatively believe that during the first three years that about three ongoing contracts per month will guarantee a break-even point.

1.1 Keys to Success
Vashon’s keys to long-term survivability and profitability are:
- Create long-term contracts that demand constant monitoring or on-call services.
- Keeping close contact with clients and establishing a well functioning long-term relationship with them to generate repeat business and obtain a top notch reputation.
- Establish a comprehensive service experience for our clients that includes consultation, progress reports and post-program feedback.
1.2 Mission
It is the mission of VSS to provide our clients with top quality call center services 24 hours-a-day that provide the greatest chance of communicating with end customers. We do B2B and B2C services including both inbound and outbound calls. We have a dedicated and well trained cadre of customer support specialists who are able to consistently provide excellent services delivered in a timely and cost-effective manner.
Whatever a client’s customer relations goals are: quantifying sales leads, taking orders, responding to ad inquiries, market research, or general information requests, VSS has the people with the expertise to professionally service your needs.
1.3 Objectives
The three year goals for Vashon Solicitation Services LLC (VSS) are:
- Achieve break-even by year two.
- Establish long-term contracts with at least four clients.
- Establish minimum 95% customer satisfaction rate to form long-term relationships with our clients and create word of mouth marketing.
Company Summary
VSS will be a limited liability partnership registered in the state of Delaware for tax purposes. Its founder is Mr. Martin Gibbs, a former telemarketing head with Medfone, Inc. Mr. Gibbs has brought together a highly respected group of telemarketing and customer relations specialists who have a total of 35 years of combined experience with this industry.
The company has a limited number of private investors and does not plan to go public. The company has its main offices in Gig Harbor, Washington. The facilities include office spaces, conference rooms, and a phone center. The company expects to begin offering its services in June of Year 1.
The company’s main clients will be companies that require high amounts of communication between themselves and their clients. This includes medical services, and companies that wish to outsource first-level help desk support. By focusing on institutions such as these that have special needs, we believe we will be able to better serve our clients and produce a superior service that is more effective that other call center firms.
2.1 Start-up Summary
Start-up assets required are shown in the tables below. This includes expenses and the cash needed to support operations until revenues reach an acceptable level. Most of the company’s liabilities will come from outside private investors and management investment, however, we have obtained current borrowing from Bank of America Commercial Investments, the principal to be paid off in two years. A long-term loan through Charter Bank of Tillamook will be paid off in ten years.We also have a line of credit from Viking Bank that we can draw upon if need be.

| Start-up | |
| Requirements | |
| Start-up Expenses | |
| Legal | $2,000 |
| Insurance | $1,000 |
| utilities | $200 |
| Rent | $3,000 |
| Accounting and bookkeeping fees | $2,000 |
| Expensed equipment | $8,000 |
| Advertising | $3,500 |
| Other | $8,000 |
| Total Start-up Expenses | $27,700 |
| Start-up Assets | |
| Cash Required | $117,800 |
| Other Current Assets | $3,500 |
| Long-term Assets | $25,000 |
| Total Assets | $146,300 |
| Total Requirements | $174,000 |
| Start-up Funding | |
| Start-up Expenses to Fund | $27,700 |
| Start-up Assets to Fund | $146,300 |
| Total Funding Required | $174,000 |
| Assets | |
| Non-cash Assets from Start-up | $28,500 |
| Cash Requirements from Start-up | $117,800 |
| Additional Cash Raised | $0 |
| Cash Balance on Starting Date | $117,800 |
| Total Assets | $146,300 |
| Liabilities and Capital | |
| Liabilities | |
| Current Borrowing | $16,000 |
| Long-term Liabilities | $55,000 |
| Accounts Payable (Outstanding Bills) | $3,000 |
| Other Current Liabilities (interest-free) | $0 |
| Total Liabilities | $74,000 |
| Capital | |
| Planned Investment | |
| Mr. Martin Gibbs | $25,000 |
| Ms. Mary Stuart | $20,000 |
| Mr. Henry Hannover | $20,000 |
| Mr. Nicolas Caput | $8,000 |
| Others | $27,000 |
| Additional Investment Requirement | $0 |
| Total Planned Investment | $100,000 |
| Loss at Start-up (Start-up Expenses) | ($27,700) |
| Total Capital | $72,300 |
| Total Capital and Liabilities | $146,300 |
| Total Funding | $174,000 |

2.2 Company Ownership
The company will have a number of outside private investors who will own 27% of the company’s shares. The rest will be owned by the senior management including Mr. Martin Gibbs, (25%), Ms. Mary Stuart (20%), Mr. Henry Hannover, (20%), and Mr. Nicholas Caput (8%). All other financing will come from loans.
Services
Vashon offers a wide range of call center service including both inbound and outbound calls. We provide bilingual services in both english and spanish. The most common needs for call centers are:
- Generate sales leads
- Set appointments
- Market research
- Surveys (including statistical analysis and political surveys)
- First level help desk
- Database or mailing list information
- Business development
- Point-of-sale product promotion
- Seminar and conference invitations
VSS is not a telemarketing company we do not create the marketing campaigns for our clients. Experience has shown that many companies desire to create their own marketing campaign since they already have marketing personnel with extensive contact and experience in the industry. However, the costs of carrying out such a telemarketing campaign can be prohibitive and often the firm does not wish to develop the infrastructure to do so. This requires developing different skills and core competencies that divert management and resources from their primary duties. This is where VSS comes in. We either connect a prospective client with a telemarketing company (we have arrangements and contacts with three such consulting firms) or once such a campaign is designed we implement it for our clients. We work closely with our clients in the creation of the campaign’s goals, scope, length, and costs so has to create as close a fit between the client needs and our capabilities.
Market Analysis Summary
The telemarketing industry is a growing industry with most companies having an annual growth between 6.5% and 8%. This is due to businesses that are becoming increasingly aware of the need for market information and the desire to reduce customer turnover rates in a hard hit economy. A significant trend in this industry is the growing number of clients who wish to outsource telemarketing functions to client companies instead of developing such infrastructure in-house. This makes for an excellent opportunity for VSS. However, long-term analysis of growth rates in this industry show a cyclical pattern and VSS does not expect this high growth rate to continue.
The telemarketing industry is quite fragmented with companies that vary greatly in size, scope, services offered, and market share. Many companies are general advertising agencies that offer telemarketing services along with a wide range of other consulting services. In addition, many companies, still not realizing the potential advantages of outsourcing, choose to develop their own telemarketing services.
VSS plans to enter into two market segments. First, we will work in the medical services industry since they have a high need to maintain contact with their patients at all times. We also will be working as a first level help desk for a number of small high-tech companies. Mr. Gibbs and Ms. Stuart have already signed contracts with Evergreen Medical and Sno-net, Inc. to serve in these capacities. We will also be taking on short-term projects, such as surveys, from small clients.
4.1 Market Segmentation
Virtually every company, both large and small require some form of telemarketing at some point. Often it is a survey to determine customer satisfaction or awareness. Sometimes it is effectively communicating an upcoming event such as a conference.
Other companies wish to know if telemarketing is a feasible method of sales generation. One of the new uses for call centers is in first level help desk services. About 75-80% of all technical problems faced by end customers can be solved by non-technical customer service representatives who are familiar with a computer or technical system and who have a scripted set of procedures to solve most common occuring problems. This is where an outsourced call center can save a client a large amount of money and allow a reduction in personnel needed on call 24 hours-a-day.
VSS plans to enter into two market segments. First, we will work in the medical services industry since they have a high need to maintain contact with their patients at all times. We also will be working as a first level help desk for a number of small high-tech companies.
Mr. Gibbs and Ms. Stuart have already signed contracts with Evergreen Medical and Sno-net, Inc. to serve in these capacities. Our customer service representatives are already in the process of receiving hands-on training from these two companies to meet their needs. We will also be taking on short-term projects such as surveys from small clients.
Once we have established a good working relationship with these initial clients, we will leverage our reputation and profitability into new contacts and contracts with other local companies. Our ultimate goal is to service the entire west coast region and become the company with a dominant market share.
The market analysis table and graph which follows shows the number of businesses within the state of Washington. This will be our initial geographical focus for the first four to five years of our company’s existance. Later, as we expand to a west coast scope, our future business plans will include all of our potential clients in this area.

| Market Analysis | |||||||
| Year 1 | Year 2 | Year 3 | Year 4 | Year 5 | |||
| Potential Customers | Growth | CAGR | |||||
| High-tech companies | 2% | 400 | 408 | 416 | 424 | 432 | 1.94% |
| Medical companies | 3% | 350 | 361 | 372 | 383 | 394 | 3.00% |
| Other | 3% | 2,200 | 2,266 | 2,334 | 2,404 | 2,476 | 3.00% |
| Total | 2.86% | 2,950 | 3,035 | 3,122 | 3,211 | 3,302 | 2.86% |
4.2 Service Business Analysis
The telemarketing industry is a growing industry with most companies having an annual growth between 6.5% and 8%. This is due to businesses that are becoming increasingly aware of the need for market information and the desire to reduce customer turnover rates in a hard hit economy. However, long-term analysis of growth rates in this industry show a cyclical pattern and VSS does not expect this high growth rate to continue.
The telemarketing industry is quite fragmented with companies that vary greatly in size, scope, services offered, and market share. Many companies are general advertising agencies that offer telemarketing services along with a wide range of other consulting services. In addition, many companies, not realizing the potential advantages of outsourcing, choose to develop their own telemarketing services.
VSS believes that the greatest threat at the moment is in new entrants to the market who perceive an opportunity in a “high” growth industry. The most likely entrants will be pre-existing advertising agencies wishing to horizontally integrate and enter new sub-markets.
The one major disadvantage to new entrants is that all firms engaged in contracting to telemarketing agencies face significant switching costs when bringing on a new partner. Furthermore, VSS understands that in this industry there is a significant learning curve that creates declining “unit” costs as a firm gains more cumulative experience in the field itself and with long-term clients specifically. Finally there are significant start-up costs associated with creating a call center.
Rivalry among different call center agencies is quite intense. The telemarketing industry as a whole is mature with long-term moderate growth. Most of the largest agencies are mutually dependent when it comes to jockeying for position and market share. The fact that there are so many diverse and seemingly “generic” or general telemarketing agencies makes this a cutthroat industry.
The threat of clients backwardly integrating so as to have all their advertising done in-house is one of the major factors that buyers use to indirectly control price in this industry, and increase competition among firms. This must always be foremost in the minds of Vashon’s management when offering services and setting prices.
4.2.1 Competition and Buying Patterns
Competition
Competition includes all potential call centers and telemarketing agencies across the country. In addition we have indirect competition from organizations that handle all their telemarketing in-house. Practically speaking, this means we have the greatest threat from the largest telemarketing agencies such as Crouch & Weasley, Berman Telemarketing, and other big, nationwide call center companies that hold significant market share. The call center industry is highly fragmented, with a large number of small companies that mainly cater to small firms and a few large companies that seek the largest contracts from companies such as Sprint, GM, etc. This makes competition within the industry very intense. Through our focused strategy of serving niche markets such as help desk services, we intend to avoid such a debilitating environment and avoid its drawbacks such as price wars, and etc.
Buying patterns and needs
Companies usually enter into contracts with call center firms based on their reputation of professionalism and effective campaigns in the past. This reputation is difficult to obtain by new firms unless its personnel bring it with them from previous companies such as ours. Price and scope are also important reasons for accepting contracts, especially if the company is small.
Strategy and Implementation Summary
Vashon Solicitation Services’ business strategy is to enter into a focused approach to its services rather than being everything to its clients. Our company does not intend to be a telemarketing consultation firm, nor will it ever become so. We are a call center firm that simply implements telemarketing campaigns or help desk functions for its clients. These services are where we can offer a higher standard of quality to our clients. This will allow us to charge a higher profit margin for these differentiated and more focused services.
5.1 Marketing Strategy
Vashon has already concluded two contracts with local companies requiring 24 hour call center services. These will provide us with initial revenue and the chance to build our reputation. Our company intends to use testimonials from such clients to build further contracts. We have begun to establish our presence using various marketing methods such as flyers, cold calls, B2B contacts, and we will be attending conventions and other events as well.
5.2 Sales Strategy
Vashon’s management will be focusing on leveraging its employee’s established reputations and contacts in the telemarketing industry to generate contracts. Both Mr. Gibbs and Mr. Hannover have been in the industry for many years and experience shows that many of their existing clients will still wish to work with them despite having to establish a new contract with VSS. We also understand that we may need to lower costs in our first couple of years in order to attract new customers and close deals.
In addition to our first contracts with Evergreen Medical and Sno-net, Inc. Mr. Hannover has been actively seeking to acquire a large contract with National Conventions & Events over the past seven months. This company is the largest event organizing firm on the West coast and has been seeking a call center firm for a customer survey project to be launched in the near future. VSS believes that its chances for acquiring this contract are excellent.
5.2.1 Sales Forecast
Sales are based on the various contract projects we anticipate acquiring in the various market segments. Revenues are based on average costs per project/contract based on estimated time and complexity of contract plus and undisclosed profit margin. The company does not have any significant direct costs of sales.
We anticipate that our most attractive target markets, medical services and help desk clients will provide us with significant early revenue. As time goes on, and we acquire more customers, the percentage of short-term and other projects will increase.
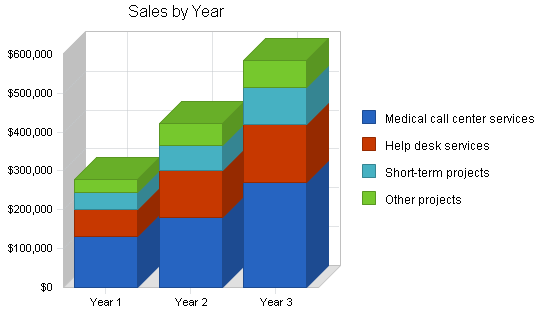
| Sales Forecast | |||
| Year 1 | Year 2 | Year 3 | |
| Sales | |||
| Medical call center services | $132,000 | $180,000 | $270,000 |
| Help desk services | $69,000 | $120,000 | $150,000 |
| Short-term projects | $43,500 | $65,000 | $96,000 |
| Other projects | $33,500 | $58,000 | $69,000 |
| Total Sales | $278,000 | $423,000 | $585,000 |
| Direct Cost of Sales | Year 1 | Year 2 | Year 3 |
| Row 1 | $0 | $0 | $0 |
| Other | $0 | $0 | $0 |
| Subtotal Direct Cost of Sales | $0 | $0 | $0 |
Management Summary
The company will have four officers including our president, Mr. Martin Gibbs. Our head of operations will be Mr. Nicholas Caput, plus 12 customer service representatives. Finances and general admin will be handled by Ms. Stuart.
The company plans to hire additional service representatives, and administrative personnel as we begin to get large numbers of contracts.
6.1 Personnel
Vashon’s management brings to the company strong capabilities in contract negotiation, project management, telemarketing, and a unique combination of skills drawn from other businesses.
Key Personnel
Mr. Martin Gibbs is a graduate of the University of Missouri where he obtained his business degree degree in 1971. Since then, Mr. Gibbs has had extensive experience in marketing, telemarketing, and project management. This includes experience in budgeting, project oversight, etc. In 1996 he obtained a graduate degree in marketing from University of Washington. Mr. Gibbs spent the last four years as the telemarketing department head with Medfone, Inc.
Mr. Nicholas Caput graduated from Arizona State University with a bachelors degree in marketing in 1975. From 1978-1988 Mr. Caput worked for Nelson Marketing Consultants. In 1989 he went to work for Anderson Consulting in their marketing division, where he worked as a project manager.
| Personnel Plan | |||
| Year 1 | Year 2 | Year 3 | |
| Mr. Martin Gibbs – President | $36,000 | $36,000 | $60,000 |
| Ms. Mary Stuart – Office Manager | $36,000 | $36,000 | $60,000 |
| Mr. Nicholas Caput – Operations | $36,000 | $36,000 | $36,000 |
| Customer service representatives | $101,050 | $203,000 | $203,000 |
| Total People | 19 | 27 | 27 |
| Total Payroll | $209,050 | $311,000 | $359,000 |
Financial Plan
Our financial plan anticipates two years of negative profits as we gain sales volume. We have budgeted enough investment to cover these losses and have an additional credit line available if sales do not match predictions.
7.1 Important Assumptions
We are assuming approximately 75% sales on credit and average interest rates of 10%. These are considered to be conservative in case our predictions are erroneous.
| General Assumptions | |||
| Year 1 | Year 2 | Year 3 | |
| Plan Month | 1 | 2 | 3 |
| Current Interest Rate | 10.00% | 10.00% | 10.00% |
| Long-term Interest Rate | 10.00% | 10.00% | 10.00% |
| Tax Rate | 30.00% | 30.00% | 30.00% |
| Other | 0 | 0 | 0 |
7.2 Break-even Analysis
Our break-even analysis is based on the assumptions that our gross margin is approximately 100%. In other words, we will have insignificant direct cost of sales. Since each contract will be of different scope, length, and complexity, it is difficult to assign and average per unit revenue figure. However, it is conservatively believed that during the first three years, average profitability per month per segment will be moderate. This is because we will be dealing with smaller companies at first that have smaller contracts. We expect that about three ongoing contracts per month will guarantee a break-even point.

| Break-even Analysis | |
| Monthly Revenue Break-even | $27,234 |
| Assumptions: | |
| Average Percent Variable Cost | 0% |
| Estimated Monthly Fixed Cost | $27,234 |
7.3 Projected Profit and Loss
The following table itemizes our revenues and associated costs. We expect to be paying higher costs in marketing and advertising than other companies as we attempt to build sales volume. As shown in the table in the Appendix, we expect monthly profits to begin in December 2003.


| Pro Forma Profit and Loss | |||
| Year 1 | Year 2 | Year 3 | |
| Sales | $278,000 | $423,000 | $585,000 |
| Direct Cost of Sales | $0 | $0 | $0 |
| Other Costs of Sales | $4,300 | $6,000 | $6,000 |
| Total Cost of Sales | $4,300 | $6,000 | $6,000 |
| Gross Margin | $273,700 | $417,000 | $579,000 |
| Gross Margin % | 98.45% | 98.58% | 98.97% |
| Expenses | |||
| Payroll | $209,050 | $311,000 | $359,000 |
| Sales and Marketing and Other Expenses | $18,000 | $10,000 | $10,000 |
| Depreciation | $0 | $0 | $2,500 |
| Rent | $18,000 | $18,000 | $18,000 |
| Utilities | $7,200 | $8,000 | $9,000 |
| Insurance | $13,200 | $14,000 | $15,000 |
| Payroll Taxes | $31,358 | $46,650 | $53,850 |
| Travel | $12,000 | $8,000 | $4,000 |
| Other | $18,000 | $15,000 | $15,000 |
| Total Operating Expenses | $326,808 | $430,650 | $486,350 |
| Profit Before Interest and Taxes | ($53,108) | ($13,650) | $92,650 |
| EBITDA | ($53,108) | ($13,650) | $95,150 |
| Interest Expense | $8,183 | $9,400 | $9,100 |
| Taxes Incurred | $0 | $0 | $25,065 |
| Net Profit | ($61,291) | ($23,050) | $58,485 |
| Net Profit/Sales | -22.05% | -5.45% | 10.00% |
7.4 Projected Cash Flow
The following is our cash flow chart and diagram. We do not expect to have any short-term cash flow problems even though we will be operating at a loss for the first nine months. Our short-term loan will be repaid in two equal payments in 2004-2005. Our long-term loan will be paid off in ten years.

| Pro Forma Cash Flow | |||
| Year 1 | Year 2 | Year 3 | |
| Cash Received | |||
| Cash from Operations | |||
| Cash Sales | $69,500 | $105,750 | $146,250 |
| Cash from Receivables | $159,050 | $291,458 | $409,934 |
| Subtotal Cash from Operations | $228,550 | $397,208 | $556,184 |
| Additional Cash Received | |||
| Sales Tax, VAT, HST/GST Received | $0 | $0 | $0 |
| New Current Borrowing | $20,000 | $6,000 | $0 |
| New Other Liabilities (interest-free) | $0 | $0 | $0 |
| New Long-term Liabilities | $0 | $0 | $0 |
| Sales of Other Current Assets | $0 | $0 | $0 |
| Sales of Long-term Assets | $0 | $0 | $0 |
| New Investment Received | $3,000 | $5,000 | $0 |
| Subtotal Cash Received | $251,550 | $408,208 | $556,184 |
| Expenditures | Year 1 | Year 2 | Year 3 |
| Expenditures from Operations | |||
| Cash Spending | $209,050 | $311,000 | $359,000 |
| Bill Payments | $121,806 | $135,385 | $162,552 |
| Subtotal Spent on Operations | $330,856 | $446,385 | $521,552 |
| Additional Cash Spent | |||
| Sales Tax, VAT, HST/GST Paid Out | $0 | $0 | $0 |
| Principal Repayment of Current Borrowing | $0 | $0 | $8,000 |
| Other Liabilities Principal Repayment | $0 | $0 | $0 |
| Long-term Liabilities Principal Repayment | $0 | $0 | $4,000 |
| Purchase Other Current Assets | $0 | $0 | $0 |
| Purchase Long-term Assets | $0 | $0 | $0 |
| Dividends | $0 | $0 | $0 |
| Subtotal Cash Spent | $330,856 | $446,385 | $533,552 |
| Net Cash Flow | ($79,306) | ($38,177) | $22,632 |
| Cash Balance | $38,494 | $317 | $22,949 |
7.5 Projected Balance Sheet
The following table shows the projected balance sheet for VSS.
| Pro Forma Balance Sheet | |||
| Year 1 | Year 2 | Year 3 | |
| Assets | |||
| Current Assets | |||
| Cash | $38,494 | $317 | $22,949 |
| Accounts Receivable | $49,450 | $75,242 | $104,058 |
| Other Current Assets | $3,500 | $3,500 | $3,500 |
| Total Current Assets | $91,444 | $79,059 | $130,507 |
| Long-term Assets | |||
| Long-term Assets | $25,000 | $25,000 | $25,000 |
| Accumulated Depreciation | $0 | $0 | $2,500 |
| Total Long-term Assets | $25,000 | $25,000 | $22,500 |
| Total Assets | $116,444 | $104,059 | $153,007 |
| Liabilities and Capital | Year 1 | Year 2 | Year 3 |
| Current Liabilities | |||
| Accounts Payable | $11,435 | $11,100 | $13,563 |
| Current Borrowing | $36,000 | $42,000 | $34,000 |
| Other Current Liabilities | $0 | $0 | $0 |
| Subtotal Current Liabilities | $47,435 | $53,100 | $47,563 |
| Long-term Liabilities | $55,000 | $55,000 | $51,000 |
| Total Liabilities | $102,435 | $108,100 | $98,563 |
| Paid-in Capital | $103,000 | $108,000 | $108,000 |
| Retained Earnings | ($27,700) | ($88,991) | ($112,041) |
| Earnings | ($61,291) | ($23,050) | $58,485 |
| Total Capital | $14,009 | ($4,041) | $54,444 |
| Total Liabilities and Capital | $116,444 | $104,059 | $153,007 |
| Net Worth | $14,009 | ($4,041) | $54,444 |
7.6 Business Ratios
We have included industry standard ratios from the telemarketing solicitation services industry to compare with ours. These ratios are as closely matched to our industry as management could find, however there are some significant differences, especially in sales growth, financing ratios, long-term asset investments and net worth. However, our projections indicate a healthy company that will be able to obtain and retain long-term profitability.
| Ratio Analysis | ||||
| Year 1 | Year 2 | Year 3 | Industry Profile | |
| Sales Growth | 0.00% | 52.16% | 38.30% | 8.79% |
| Percent of Total Assets | ||||
| Accounts Receivable | 42.47% | 72.31% | 68.01% | 28.12% |
| Other Current Assets | 3.01% | 3.36% | 2.29% | 44.18% |
| Total Current Assets | 78.53% | 75.98% | 85.29% | 76.27% |
| Long-term Assets | 21.47% | 24.02% | 14.71% | 23.73% |
| Total Assets | 100.00% | 100.00% | 100.00% | 100.00% |
| Current Liabilities | 40.74% | 51.03% | 31.09% | 38.61% |
| Long-term Liabilities | 47.23% | 52.85% | 33.33% | 13.60% |
| Total Liabilities | 87.97% | 103.88% | 64.42% | 52.21% |
| Net Worth | 12.03% | -3.88% | 35.58% | 47.79% |
| Percent of Sales | ||||
| Sales | 100.00% | 100.00% | 100.00% | 100.00% |
| Gross Margin | 98.45% | 98.58% | 98.97% | 100.00% |
| Selling, General & Administrative Expenses | 120.50% | 104.03% | 88.98% | 82.68% |
| Advertising Expenses | 0.00% | 0.00% | 0.00% | 1.66% |
| Profit Before Interest and Taxes | -19.10% | -3.23% | 15.84% | 1.37% |
| Main Ratios | ||||
| Current | 1.93 | 1.49 | 2.74 | 1.59 |
| Quick | 1.93 | 1.49 | 2.74 | 1.22 |
| Total Debt to Total Assets | 87.97% | 103.88% | 64.42% | 3.09% |
| Pre-tax Return on Net Worth | -437.51% | 570.43% | 153.46% | 60.22% |
| Pre-tax Return on Assets | -52.64% | -22.15% | 54.61% | 7.76% |
| Additional Ratios | Year 1 | Year 2 | Year 3 | |
| Net Profit Margin | -22.05% | -5.45% | 10.00% | n.a |
| Return on Equity | -437.51% | 0.00% | 107.42% | n.a |
| Activity Ratios | ||||
| Accounts Receivable Turnover | 4.22 | 4.22 | 4.22 | n.a |
| Collection Days | 56 | 72 | 75 | n.a |
| Accounts Payable Turnover | 11.39 | 12.17 | 12.17 | n.a |
| Payment Days | 28 | 30 | 27 | n.a |
| Total Asset Turnover | 2.39 | 4.06 | 3.82 | n.a |
| Debt Ratios | ||||
| Debt to Net Worth | 7.31 | 0.00 | 1.81 | n.a |
| Current Liab. to Liab. | 0.46 | 0.49 | 0.48 | n.a |
| Liquidity Ratios | ||||
| Net Working Capital | $44,009 | $25,959 | $82,944 | n.a |
| Interest Coverage | -6.49 | -1.45 | 10.18 | n.a |
| Additional Ratios | ||||
| Assets to Sales | 0.42 | 0.25 | 0.26 | n.a |
| Current Debt/Total Assets | 41% | 51% | 31% | n.a |
| Acid Test | 0.89 | 0.07 | 0.56 | n.a |
| Sales/Net Worth | 19.84 | 0.00 | 10.74 | n.a |
| Dividend Payout | 0.00 | 0.00 | 0.00 | n.a |
Appendix
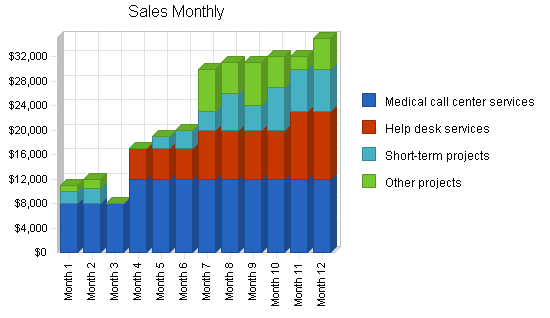
| Sales Forecast | |||||||||||||
| Month 1 | Month 2 | Month 3 | Month 4 | Month 5 | Month 6 | Month 7 | Month 8 | Month 9 | Month 10 | Month 11 | Month 12 | ||
| Sales | |||||||||||||
| Medical call center services | 0% | $8,000 | $8,000 | $8,000 | $12,000 | $12,000 | $12,000 | $12,000 | $12,000 | $12,000 | $12,000 | $12,000 | $12,000 |
| Help desk services | 0% | $0 | $0 | $0 | $5,000 | $5,000 | $5,000 | $8,000 | $8,000 | $8,000 | $8,000 | $11,000 | $11,000 |
| Short-term projects | 0% | $2,000 | $2,500 | $0 | $0 | $2,000 | $3,000 | $3,000 | $6,000 | $4,000 | $7,000 | $7,000 | $7,000 |
| Other projects | 0% | $1,000 | $1,500 | $0 | $0 | $0 | $0 | $7,000 | $5,000 | $7,000 | $5,000 | $2,000 | $5,000 |
| Total Sales | $11,000 | $12,000 | $8,000 | $17,000 | $19,000 | $20,000 | $30,000 | $31,000 | $31,000 | $32,000 | $32,000 | $35,000 | |
| Direct Cost of Sales | Month 1 | Month 2 | Month 3 | Month 4 | Month 5 | Month 6 | Month 7 | Month 8 | Month 9 | Month 10 | Month 11 | Month 12 | |
| Row 1 | $0 | $0 | $0 | $0 | $0 | $0 | $0 | $0 | $0 | $0 | $0 | $0 | |
| Other | $0 | $0 | $0 | $0 | $0 | $0 | $0 | $0 | $0 | $0 | $0 | $0 | |
| Subtotal Direct Cost of Sales | $0 | $0 | $0 | $0 | $0 | $0 | $0 | $0 | $0 | $0 | $0 | $0 | |
| Personnel Plan | |||||||||||||
| Month 1 | Month 2 | Month 3 | Month 4 | Month 5 | Month 6 | Month 7 | Month 8 | Month 9 | Month 10 | Month 11 | Month 12 | ||
| Mr. Martin Gibbs – President | 0% | $3,000 | $3,000 | $3,000 | $3,000 | $3,000 | $3,000 | $3,000 | $3,000 | $3,000 | $3,000 | $3,000 | $3,000 |
| Ms. Mary Stuart – Office Manager | 0% | $3,000 | $3,000 | $3,000 | $3,000 | $3,000 | $3,000 | $3,000 | $3,000 | $3,000 | $3,000 | $3,000 | $3,000 |
| Mr. Nicholas Caput – Operations | 0% | $3,000 | $3,000 | $3,000 | $3,000 | $3,000 | $3,000 | $3,000 | $3,000 | $3,000 | $3,000 | $3,000 | $3,000 |
| Customer service representatives | 0% | $5,760 | $5,760 | $5,760 | $5,760 | $5,760 | $7,680 | $9,600 | $10,000 | $10,000 | $10,000 | $11,500 | $13,470 |
| Total People | 0% | 9 | 9 | 9 | 9 | 9 | 11 | 13 | 15 | 15 | 15 | 17 | 19 |
| Total Payroll | $14,760 | $14,760 | $14,760 | $14,760 | $14,760 | $16,680 | $18,600 | $19,000 | $19,000 | $19,000 | $20,500 | $22,470 | |
| General Assumptions | |||||||||||||
| Month 1 | Month 2 | Month 3 | Month 4 | Month 5 | Month 6 | Month 7 | Month 8 | Month 9 | Month 10 | Month 11 | Month 12 | ||
| Plan Month | 1 | 2 | 3 | 4 | 5 | 6 | 7 | 8 | 9 | 10 | 11 | 12 | |
| Current Interest Rate | 10.00% | 10.00% | 10.00% | 10.00% | 10.00% | 10.00% | 10.00% | 10.00% | 10.00% | 10.00% | 10.00% | 10.00% | |
| Long-term Interest Rate | 10.00% | 10.00% | 10.00% | 10.00% | 10.00% | 10.00% | 10.00% | 10.00% | 10.00% | 10.00% | 10.00% | 10.00% | |
| Tax Rate | 30.00% | 30.00% | 30.00% | 30.00% | 30.00% | 30.00% | 30.00% | 30.00% | 30.00% | 30.00% | 30.00% | 30.00% | |
| Other | 0 | 0 | 0 | 0 | 0 | 0 | 0 | 0 | 0 | 0 | 0 | 0 | |
| Pro Forma Profit and Loss | |||||||||||||
| Month 1 | Month 2 | Month 3 | Month 4 | Month 5 | Month 6 | Month 7 | Month 8 | Month 9 | Month 10 | Month 11 | Month 12 | ||
| Sales | $11,000 | $12,000 | $8,000 | $17,000 | $19,000 | $20,000 | $30,000 | $31,000 | $31,000 | $32,000 | $32,000 | $35,000 | |
| Direct Cost of Sales | $0 | $0 | $0 | $0 | $0 | $0 | $0 | $0 | $0 | $0 | $0 | $0 | |
| Other Costs of Sales | $200 | $100 | $100 | $200 | $300 | $300 | $500 | $600 | $500 | $500 | $500 | $500 | |
| Total Cost of Sales | $200 | $100 | $100 | $200 | $300 | $300 | $500 | $600 | $500 | $500 | $500 | $500 | |
| Gross Margin | $10,800 | $11,900 | $7,900 | $16,800 | $18,700 | $19,700 | $29,500 | $30,400 | $30,500 | $31,500 | $31,500 | $34,500 | |
| Gross Margin % | 98.18% | 99.17% | 98.75% | 98.82% | 98.42% | 98.50% | 98.33% | 98.06% | 98.39% | 98.44% | 98.44% | 98.57% | |
| Expenses | |||||||||||||
| Payroll | $14,760 | $14,760 | $14,760 | $14,760 | $14,760 | $16,680 | $18,600 | $19,000 | $19,000 | $19,000 | $20,500 | $22,470 | |
| Sales and Marketing and Other Expenses | $1,500 | $1,500 | $1,500 | $1,500 | $1,500 | $1,500 | $1,500 | $1,500 | $1,500 | $1,500 | $1,500 | $1,500 | |
| Depreciation | $0 | $0 | $0 | $0 | $0 | $0 | $0 | $0 | $0 | $0 | $0 | $0 | |
| Rent | $1,500 | $1,500 | $1,500 | $1,500 | $1,500 | $1,500 | $1,500 | $1,500 | $1,500 | $1,500 | $1,500 | $1,500 | |
| Utilities | $600 | $600 | $600 | $600 | $600 | $600 | $600 | $600 | $600 | $600 | $600 | $600 | |
| Insurance | $1,100 | $1,100 | $1,100 | $1,100 | $1,100 | $1,100 | $1,100 | $1,100 | $1,100 | $1,100 | $1,100 | $1,100 | |
| Payroll Taxes | 15% | $2,214 | $2,214 | $2,214 | $2,214 | $2,214 | $2,502 | $2,790 | $2,850 | $2,850 | $2,850 | $3,075 | $3,371 |
| Travel | 15% | $1,000 | $1,000 | $1,000 | $1,000 | $1,000 | $1,000 | $1,000 | $1,000 | $1,000 | $1,000 | $1,000 | $1,000 |
| Other | $1,500 | $1,500 | $1,500 | $1,500 | $1,500 | $1,500 | $1,500 | $1,500 | $1,500 | $1,500 | $1,500 | $1,500 | |
| Total Operating Expenses | $24,174 | $24,174 | $24,174 | $24,174 | $24,174 | $26,382 | $28,590 | $29,050 | $29,050 | $29,050 | $30,775 | $33,041 | |
| Profit Before Interest and Taxes | ($13,374) | ($12,274) | ($16,274) | ($7,374) | ($5,474) | ($6,682) | $910 | $1,350 | $1,450 | $2,450 | $725 | $1,460 | |
| EBITDA | ($13,374) | ($12,274) | ($16,274) | ($7,374) | ($5,474) | ($6,682) | $910 | $1,350 | $1,450 | $2,450 | $725 | $1,460 | |
| Interest Expense | $592 | $592 | $592 | $592 | $633 | $675 | $717 | $758 | $758 | $758 | $758 | $758 | |
| Taxes Incurred | $0 | $0 | $0 | $0 | $0 | $0 | $0 | $0 | $0 | $0 | $0 | $0 | |
| Net Profit | ($13,966) | ($12,866) | ($16,866) | ($7,966) | ($6,107) | ($7,357) | $193 | $592 | $692 | $1,692 | ($33) | $701 | |
| Net Profit/Sales | -126.96% | -107.21% | -210.82% | -46.86% | -32.14% | -36.79% | 0.64% | 1.91% | 2.23% | 5.29% | -0.10% | 2.00% | |
| Pro Forma Cash Flow | |||||||||||||
| Month 1 | Month 2 | Month 3 | Month 4 | Month 5 | Month 6 | Month 7 | Month 8 | Month 9 | Month 10 | Month 11 | Month 12 | ||
| Cash Received | |||||||||||||
| Cash from Operations | |||||||||||||
| Cash Sales | $2,750 | $3,000 | $2,000 | $4,250 | $4,750 | $5,000 | $7,500 | $7,750 | $7,750 | $8,000 | $8,000 | $8,750 | |
| Cash from Receivables | $0 | $275 | $8,275 | $8,900 | $6,225 | $12,800 | $14,275 | $15,250 | $22,525 | $23,250 | $23,275 | $24,000 | |
| Subtotal Cash from Operations | $2,750 | $3,275 | $10,275 | $13,150 | $10,975 | $17,800 | $21,775 | $23,000 | $30,275 | $31,250 | $31,275 | $32,750 | |
| Additional Cash Received | |||||||||||||
| Sales Tax, VAT, HST/GST Received | 0.00% | $0 | $0 | $0 | $0 | $0 | $0 | $0 | $0 | $0 | $0 | $0 | $0 |
| New Current Borrowing | $0 | $0 | $0 | $0 | $5,000 | $5,000 | $5,000 | $5,000 | $0 | $0 | $0 | $0 | |
| New Other Liabilities (interest-free) | $0 | $0 | $0 | $0 | $0 | $0 | $0 | $0 | $0 | $0 | $0 | $0 | |
| New Long-term Liabilities | $0 | $0 | $0 | $0 | $0 | $0 | $0 | $0 | $0 | $0 | $0 | $0 | |
| Sales of Other Current Assets | $0 | $0 | $0 | $0 | $0 | $0 | $0 | $0 | $0 | $0 | $0 | $0 | |
| Sales of Long-term Assets | $0 | $0 | $0 | $0 | $0 | $0 | $0 | $0 | $0 | $0 | $0 | $0 | |
| New Investment Received | $0 | $0 | $0 | $0 | $0 | $0 | $1,500 | $1,500 | $0 | $0 | $0 | $0 | |
| Subtotal Cash Received | $2,750 | $3,275 | $10,275 | $13,150 | $15,975 | $22,800 | $28,275 | $29,500 | $30,275 | $31,250 | $31,275 | $32,750 | |
| Expenditures | Month 1 | Month 2 | Month 3 | Month 4 | Month 5 | Month 6 | Month 7 | Month 8 | Month 9 | Month 10 | Month 11 | Month 12 | |
| Expenditures from Operations | |||||||||||||
| Cash Spending | $14,760 | $14,760 | $14,760 | $14,760 | $14,760 | $16,680 | $18,600 | $19,000 | $19,000 | $19,000 | $20,500 | $22,470 | |
| Bill Payments | $3,340 | $10,202 | $10,106 | $10,109 | $10,210 | $10,358 | $10,695 | $11,213 | $11,405 | $11,308 | $11,316 | $11,543 | |
| Subtotal Spent on Operations | $18,100 | $24,962 | $24,866 | $24,869 | $24,970 | $27,038 | $29,295 | $30,213 | $30,405 | $30,308 | $31,816 | $34,013 | |
| Additional Cash Spent | |||||||||||||
| Sales Tax, VAT, HST/GST Paid Out | $0 | $0 | $0 | $0 | $0 | $0 | $0 | $0 | $0 | $0 | $0 | $0 | |
| Principal Repayment of Current Borrowing | $0 | $0 | $0 | $0 | $0 | $0 | $0 | $0 | $0 | $0 | $0 | $0 | |
| Other Liabilities Principal Repayment | $0 | $0 | $0 | $0 | $0 | $0 | $0 | $0 | $0 | $0 | $0 | $0 | |
| Long-term Liabilities Principal Repayment | $0 | $0 | $0 | $0 | $0 | $0 | $0 | $0 | $0 | $0 | $0 | $0 | |
| Purchase Other Current Assets | $0 | $0 | $0 | $0 | $0 | $0 | $0 | $0 | $0 | $0 | $0 | $0 | |
| Purchase Long-term Assets | $0 | $0 | $0 | $0 | $0 | $0 | $0 | $0 | $0 | $0 | $0 | $0 | |
| Dividends | $0 | $0 | $0 | $0 | $0 | $0 | $0 | $0 | $0 | $0 | $0 | $0 | |
| Subtotal Cash Spent | $18,100 | $24,962 | $24,866 | $24,869 | $24,970 | $27,038 | $29,295 | $30,213 | $30,405 | $30,308 | $31,816 | $34,013 | |
| Net Cash Flow | ($15,350) | ($21,687) | ($14,591) | ($11,719) | ($8,995) | ($4,238) | ($1,020) | ($713) | ($130) | $942 | ($541) | ($1,263) | |
| Cash Balance | $102,450 | $80,762 | $66,172 | $54,453 | $45,457 | $41,219 | $40,199 | $39,486 | $39,356 | $40,298 | $39,757 | $38,494 | |
| Pro Forma Balance Sheet | |||||||||||||
| Month 1 | Month 2 | Month 3 | Month 4 | Month 5 | Month 6 | Month 7 | Month 8 | Month 9 | Month 10 | Month 11 | Month 12 | ||
| Assets | Starting Balances | ||||||||||||
| Current Assets | |||||||||||||
| Cash | $117,800 | $102,450 | $80,762 | $66,172 | $54,453 | $45,457 | $41,219 | $40,199 | $39,486 | $39,356 | $40,298 | $39,757 | $38,494 |
| Accounts Receivable | $0 | $8,250 | $16,975 | $14,700 | $18,550 | $26,575 | $28,775 | $37,000 | $45,000 | $45,725 | $46,475 | $47,200 | $49,450 |
| Other Current Assets | $3,500 | $3,500 | $3,500 | $3,500 | $3,500 | $3,500 | $3,500 | $3,500 | $3,500 | $3,500 | $3,500 | $3,500 | $3,500 |
| Total Current Assets | $121,300 | $114,200 | $101,237 | $84,372 | $76,503 | $75,532 | $73,494 | $80,699 | $87,986 | $88,581 | $90,273 | $90,457 | $91,444 |
| Long-term Assets | |||||||||||||
| Long-term Assets | $25,000 | $25,000 | $25,000 | $25,000 | $25,000 | $25,000 | $25,000 | $25,000 | $25,000 | $25,000 | $25,000 | $25,000 | $25,000 |
| Accumulated Depreciation | $0 | $0 | $0 | $0 | $0 | $0 | $0 | $0 | $0 | $0 | $0 | $0 | $0 |
| Total Long-term Assets | $25,000 | $25,000 | $25,000 | $25,000 | $25,000 | $25,000 | $25,000 | $25,000 | $25,000 | $25,000 | $25,000 | $25,000 | $25,000 |
| Total Assets | $146,300 | $139,200 | $126,237 | $109,372 | $101,503 | $100,532 | $98,494 | $105,699 | $112,986 | $113,581 | $115,273 | $115,457 | $116,444 |
| Liabilities and Capital | Month 1 | Month 2 | Month 3 | Month 4 | Month 5 | Month 6 | Month 7 | Month 8 | Month 9 | Month 10 | Month 11 | Month 12 | |
| Current Liabilities | |||||||||||||
| Accounts Payable | $3,000 | $9,865 | $9,769 | $9,769 | $9,865 | $10,002 | $10,321 | $10,833 | $11,028 | $10,931 | $10,931 | $11,149 | $11,435 |
| Current Borrowing | $16,000 | $16,000 | $16,000 | $16,000 | $16,000 | $21,000 | $26,000 | $31,000 | $36,000 | $36,000 | $36,000 | $36,000 | $36,000 |
| Other Current Liabilities | $0 | $0 | $0 | $0 | $0 | $0 | $0 | $0 | $0 | $0 | $0 | $0 | $0 |
| Subtotal Current Liabilities | $19,000 | $25,865 | $25,769 | $25,769 | $25,865 | $31,002 | $36,321 | $41,833 | $47,028 | $46,931 | $46,931 | $47,149 | $47,435 |
| Long-term Liabilities | $55,000 | $55,000 | $55,000 | $55,000 | $55,000 | $55,000 | $55,000 | $55,000 | $55,000 | $55,000 | $55,000 | $55,000 | $55,000 |
| Total Liabilities | $74,000 | $80,865 | $80,769 | $80,769 | $80,865 | $86,002 | $91,321 | $96,833 | $102,028 | $101,931 | $101,931 | $102,149 | $102,435 |
| Paid-in Capital | $100,000 | $100,000 | $100,000 | $100,000 | $100,000 | $100,000 | $100,000 | $101,500 | $103,000 | $103,000 | $103,000 | $103,000 | $103,000 |
| Retained Earnings | ($27,700) | ($27,700) | ($27,700) | ($27,700) | ($27,700) | ($27,700) | ($27,700) | ($27,700) | ($27,700) | ($27,700) | ($27,700) | ($27,700) | ($27,700) |
| Earnings | $0 | ($13,966) | ($26,831) | ($43,697) | ($51,663) | ($57,770) | ($65,127) | ($64,934) | ($64,342) | ($63,650) | ($61,959) | ($61,992) | ($61,291) |
| Total Capital | $72,300 | $58,334 | $45,469 | $28,603 | $20,637 | $14,530 | $7,173 | $8,866 | $10,958 | $11,650 | $13,341 | $13,308 | $14,009 |
| Total Liabilities and Capital | $146,300 | $139,200 | $126,237 | $109,372 | $101,503 | $100,532 | $98,494 | $105,699 | $112,986 | $113,581 | $115,273 | $115,457 | $116,444 |
| Net Worth | $72,300 | $58,334 | $45,469 | $28,603 | $20,637 | $14,530 | $7,173 | $8,866 | $10,958 | $11,650 | $13,341 | $13,308 | $14,009 |


