
CorbelArch Real Estate Inspectors
Executive Summary
CorbelArch Real Estate Inspectors will provide thorough, unbiased, detailed, real estate and building inspections. We offer a full menu of services to realtors and their clients. Our inspection services include, but are not limited to, existing residential and commercial properties, all new construction, condos, manufactured homes, 11th month inspections (when new home warranties are nearing expiration), and pre-listing inspections (to identify areas of concern prior to market listing).
Trained and Educated
Our inspectors are professionally trained through accredited institutions and keep up-to-date on the latest building components and inspection techniques.
Flexible Scheduling
Because convenience is important to our clients, we can accommodate scheduling 7 days a week.
Fully Licensed, Bonded and Insured
We hold Professional Real Estate licenses through the Ourstate Realty Commission (ORC) and other nationally accredited institutions. We hold bonds for all field personnel, as well as $1,000,000 in both Errors and Omissions (E&O) and General Liability Insurance.
Thorough Inspections
Each property is examined thoroughly with no maximum time allowance, based on guidelines set forth by American Society of Home Inspectors (ASHI) and ORC. Our inspections meet or exceed industry accepted standards and fully comply with the ORC Standards of Practice.
Computerized Reports
CorbelArch reports offer a checklist and narrative format, with summary pages and color photos to further assist in their ease of understanding. Reports are e-mailed and securely posted for retrieval on our web hosting service (printed or faxed hard copies provided upon request).
Professional Equipment
We utilize state-of-the-art equipment to ensure a thorough inspection. Gas detection meters, moisture meters, circuit testers and infrared thermometers are only a few examples.
Professional and Courteous
We believe that clients deserve the best. We take pride in our inspectors’ communication skills, appearance and professionalism. We let the property speak for itself so that educated and informed decisions can be made.
1.1 Objectives
CorbelArch Real Estate Inspector’s objective is to build a high quality, ethical, full-service property services company that will win the approval of the Real Estate community which it serves.
Our goals include:
- A 10% market share in our first year.
- An increase of 15% in our gross margins within the second year of operation.
- An increase in our market share by a minimum of 10% for each of our first five years.
Currently, there are no high quality, full service property service companies in the Niceburg metro area, or the surrounding areas (for a radius of 50 miles). The company believes that by entering the marketplace first and by establishing quality standards, it will become, and remain, a leader in the property services industry in the greater Niceburg area.
Our fundamental objective is to realize how we impact the community that we do business in, knowing that we will stand the test of time if the key professionals approve and support our quality and integrity.
1.2 Mission
CorbelArch’s sole purpose is to establish a financially solid, profitable and well managed company while at the same time creating a market leading service organization based on professionalism, integrity and personalized customer service.
1.3 Keys to Success
Keys to success for the company will include:
- Maintain an untarnished reputation in the community.
- Provide high quality client sensitive service.
- Competitive pricing.
- Flexible hours.
- Excellence in fulfilling the promise–completely confidential, reliable, trustworthy expertise and information.
- Develop visibility to generate new business leads.
Company Summary
CorbelArch Real Estate Inspectors is an S corporation company consisting of two principal officers and two employees with combined industry experience of 45 years. The company was formed to take advantage of the perceived weakness and inadequacies of other regional companies in terms of quality and customer satisfaction. CorbelArch Real Estate Inspectors has marketed its name significantly to date. The principals in the company have invested significant amounts of their own capital into the company and will also be seeking a loan to cover start-up costs and future growth.
CorbelArch Real Estate Inspectors’ home office is located in a leased stand alone building at 5296 Plinth Hwy in Niceburg. The facilities include offices for the principals, storage area for tools and marketing supplies, and employee lounge.
The company plans to use its existing contacts obtained through past marketing via the Web, direct mailers, personal contact and printed publications to generate short-term residential contracts. Its long-term profitability will rely on current commercial contracts with national property services companies and future commercial contracts that will be obtained through strategic alliances and a comprehensive marketing program.
2.1 Company Ownership
CorbelArch Real Estate Inspectors is an existing S corporation consisting of two principal officers, Mason Corbel and Rocky Arch.
2.2 Company History
CorbelArch Real Estate Inspectors was founded as an S corporation in Ourstate in FY 2004. The company was actively providing services for only part of the year, and carries into this plan sizable Accounts Receivable, and a modest cash balance. The principals invested $15,000 each in the start up of the company and acquired short-term loans.

| Past Performance | |||
| FY 2002 | FY 2003 | FY 2004 | |
| Sales | $0 | $0 | $41,639 |
| Gross Margin | $0 | $0 | $20,000 |
| Gross Margin % | 0.00% | 0.00% | 48.03% |
| Operating Expenses | $0 | $0 | $5,800 |
| Collection Period (days) | 0 | 0 | 135 |
| Balance Sheet | |||
| FY 2002 | FY 2003 | FY 2004 | |
| Current Assets | |||
| Cash | $0 | $0 | $3,000 |
| Accounts Receivable | $0 | $0 | $21,639 |
| Other Current Assets | $0 | $0 | $25,000 |
| Total Current Assets | $0 | $0 | $49,639 |
| Long-term Assets | |||
| Long-term Assets | $0 | $0 | $15,000 |
| Accumulated Depreciation | $0 | $0 | $0 |
| Total Long-term Assets | $0 | $0 | $15,000 |
| Total Assets | $0 | $0 | $64,639 |
| Current Liabilities | |||
| Accounts Payable | $0 | $0 | $2,000 |
| Current Borrowing | $0 | $0 | $9,827 |
| Other Current Liabilities (interest free) | $0 | $0 | $0 |
| Total Current Liabilities | $0 | $0 | $11,827 |
| Long-term Liabilities | $0 | $0 | $0 |
| Total Liabilities | $0 | $0 | $11,827 |
| Paid-in Capital | $0 | $0 | $30,000 |
| Retained Earnings | $0 | $0 | $22,812 |
| Earnings | $0 | $0 | $0 |
| Total Capital | $0 | $0 | $52,812 |
| Total Capital and Liabilities | $0 | $0 | $64,639 |
| Other Inputs | |||
| Payment Days | 0 | 0 | 30 |
| Sales on Credit | $0 | $0 | $29,147 |
| Receivables Turnover | 0.00 | 0.00 | 1.35 |
Services
CorbelArch Real Estate Inspectors provides comprehensive property inspection and preservation services to the residential and commercial markets.
Market Analysis Summary
CorbelArch Real Estate Inspectors will focus on two markets within the industry, the residential segment (including apartment buildings) and the commercial segment (including buildings used for professional purposes).
The commercial market participants currently need competent inspection firms to provide services to themselves or their clients. Since our inspection findings can significantly impact a business’ profitability, it is absolutely crucial for our service to be accurate and complete.
Although the above is also true for the residental owner, quality and meeting the individual needs/wants of the client while maintaining the Realtor’s transaction come first in the residential segment. The inspector must be willing to be more flexible and willing to listen and work directly with the client.
Over the past decade a number of new trends have been observed in this industry. This includes the steady growth of the local economy, the increased percentage of property transactions that require inspections and the requirement and escalation of credentials needed to be licensed to perform inspections.
4.1 Market Segmentation
CorbelArch Real Estate Inspectors will focus on two markets within the industry, the residential segment (including apartment buildings) and the commercial segment which includes buildings used for professional purposes. The company can handle any size building that needs inspection or management services. It is the goal of the company to eventually have approximately one-third of all business coming from the commercial segment, since this generates the greatest cash flow. Furthermore, this segment has the lowest percentage of variable costs. The residential segment is considered to be the company’s cash cow. Even during the slow winter months, the company can expect to have a several residential contracts.


| Market Analysis | |||||||
| 2004 | 2005 | 2006 | 2007 | 2008 | |||
| Potential Customers | Growth | CAGR | |||||
| Single Family Residential Customers | 10% | 50,000 | 55,000 | 60,500 | 66,550 | 73,205 | 10.00% |
| Real Estate Investors | 10% | 10,000 | 11,000 | 12,100 | 13,310 | 14,641 | 10.00% |
| Lending Institutions | 0% | 100 | 100 | 100 | 100 | 100 | 0.00% |
| Insurance Providers | 0% | 5,000 | 5,000 | 5,000 | 5,000 | 5,000 | 0.00% |
| Property Management Corporations | 50% | 30 | 45 | 68 | 102 | 153 | 50.28% |
| Total | 9.34% | 65,130 | 71,145 | 77,768 | 85,062 | 93,099 | 9.34% |
4.2 Target Market Segment Strategy
Currently there is limited competition in the commercial inspection services industry. We plan to target our marketing to gain share in this growing business.
4.3 Service Business Analysis
Most of the industry analysis is contained in the Competitive Comparison section to give the reader the idea of the competitive nature of the industry, its opportunities and threats, and the company’s flexibility in pricing. CorbelArch Real Estate Inspectors exists in a purely competitive market that faces virtually unlimited competition and high demand. The ability of the company to differentiate its services or enter into a niche market is possible. The company will engage in strong leadership principles, aggressive sales and a high level of quality.
4.3.1 Competition and Buying Patterns
This industry is somewhat seasonal. The busiest times are during the summer months where it is easy for a company to become so engaged that it must turn down opportunities. During the winter months businesses must focus on service diversification and marketing to maintain consistent level of work.
Strategy and Implementation Summary
As stated before, the company will focus on greater service through better scheduling, project management, and greater alignment of personnel by providing profit sharing. The company is utilizing the most up-to-date communications and scheduling and reporting technology available.
The company is also currently carrying out an aggressive marketing plan throughout the region. This includes Web listings, direct mailings, literature and strategic alliances with key industry professionals.
5.1 Competitive Edge
CorbelArch Real Estate Inspectors seeks to establish a competitive edge in its new target market segment by increasing the level of customer contact and service. Something that other competitors oftentimes lack. Additionally, CorbelArch Real Estate Inspectors possesses the necessary skills to produce the high quality services that are needed in this field. The establishment of the previously mentioned work processes that will ensure greater service will strengthen the contacts that promote word-of-mouth marketing and networking.
5.2 Marketing Strategy
CorbelArch Real Estate Inspectors is currently utilizing several avenues to promote the company and its services including but not limited to: website, multiple trade Web listings, brochure placements, phone directory advertisement, direct mail advertisement, target service mailings and word of mouth among key industry professionals.
Our website will be promoted on all of our marketing publications, and promo pieces. We will link to various trade and government sites. We are currently listed at the top of several of the most utilized search engines.
5.3 Sales Strategy
Sales forecast is based on the existing client base of the two principal officers of the company and the ability of they and their two relatively new employees to generate new sales based on these contacts. By bringing together the experience, (which includes significant sales) of the existing owners and new employees the company will be able to generate sales on an escalating basis. Furthermore, the company’s growing marketing program will generate the growth the company needs to excel.
5.3.1 Sales Forecast
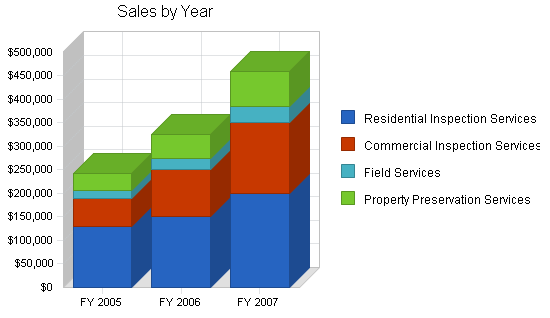
The table and chart below, along with the first year monthly break down in the appendix ably present the Sales and Cost of Sales forecast.

| Sales Forecast | |||
| FY 2005 | FY 2006 | FY 2007 | |
| Sales | |||
| Residential Inspection Services | $129,000 | $150,000 | $200,000 |
| Commercial Inspection Services | $60,000 | $100,000 | $150,000 |
| Field Services | $18,000 | $25,000 | $35,000 |
| Property Preservation Services | $36,000 | $50,000 | $75,000 |
| Total Sales | $243,000 | $325,000 | $460,000 |
| Direct Cost of Sales | FY 2005 | FY 2006 | FY 2007 |
| Mileage | $35,235 | $47,125 | $66,700 |
| Report Materials | $14,580 | $19,500 | $27,600 |
| Subtotal Direct Cost of Sales | $49,815 | $66,625 | $94,300 |
Management Summary
Our company philosophy is based on mutual respect for all contributions made by our founders, investors, consultants, and employees without regard to the position held in the company. Those who work with CorbelArch Real Estate Inspectors will learn to enjoy and trust our partnership environment, because we all strive to create an environment that enables us to work as a team where suggestions are valued, appreciated and rewarded.
CorbelArch Real Estate Inspectors will also work toward establishing community involvement programs that will demonstrate how our business can contribute to a better quality of community life. Projects such as offering our services in working with schools, churches, and other groups on programs for mutual benefit.
6.1 Personnel Plan
Customer service is paramount in our business and our business plan. The management team will accomplish this goal by targeting employees who are willing to be trained and by providing encouragement and employee incentive programs. CorbelArch Real Estate Inspectors will initially contract bookkeeping/HR functions. In year three a full-time bookkeeper will be hired.
In year one of this plan there are four total personnel; year two we will hire two more people; and in year three our total personnel count will be seven.
As the business becomes more profitable, CorbelArch intends to provide the following benefits for owners and employees:
- Health care insurance
- Dental care insurance
- Life insurance
- Vacation time
- Up sell incentive programs
- 401k retirement plans
| Personnel Plan | |||
| FY 2005 | FY 2006 | FY 2007 | |
| Owner\Founders | $14,000 | $64,000 | $74,000 |
| Employees | $7,000 | $100,000 | $125,000 |
| Total People | 0 | 6 | 7 |
| Total Payroll | $21,000 | $164,000 | $199,000 |
Financial Plan
The following topics present the financial plan for CorbelArch Real Estate Inspectors. Topics covered include a Break-even Analysis, Cash Flow, P & L, and a Balance Sheet.
7.1 Important Assumptions
We are assuming steady growth from good management, barring any unforseen local, or national disasters such as the economic slowdown seen by most of the country following the September 11th, 2001 tragedies.
7.2 Break-even Analysis
The break-even analysis is based on our average monthly expenses. The total expenses anticipated for the 12-month plan period was divided by twelve to establish the monthly average. The table below shows what we must average in revenue each month. We recognize that our actual revenue and expanses will vary each month.

| Break-even Analysis | |
| Monthly Revenue Break-even | $4,963 |
| Assumptions: | |
| Average Percent Variable Cost | 21% |
| Estimated Monthly Fixed Cost | $3,946 |
7.3 Projected Profit and Loss
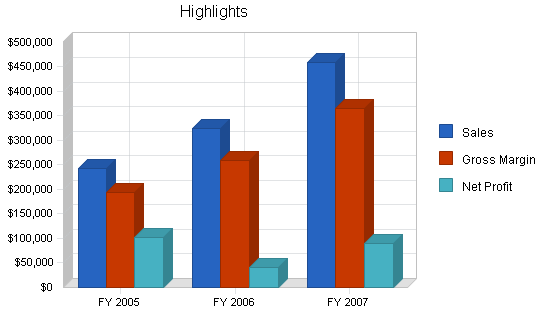
As the Profit and Loss table shows, the company expects to continue its steady growth in profitability over the next three years of operations.


| Pro Forma Profit and Loss | |||
| FY 2005 | FY 2006 | FY 2007 | |
| Sales | $243,000 | $325,000 | $460,000 |
| Direct Cost of Sales | $49,815 | $66,625 | $94,300 |
| Other Costs of Sales | $0 | $0 | $0 |
| Total Cost of Sales | $49,815 | $66,625 | $94,300 |
| Gross Margin | $193,185 | $258,375 | $365,700 |
| Gross Margin % | 79.50% | 79.50% | 79.50% |
| Expenses | |||
| Payroll | $21,000 | $164,000 | $199,000 |
| Marketing/Promotion | $3,000 | $4,000 | $8,000 |
| Depreciation | $0 | $0 | $0 |
| Rent | $6,000 | $9,000 | $9,000 |
| Utilities | $1,200 | $2,000 | $2,400 |
| Insurance | $9,000 | $12,000 | $16,000 |
| Website Hosting and Maintenance | $2,400 | $2,800 | $3,000 |
| Bookkeeping Service | $4,750 | $6,000 | $0 |
| Payroll Taxes | $0 | $0 | $0 |
| Total Operating Expenses | $47,350 | $199,800 | $237,400 |
| Profit Before Interest and Taxes | $145,835 | $58,575 | $128,300 |
| EBITDA | $145,835 | $58,575 | $128,300 |
| Interest Expense | $533 | $436 | $335 |
| Taxes Incurred | $43,591 | $17,442 | $38,389 |
| Net Profit | $101,711 | $40,697 | $89,575 |
| Net Profit/Sales | 41.86% | 12.52% | 19.47% |
7.4 Projected Cash Flow
In years two and three we will purchase company vehicles. In year two we anticipate distributing profit sharing as dividends to all owners and employees.

| Pro Forma Cash Flow | |||
| FY 2005 | FY 2006 | FY 2007 | |
| Cash Received | |||
| Cash from Operations | |||
| Cash Sales | $72,900 | $97,500 | $138,000 |
| Cash from Receivables | $167,647 | $219,370 | $308,616 |
| Subtotal Cash from Operations | $240,547 | $316,870 | $446,616 |
| Additional Cash Received | |||
| Sales Tax, VAT, HST/GST Received | $0 | $0 | $0 |
| New Current Borrowing | $0 | $0 | $0 |
| New Other Liabilities (interest-free) | $0 | $0 | $0 |
| New Long-term Liabilities | $0 | $0 | $0 |
| Sales of Other Current Assets | $0 | $0 | $0 |
| Sales of Long-term Assets | $0 | $0 | $0 |
| New Investment Received | $0 | $0 | $0 |
| Subtotal Cash Received | $240,547 | $316,870 | $446,616 |
| Expenditures | FY 2005 | FY 2006 | FY 2007 |
| Expenditures from Operations | |||
| Cash Spending | $21,000 | $164,000 | $199,000 |
| Bill Payments | $113,869 | $118,834 | $167,223 |
| Subtotal Spent on Operations | $134,869 | $282,834 | $366,223 |
| Additional Cash Spent | |||
| Sales Tax, VAT, HST/GST Paid Out | $0 | $0 | $0 |
| Principal Repayment of Current Borrowing | $1,740 | $1,635 | $1,736 |
| Other Liabilities Principal Repayment | $0 | $0 | $0 |
| Long-term Liabilities Principal Repayment | $0 | $0 | $0 |
| Purchase Other Current Assets | $0 | $0 | $0 |
| Purchase Long-term Assets | $0 | $30,000 | $45,000 |
| Dividends | $0 | $30,000 | $60,000 |
| Subtotal Cash Spent | $136,609 | $344,469 | $472,959 |
| Net Cash Flow | $103,938 | ($27,599) | ($26,343) |
| Cash Balance | $106,938 | $79,339 | $52,996 |
7.5 Projected Balance Sheet
The balance sheet shows healthy growth of net worth, and strong financial position. The monthly estimates are included in the appendix.
| Pro Forma Balance Sheet | |||
| FY 2005 | FY 2006 | FY 2007 | |
| Assets | |||
| Current Assets | |||
| Cash | $106,938 | $79,339 | $52,996 |
| Accounts Receivable | $24,092 | $32,221 | $45,606 |
| Other Current Assets | $25,000 | $25,000 | $25,000 |
| Total Current Assets | $156,030 | $136,560 | $123,602 |
| Long-term Assets | |||
| Long-term Assets | $15,000 | $45,000 | $90,000 |
| Accumulated Depreciation | $0 | $0 | $0 |
| Total Long-term Assets | $15,000 | $45,000 | $90,000 |
| Total Assets | $171,030 | $181,560 | $213,602 |
| Liabilities and Capital | FY 2005 | FY 2006 | FY 2007 |
| Current Liabilities | |||
| Accounts Payable | $8,419 | $9,888 | $14,090 |
| Current Borrowing | $8,087 | $6,452 | $4,716 |
| Other Current Liabilities | $0 | $0 | $0 |
| Subtotal Current Liabilities | $16,506 | $16,340 | $18,806 |
| Long-term Liabilities | $0 | $0 | $0 |
| Total Liabilities | $16,506 | $16,340 | $18,806 |
| Paid-in Capital | $30,000 | $30,000 | $30,000 |
| Retained Earnings | $22,812 | $94,523 | $75,221 |
| Earnings | $101,711 | $40,697 | $89,575 |
| Total Capital | $154,523 | $165,221 | $194,796 |
| Total Liabilities and Capital | $171,030 | $181,560 | $213,602 |
| Net Worth | $154,523 | $165,221 | $194,796 |
7.6 Business Ratios
Business ratios for the years of this plan are shown below. Industry profile ratios based on the Standard Industrial Classification (SIC) code 7389.0203, Building Inspection Services, are shown for comparison.
| Ratio Analysis | ||||
| FY 2005 | FY 2006 | FY 2007 | Industry Profile | |
| Sales Growth | 483.59% | 33.74% | 41.54% | 2.53% |
| Percent of Total Assets | ||||
| Accounts Receivable | 14.09% | 17.75% | 21.35% | 23.12% |
| Other Current Assets | 14.62% | 13.77% | 11.70% | 47.86% |
| Total Current Assets | 91.23% | 75.21% | 57.87% | 73.23% |
| Long-term Assets | 8.77% | 24.79% | 42.13% | 26.77% |
| Total Assets | 100.00% | 100.00% | 100.00% | 100.00% |
| Current Liabilities | 9.65% | 9.00% | 8.80% | 34.95% |
| Long-term Liabilities | 0.00% | 0.00% | 0.00% | 11.17% |
| Total Liabilities | 9.65% | 9.00% | 8.80% | 46.12% |
| Net Worth | 90.35% | 91.00% | 91.20% | 53.88% |
| Percent of Sales | ||||
| Sales | 100.00% | 100.00% | 100.00% | 100.00% |
| Gross Margin | 79.50% | 79.50% | 79.50% | 100.00% |
| Selling, General & Administrative Expenses | 37.64% | 66.98% | 60.03% | 81.44% |
| Advertising Expenses | 0.00% | 0.00% | 0.00% | 1.41% |
| Profit Before Interest and Taxes | 60.01% | 18.02% | 27.89% | 2.40% |
| Main Ratios | ||||
| Current | 9.45 | 8.36 | 6.57 | 1.54 |
| Quick | 9.45 | 8.36 | 6.57 | 1.23 |
| Total Debt to Total Assets | 9.65% | 9.00% | 8.80% | 56.68% |
| Pre-tax Return on Net Worth | 94.03% | 35.19% | 65.69% | 5.58% |
| Pre-tax Return on Assets | 84.96% | 32.02% | 59.91% | 12.87% |
| Additional Ratios | FY 2005 | FY 2006 | FY 2007 | |
| Net Profit Margin | 41.86% | 12.52% | 19.47% | n.a |
| Return on Equity | 65.82% | 24.63% | 45.98% | n.a |
| Activity Ratios | ||||
| Accounts Receivable Turnover | 7.06 | 7.06 | 7.06 | n.a |
| Collection Days | 60 | 45 | 44 | n.a |
| Accounts Payable Turnover | 14.29 | 12.17 | 12.17 | n.a |
| Payment Days | 28 | 28 | 26 | n.a |
| Total Asset Turnover | 1.42 | 1.79 | 2.15 | n.a |
| Debt Ratios | ||||
| Debt to Net Worth | 0.11 | 0.10 | 0.10 | n.a |
| Current Liab. to Liab. | 1.00 | 1.00 | 1.00 | n.a |
| Liquidity Ratios | ||||
| Net Working Capital | $139,523 | $120,221 | $104,796 | n.a |
| Interest Coverage | 273.58 | 134.29 | 382.94 | n.a |
| Additional Ratios | ||||
| Assets to Sales | 0.70 | 0.56 | 0.46 | n.a |
| Current Debt/Total Assets | 10% | 9% | 9% | n.a |
| Acid Test | 7.99 | 6.39 | 4.15 | n.a |
| Sales/Net Worth | 1.57 | 1.97 | 2.36 | n.a |
| Dividend Payout | 0.00 | 0.74 | 0.67 | n.a |
Appendix
| Sales Forecast | |||||||||||||
| Apr | May | Jun | Jul | Aug | Sep | Oct | Nov | Dec | Jan | Feb | Mar | ||
| Sales | |||||||||||||
| Residential Inspection Services | 0% | $8,000 | $12,000 | $16,000 | $18,000 | $14,000 | $13,000 | $8,000 | $8,000 | $8,000 | $8,000 | $8,000 | $8,000 |
| Commercial Inspection Services | 0% | $5,000 | $5,000 | $5,000 | $5,000 | $5,000 | $5,000 | $5,000 | $5,000 | $5,000 | $5,000 | $5,000 | $5,000 |
| Field Services | 0% | $1,500 | $1,500 | $1,500 | $1,500 | $1,500 | $1,500 | $1,500 | $1,500 | $1,500 | $1,500 | $1,500 | $1,500 |
| Property Preservation Services | 0% | $3,000 | $3,000 | $3,000 | $3,000 | $3,000 | $3,000 | $3,000 | $3,000 | $3,000 | $3,000 | $3,000 | $3,000 |
| Total Sales | $17,500 | $21,500 | $25,500 | $27,500 | $23,500 | $22,500 | $17,500 | $17,500 | $17,500 | $17,500 | $17,500 | $17,500 | |
| Direct Cost of Sales | Apr | May | Jun | Jul | Aug | Sep | Oct | Nov | Dec | Jan | Feb | Mar | |
| Mileage | $2,538 | $3,118 | $3,697 | $3,987 | $3,407 | $3,263 | $2,538 | $2,538 | $2,538 | $2,538 | $2,538 | $2,538 | |
| Report Materials | $1,050 | $1,290 | $1,530 | $1,650 | $1,410 | $1,350 | $1,050 | $1,050 | $1,050 | $1,050 | $1,050 | $1,050 | |
| Subtotal Direct Cost of Sales | $3,588 | $4,408 | $5,228 | $5,638 | $4,818 | $4,613 | $3,588 | $3,588 | $3,588 | $3,588 | $3,588 | $3,588 | |
| Personnel Plan | |||||||||||||
| Apr | May | Jun | Jul | Aug | Sep | Oct | Nov | Dec | Jan | Feb | Mar | ||
| Owner\Founders | 0% | $0 | $0 | $0 | $0 | $0 | $2,000 | $2,000 | $2,000 | $2,000 | $2,000 | $2,000 | $2,000 |
| Employees | 0% | $0 | $0 | $0 | $0 | $0 | $1,000 | $1,000 | $1,000 | $1,000 | $1,000 | $1,000 | $1,000 |
| Total People | 0 | 0 | 0 | 0 | 0 | 0 | 0 | 0 | 0 | 0 | 0 | 0 | |
| Total Payroll | $0 | $0 | $0 | $0 | $0 | $3,000 | $3,000 | $3,000 | $3,000 | $3,000 | $3,000 | $3,000 | |
| Pro Forma Profit and Loss | |||||||||||||
| Apr | May | Jun | Jul | Aug | Sep | Oct | Nov | Dec | Jan | Feb | Mar | ||
| Sales | $17,500 | $21,500 | $25,500 | $27,500 | $23,500 | $22,500 | $17,500 | $17,500 | $17,500 | $17,500 | $17,500 | $17,500 | |
| Direct Cost of Sales | $3,588 | $4,408 | $5,228 | $5,638 | $4,818 | $4,613 | $3,588 | $3,588 | $3,588 | $3,588 | $3,588 | $3,588 | |
| Other Costs of Sales | $0 | $0 | $0 | $0 | $0 | $0 | $0 | $0 | $0 | $0 | $0 | $0 | |
| Total Cost of Sales | $3,588 | $4,408 | $5,228 | $5,638 | $4,818 | $4,613 | $3,588 | $3,588 | $3,588 | $3,588 | $3,588 | $3,588 | |
| Gross Margin | $13,913 | $17,093 | $20,273 | $21,863 | $18,683 | $17,888 | $13,913 | $13,913 | $13,913 | $13,913 | $13,913 | $13,913 | |
| Gross Margin % | 79.50% | 79.50% | 79.50% | 79.50% | 79.50% | 79.50% | 79.50% | 79.50% | 79.50% | 79.50% | 79.50% | 79.50% | |
| Expenses | |||||||||||||
| Payroll | $0 | $0 | $0 | $0 | $0 | $3,000 | $3,000 | $3,000 | $3,000 | $3,000 | $3,000 | $3,000 | |
| Marketing/Promotion | $250 | $250 | $250 | $250 | $250 | $250 | $250 | $250 | $250 | $250 | $250 | $250 | |
| Depreciation | $0 | $0 | $0 | $0 | $0 | $0 | $0 | $0 | $0 | $0 | $0 | $0 | |
| Rent | $0 | $0 | $0 | $0 | $750 | $750 | $750 | $750 | $750 | $750 | $750 | $750 | |
| Utilities | $0 | $0 | $0 | $0 | $150 | $150 | $150 | $150 | $150 | $150 | $150 | $150 | |
| Insurance | $750 | $750 | $750 | $750 | $750 | $750 | $750 | $750 | $750 | $750 | $750 | $750 | |
| Website Hosting and Maintenance | $200 | $200 | $200 | $200 | $200 | $200 | $200 | $200 | $200 | $200 | $200 | $200 | |
| Bookkeeping Service | 15% | $250 | $250 | $250 | $250 | $250 | $500 | $500 | $500 | $500 | $500 | $500 | $500 |
| Payroll Taxes | 15% | $0 | $0 | $0 | $0 | $0 | $0 | $0 | $0 | $0 | $0 | $0 | $0 |
| Total Operating Expenses | $1,450 | $1,450 | $1,450 | $1,450 | $2,350 | $5,600 | $5,600 | $5,600 | $5,600 | $5,600 | $5,600 | $5,600 | |
| Profit Before Interest and Taxes | $12,463 | $15,643 | $18,823 | $20,413 | $16,333 | $12,288 | $8,313 | $8,313 | $8,313 | $8,313 | $8,313 | $8,313 | |
| EBITDA | $12,463 | $15,643 | $18,823 | $20,413 | $16,333 | $12,288 | $8,313 | $8,313 | $8,313 | $8,313 | $8,313 | $8,313 | |
| Interest Expense | $48 | $48 | $47 | $46 | $46 | $45 | $44 | $43 | $43 | $42 | $41 | $40 | |
| Taxes Incurred | $3,724 | $4,678 | $5,633 | $6,110 | $4,886 | $3,673 | $2,481 | $2,481 | $2,481 | $2,481 | $2,481 | $2,482 | |
| Net Profit | $8,690 | $10,916 | $13,143 | $14,256 | $11,401 | $8,570 | $5,788 | $5,788 | $5,789 | $5,789 | $5,790 | $5,790 | |
| Net Profit/Sales | 49.66% | 50.77% | 51.54% | 51.84% | 48.51% | 38.09% | 33.07% | 33.08% | 33.08% | 33.08% | 33.09% | 33.09% | |
| Pro Forma Cash Flow | |||||||||||||
| Apr | May | Jun | Jul | Aug | Sep | Oct | Nov | Dec | Jan | Feb | Mar | ||
| Cash Received | |||||||||||||
| Cash from Operations | |||||||||||||
| Cash Sales | $5,250 | $6,450 | $7,650 | $8,250 | $7,050 | $6,750 | $5,250 | $5,250 | $5,250 | $5,250 | $5,250 | $5,250 | |
| Cash from Receivables | $10,820 | $11,228 | $12,343 | $15,143 | $17,897 | $19,157 | $16,427 | $15,633 | $12,250 | $12,250 | $12,250 | $12,250 | |
| Subtotal Cash from Operations | $16,070 | $17,678 | $19,993 | $23,393 | $24,947 | $25,907 | $21,677 | $20,883 | $17,500 | $17,500 | $17,500 | $17,500 | |
| Additional Cash Received | |||||||||||||
| Sales Tax, VAT, HST/GST Received | 0.00% | $0 | $0 | $0 | $0 | $0 | $0 | $0 | $0 | $0 | $0 | $0 | $0 |
| New Current Borrowing | $0 | $0 | $0 | $0 | $0 | $0 | $0 | $0 | $0 | $0 | $0 | $0 | |
| New Other Liabilities (interest-free) | $0 | $0 | $0 | $0 | $0 | $0 | $0 | $0 | $0 | $0 | $0 | $0 | |
| New Long-term Liabilities | $0 | $0 | $0 | $0 | $0 | $0 | $0 | $0 | $0 | $0 | $0 | $0 | |
| Sales of Other Current Assets | $0 | $0 | $0 | $0 | $0 | $0 | $0 | $0 | $0 | $0 | $0 | $0 | |
| Sales of Long-term Assets | $0 | $0 | $0 | $0 | $0 | $0 | $0 | $0 | $0 | $0 | $0 | $0 | |
| New Investment Received | $0 | $0 | $0 | $0 | $0 | $0 | $0 | $0 | $0 | $0 | $0 | $0 | |
| Subtotal Cash Received | $16,070 | $17,678 | $19,993 | $23,393 | $24,947 | $25,907 | $21,677 | $20,883 | $17,500 | $17,500 | $17,500 | $17,500 | |
| Expenditures | Apr | May | Jun | Jul | Aug | Sep | Oct | Nov | Dec | Jan | Feb | Mar | |
| Expenditures from Operations | |||||||||||||
| Cash Spending | $0 | $0 | $0 | $0 | $0 | $3,000 | $3,000 | $3,000 | $3,000 | $3,000 | $3,000 | $3,000 | |
| Bill Payments | $2,294 | $8,869 | $10,643 | $12,387 | $13,205 | $12,060 | $10,856 | $8,712 | $8,712 | $8,711 | $8,711 | $8,710 | |
| Subtotal Spent on Operations | $2,294 | $8,869 | $10,643 | $12,387 | $13,205 | $15,060 | $13,856 | $11,712 | $11,712 | $11,711 | $11,711 | $11,710 | |
| Additional Cash Spent | |||||||||||||
| Sales Tax, VAT, HST/GST Paid Out | $0 | $0 | $0 | $0 | $0 | $0 | $0 | $0 | $0 | $0 | $0 | $0 | |
| Principal Repayment of Current Borrowing | $145 | $145 | $145 | $145 | $145 | $145 | $145 | $145 | $145 | $145 | $145 | $145 | |
| Other Liabilities Principal Repayment | $0 | $0 | $0 | $0 | $0 | $0 | $0 | $0 | $0 | $0 | $0 | $0 | |
| Long-term Liabilities Principal Repayment | $0 | $0 | $0 | $0 | $0 | $0 | $0 | $0 | $0 | $0 | $0 | $0 | |
| Purchase Other Current Assets | $0 | $0 | $0 | $0 | $0 | $0 | $0 | $0 | $0 | $0 | $0 | $0 | |
| Purchase Long-term Assets | $0 | $0 | $0 | $0 | $0 | $0 | $0 | $0 | $0 | $0 | $0 | $0 | |
| Dividends | $0 | $0 | $0 | $0 | $0 | $0 | $0 | $0 | $0 | $0 | $0 | $0 | |
| Subtotal Cash Spent | $2,439 | $9,014 | $10,788 | $12,532 | $13,350 | $15,205 | $14,001 | $11,857 | $11,857 | $11,856 | $11,856 | $11,855 | |
| Net Cash Flow | $13,631 | $8,664 | $9,206 | $10,862 | $11,596 | $10,702 | $7,676 | $9,026 | $5,643 | $5,644 | $5,644 | $5,645 | |
| Cash Balance | $16,631 | $25,294 | $34,500 | $45,362 | $56,958 | $67,659 | $75,335 | $84,361 | $90,005 | $95,649 | $101,293 | $106,938 | |
| Pro Forma Balance Sheet | |||||||||||||
| Apr | May | Jun | Jul | Aug | Sep | Oct | Nov | Dec | Jan | Feb | Mar | ||
| Assets | Starting Balances | ||||||||||||
| Current Assets | |||||||||||||
| Cash | $3,000 | $16,631 | $25,294 | $34,500 | $45,362 | $56,958 | $67,659 | $75,335 | $84,361 | $90,005 | $95,649 | $101,293 | $106,938 |
| Accounts Receivable | $21,639 | $23,070 | $26,892 | $32,398 | $36,505 | $35,058 | $31,652 | $27,475 | $24,092 | $24,092 | $24,092 | $24,092 | $24,092 |
| Other Current Assets | $25,000 | $25,000 | $25,000 | $25,000 | $25,000 | $25,000 | $25,000 | $25,000 | $25,000 | $25,000 | $25,000 | $25,000 | $25,000 |
| Total Current Assets | $49,639 | $64,700 | $77,186 | $91,898 | $106,867 | $117,016 | $124,311 | $127,810 | $133,453 | $139,096 | $144,740 | $150,385 | $156,030 |
| Long-term Assets | |||||||||||||
| Long-term Assets | $15,000 | $15,000 | $15,000 | $15,000 | $15,000 | $15,000 | $15,000 | $15,000 | $15,000 | $15,000 | $15,000 | $15,000 | $15,000 |
| Accumulated Depreciation | $0 | $0 | $0 | $0 | $0 | $0 | $0 | $0 | $0 | $0 | $0 | $0 | $0 |
| Total Long-term Assets | $15,000 | $15,000 | $15,000 | $15,000 | $15,000 | $15,000 | $15,000 | $15,000 | $15,000 | $15,000 | $15,000 | $15,000 | $15,000 |
| Total Assets | $64,639 | $79,700 | $92,186 | $106,898 | $121,867 | $132,016 | $139,311 | $142,810 | $148,453 | $154,096 | $159,740 | $165,385 | $171,030 |
| Liabilities and Capital | Apr | May | Jun | Jul | Aug | Sep | Oct | Nov | Dec | Jan | Feb | Mar | |
| Current Liabilities | |||||||||||||
| Accounts Payable | $2,000 | $8,516 | $10,231 | $11,945 | $12,802 | $11,696 | $10,566 | $8,422 | $8,421 | $8,421 | $8,420 | $8,420 | $8,419 |
| Current Borrowing | $9,827 | $9,682 | $9,537 | $9,392 | $9,247 | $9,102 | $8,957 | $8,812 | $8,667 | $8,522 | $8,377 | $8,232 | $8,087 |
| Other Current Liabilities | $0 | $0 | $0 | $0 | $0 | $0 | $0 | $0 | $0 | $0 | $0 | $0 | $0 |
| Subtotal Current Liabilities | $11,827 | $18,198 | $19,768 | $21,337 | $22,049 | $20,798 | $19,523 | $17,234 | $17,088 | $16,943 | $16,797 | $16,652 | $16,506 |
| Long-term Liabilities | $0 | $0 | $0 | $0 | $0 | $0 | $0 | $0 | $0 | $0 | $0 | $0 | $0 |
| Total Liabilities | $11,827 | $18,198 | $19,768 | $21,337 | $22,049 | $20,798 | $19,523 | $17,234 | $17,088 | $16,943 | $16,797 | $16,652 | $16,506 |
| Paid-in Capital | $30,000 | $30,000 | $30,000 | $30,000 | $30,000 | $30,000 | $30,000 | $30,000 | $30,000 | $30,000 | $30,000 | $30,000 | $30,000 |
| Retained Earnings | $22,812 | $22,812 | $22,812 | $22,812 | $22,812 | $22,812 | $22,812 | $22,812 | $22,812 | $22,812 | $22,812 | $22,812 | $22,812 |
| Earnings | $0 | $8,690 | $19,606 | $32,749 | $47,005 | $58,406 | $66,976 | $72,764 | $78,553 | $84,342 | $90,131 | $95,921 | $101,711 |
| Total Capital | $52,812 | $61,502 | $72,418 | $85,561 | $99,817 | $111,218 | $119,788 | $125,576 | $131,365 | $137,154 | $142,943 | $148,733 | $154,523 |
| Total Liabilities and Capital | $64,639 | $79,700 | $92,186 | $106,898 | $121,867 | $132,016 | $139,311 | $142,810 | $148,453 | $154,096 | $159,740 | $165,385 | $171,030 |
| Net Worth | $52,812 | $61,502 | $72,418 | $85,561 | $99,817 | $111,218 | $119,788 | $125,576 | $131,365 | $137,154 | $142,943 | $148,733 | $154,523 |


