
Growth Management and Strategies
Executive Summary
Growth Management and Strategies (GMS) is an ambitious innovative new company that is attempting to turn the small business consulting business on its head. With an experienced consultant at the helm as President, GMS intends to grow at more than 50% per year through solid customer service, a great sales plan, proven competitive strategies, and a group of people that bring dynamic energy to the company and the sales process.
The goal for this plan is financial: GMS needs a Small Business Adminstration (SBA) loan, and this document is one step in the process. It is also a road map for the company. The document gives all present and future employees, as well as the owner a sense of purpose that may exist without the business plan, but becomes more relevant after the business plan is written, reviewed, shared, and edited by all. It is a living document that will last far beyond the SBA loan purpose, or if that doesn’t occur, to bring an investor on board.
GMS’s financials are realistic, and based on very conservative sales figures relative to the industry as a whole. That is because one of the goals of GMS is to build the business one client at a time, and to serve each client as if it were the last. This is how loyalty is generated, and cultivated. Customer service is what GMS will do best, and is a large part of the company’s overall mission.
1.1 Objectives
The objectives for Growth Management and Strategies are:
- Gain access to an SBA loan upon start up.
- Grow the company from 2 employees in Year 1, to over 10 by Year 5.
- Increase revenue to over $3 million by Year 3.
- Increase client base by 450% in three years.
- Maintain job costing that keeps margins above 70%.
1.2 Mission
The company mission is to serve small business clients that are in need of logistical, technical, and business strategy services. All projects will be chosen based on the availability of human resources, and each individual employee will be given the respect of a contract worker, and will share in profits for each job. Politics have no place at Growth Management and Strategies, and to limit the affects of favoritism, the company will implement and clearly communicate a performance review policy that applies to those at the bottom as well as the top of the leadership ladder. Credit will be given to the person who performed and/or innovatively modified a project, and compensation will be both financial and in the form of commendation.
Growth Management and Strategies is a company that respects the needs and expectations of its employees and clients. If either is compromised, adjustments will be made so that the company culture may remain intact.
1.3 Keys to Success
Our keys to success are:
- To maintain client satisfaction of at least 90%.
- To keep overhead low.
- To ensure professional marketing and presentation of services.
- To provide an active and functional website.
Company Summary
Growth Management and Strategies was established as a C corporation. The company’s headquarters are located in Boston, MA, near Copely Place. The company was established as a result of the efforts of its owner, Bill Dawson, and his experience in leading small businesses into prolonged periods of growth and innovation. Dawson worked for McKinsey before being hired away to Bain and Company. A Harvard graduate, Dawson spent hundreds of hours each week for nearly a year, slowly building the company to where it is now.
The company has had numerous successes this year, including one client that was purchased by a major multinational conglomerate, and another that experienced product sales growth of over 700% the first year.
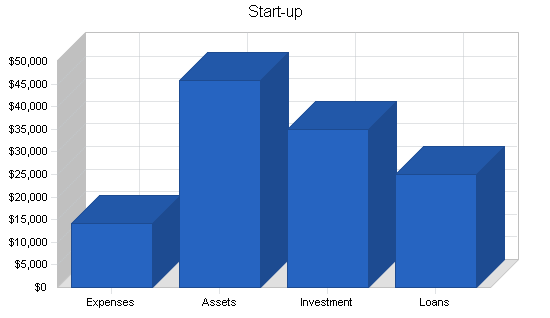
2.1 Start-up Summary
This start-up summary table lists all the costs associated with establishing a lease, purchasing office equipment, and pulling together the other resources necessary to get the business off the ground. Furniture, LAN lines, and additional technology purchases are a must in order to properly communicate with clients, and to establish a website.
Other services included in the start-up summary are legal consulting fees, kept to a minimum thanks to resources provided by Nolo. Incorporation fees are included in the legal fees line item.
The free cash flow (cash balance) appearing in this start-up table is high relative to other small consulting businesses of its size. The owner is preoccupied with maintaining positive cash flow, and is risk averse enough to understand that during months in which contracts are not available, the corporation must sustain itself. With this said, planned debt leverage is low, therefore risk to the lender is relatively low as well.
| Start-up | |
| Requirements | |
| Start-up Expenses | |
| Legal (Incorporation, Books) | $350 |
| Stationery, Basic Office Supplies, etc. | $300 |
| Collateral Materials (Printing and Design) | $1,500 |
| LAN, Wireless Network Setup | $550 |
| Business and Liability Insurance | $250 |
| Lease Deposit and First Month | $5,400 |
| Market Research Data | $1,250 |
| Website Hosting | $100 |
| Computer, Printer, other Expensed Equip. | $4,500 |
| Total Start-up Expenses | $14,200 |
| Start-up Assets | |
| Cash Required | $45,800 |
| Other Current Assets | $0 |
| Long-term Assets | $0 |
| Total Assets | $45,800 |
| Total Requirements | $60,000 |
| Start-up Funding | |
| Start-up Expenses to Fund | $14,200 |
| Start-up Assets to Fund | $45,800 |
| Total Funding Required | $60,000 |
| Assets | |
| Non-cash Assets from Start-up | $0 |
| Cash Requirements from Start-up | $45,800 |
| Additional Cash Raised | $0 |
| Cash Balance on Starting Date | $45,800 |
| Total Assets | $45,800 |
| Liabilities and Capital | |
| Liabilities | |
| Current Borrowing | $0 |
| Long-term Liabilities | $25,000 |
| Accounts Payable (Outstanding Bills) | $0 |
| Other Current Liabilities (interest-free) | $0 |
| Total Liabilities | $25,000 |
| Capital | |
| Planned Investment | |
| Dawson | $35,000 |
| Other | $0 |
| Additional Investment Requirement | $0 |
| Total Planned Investment | $35,000 |
| Loss at Start-up (Start-up Expenses) | ($14,200) |
| Total Capital | $20,800 |
| Total Capital and Liabilities | $45,800 |
| Total Funding | $60,000 |
2.2 Company Ownership
Growth Management and Strategies is wholly owned by Bill Dawson, and is classified as an LLC.
Services
Growth Management and Strategies offers a variety of services to the small business client. Many of the services are customized for each client, and a bidding process is observed. The company also offers a traditional fixed rate sheet for its services.
Market Analysis Summary
The target customer owns a small business, and is generally dissatisfied with the revenue that the business is generating, or is dissatisfied with the daily management of their business. The customer is likely to operate a business worth between $200K and $10 million, with growth rates of between 1-10%, or even a negative growth rate.
Market growth, that is, the predicted growth in the small business sector within the Boston/Cambridge Metro area is expected to be around 3% per year. This may increase due to additional SBA lending programs designed to match the strengths of research and faculty grant work with the needs of the market and small businesses willing to take new products to market. Regardless of the market growth, the company’s customer base is far more dependant upon service needs, and a solid reputation. Mr. Dawson is well respected within the community, and has built a number of relationships with high profile individuals, and is a frequent contributor to the business section of the Boston Herald.
The corresponding market analysis table below breaks the potential market down into tactical sub-markets.
4.1 Market Segmentation
The market is divided up by revenue in the initial analysis, although other factors are very significant. It is important that the client business is operating at about the same level as the general economic growth rate, or is underperforming. The need for a turnaround within the client company is necessary for Growth Management and Strategies’ expertise to become useful. The following are other differentiators:

- Debt of more than 30% yearly revenue.
- Free cash flow frequently in the negative, requiring deep pocket borrowing or investment.
- Long-term growth underperforming relative to competitors.
- Management discord and performance issues.
These are not the only differentiators used to determine the market potential for a client, they are simply a starting point for the sales team as they reach out to this group of small businesses, owners and investors.

| Market Analysis | |||||||
| Year 1 | Year 2 | Year 3 | Year 4 | Year 5 | |||
| Potential Customers | Growth | CAGR | |||||
| 200K – $500K Revenue | 4% | 1,250 | 1,300 | 1,352 | 1,406 | 1,462 | 3.99% |
| $501K – $3 million Revenue | 1% | 320 | 323 | 326 | 329 | 332 | 0.92% |
| $3 million – $10 million Revenue | -5% | 129 | 123 | 117 | 111 | 105 | -5.02% |
| Other | 0% | 0 | 0 | 0 | 0 | 0 | 0.00% |
| Total | 2.82% | 1,699 | 1,746 | 1,795 | 1,846 | 1,899 | 2.82% |
4.2 Target Market Segment Strategy
The target market strategy involves isolating potential customers by revenue, then drilling down to very specific needs via the sales team’s needs analysis methodology.
The first tier customers, businesses with over $3 million in revenue, is more experienced in outsourcing and may find themselves more comfortable hiring Growth Management and Strategies on retainer. Strategically, a retainer helps maintain consistent cash flow, even if during some months these customers will require more services than what they have paid for that month. This issue will be addressed in the Personnel topic.
The second tier customers, those businesses operating at revenue levels of $501K – $3 million, typically are very excited to have moved out of the home office stage, and into a new level of stability. If they are self-funded, these businesses can be the most challenging to work with because they are often not willing to part with company shares, and don’t yet have a sense of what kind of marketing investment is necessary to grow a business at this stage. The company will serve these small businesses based on a bid cycle, and needs analysis.
The third tier customers are easier to identify, and more ubiquitous than the rest. These small businesses are operating on $200K – $500K in revenue, often are operating out of a home, and have a firm sense of their market and potential, yet have trouble executing their plans effectively, or following through on growth strategies that generate wealth. Again, the strategy is to provide these businesses with a short needs analysis, and focus on the quantity of such customers to maintain a solid revenue stream.
4.3 Service Business Analysis
This industry is split up between a variety of players, including small businesses advising small businesses, such as the case with Growth Management and Strategies, to large conglomerate multinational consulting firms that send in newbie MBAs and use their name recognition to convince their clients that every one of these MBAs will generate over $300K a year in value. Sometimes they do, but when they don’t, GMS plans to be there.
At the other end of the spectrum, there are a wide variety of mom and pop consulting firms owned by very talented people who simply don’t have the marketing resources or expertise to reach a broader spectrum of customer.
GMS is somewhere in between. With years of guerrilla marketing experience, and a long-term plan for success, Mr. Dawson is determined to build the company each client at a time, and to focus on a sales team that outperforms all the competitors.
GMS is planning to grow exponentially within the first two years, to over $2 million in consulting revenue. At this point the service business analysis will be re-evaluated from the outside in.
4.3.1 Competition and Buying Patterns
Typically small business clients will learn about the consulting services market through word-of-mouth experience passed on through a friend or contemporary. Still, outbound sales teams dominate this category, and the stronger your sales team and name recognition, the greater your odds of finding clients willing to place your company on retainer or accept your company’s bid. The most competitive players in this market tend to have some of the best sales teams in the industry, that is, people who know not only how to communicate the technical needs analysis in a non-technical way, but in addition, are able to follow through and execute on promises and provide accurate, industry specific information that is useful to the client even before the deal is made.
Price is also important, and operates on a complex tiered system that is dependant upon the effectiveness of a particular salesperson, the word-of-mouth (WOM) advertising already in the mind of the potential client, and the ability of the client to reform the way they think about their own business. The demands of turning a business around, or pushing it to the limits of its potential are in direct proportion to the price of each bid. GMS must be careful not to be lured into out bidding a competitor, only to find that the customer has no plans to modify their business plan, and are seeking a “magic bullet” that may or may not exist. Competition in this industry leads to frustration and burnout for many people, and it takes a strong sense of purpose to push the business beyond the realm of the high-intensity, low-return client.
Strategy and Implementation Summary
GMS will pursue a strategy in line with the experience of the owner, and implementation will be performance based and follow a clear path. Milestones are important to the implementation of this plan, and so is the vision and the will of the company’s owner, Mr. Dawson. The overall company strategy is tied very closely with the sales strategy, that is, with the front lines of the business. One of the biggest threats to any strategy is that they can become too high-minded, and not literal enough to translate into action. This will not be the case with GMS, a solid company that hires top talent and achieves it’s goals on time and on budget.
5.1 Competitive Edge
GMS has a significant competitive edge in the following areas:
- Customer service mobility – As a customer-centric firm, GMS offers no hold phone lines, same day email responses, and callbacks within one hour. In addition, the phone technology is set up in such a way as to provide salespeople with all databased information about the customer before they say “hello”.
- “Needs Analysis” service – Possibly the best competitive edge in an industry fraught with agressive outbound sales teams and your run of the mill ego-centric, customer alienating, consultants.
- A considerable network of contacts – Mr. Dawson is well connected in the area of general consulting, and his Harvard degree opens doors via simple bragging rights, and an extensive alumni network.
5.2 Marketing Strategy
GMS’s marketing strategy revolves around a three-tiered focus. At the top of pyramid one, imagine a customer service ideal. This ideal is also included in the competitive comparison.
Pyramid two is focused on the execution level of all sales efforts. Not just as a goal, but execution as a strategy for building a stronger focus and building on what has already been accomplished. There are many tactics available in this pyramid, and those details are available in the marketing plan upon request.
Pyramid three has at the top a team-centric company culture. Tactics revolve around building this culture from the ground up so that it rewards innovation and determination, and management shows no personal bias or favoritism except when a salesperson or consultant is outperforming the mean. Although this strategy appears to be an internal management goal or company summary object, it is highly relevant to marketing’s performance because without integrity standards and a consistent company culture, GMS’s marketing will feel disconnected and unsupported, and will suffer as a result. A more detailed breakdown of tactics and programs related to this strategy is available in the full marketing plan.
5.3 Sales Strategy
GMS plans to develop and train 5-6 new salespeople by year two. Upon start up, the primary sales contact will be Mr. Dawson, but this will change as the revenues increase, and the company is able to invest in human capital.
GMS has a sales strategy that focuses on an initial needs analysis. Once the results of the needs analysis has been forwarded or described over the phone to a potential client, the salesperson will ask for a personal interview, a chance to sit down and discuss specifics. At no time should this be perceived by the potential client as “pushy” or “agressive.”
The goal of this sales process is to get behind the numbers, and the business successes, to identify where the client’s needs lie. Once this is mapped out, GMS will decide how these problems can be best addressed, and will offer both a bid and some action points. If the client wants to use the action points to move forward on their own, this is very acceptable. GMS’s research has in fact shown that the clients that choose this path, often come back to seek additional information, and more often than not, accept the bid.
This strategy differs from the course often taken by large consulting firms in that the customer is not condescended to, or treated as if the knowledge isn’t right there in their own heads. Often, consulting companies will send a large ego to clean up a client’s mess, and find that the strategy backfires when the client only chooses to give the consultant the chance to bid. GMS’s sales strategy revolves around customer service and empowerment, not condescension and sales “closers.”
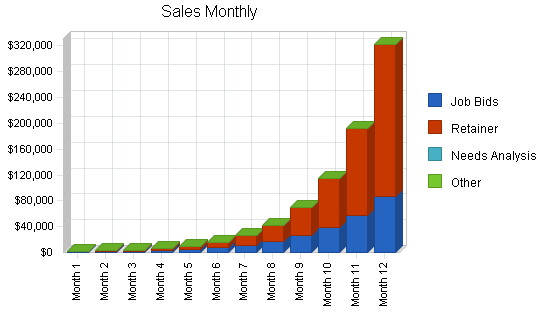
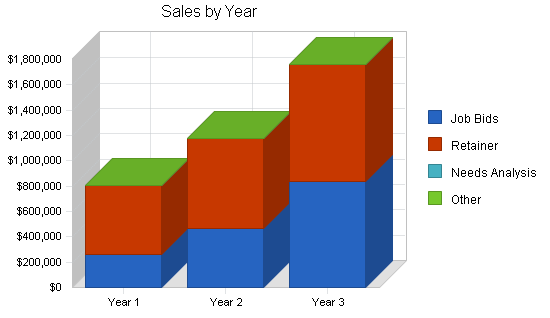
5.3.1 Sales Forecast
Sales forecast is based on the assumption that most of the revenue will be the result of consulting bids. The growth in retainer revenue is about 30% lower than the expected yearly growth in consulting bids of 80%/year. This may seem like an agressive number at first glance, but this is not a large company being discussed in this business plan. The smaller the company, often the larger the opportunity for exponential sales growth, and especially if the firm uses sound sales and marketing strategies to take share from the larger, less nimble consultancies.
The Needs Analysis service is listed only to highlight the fact that some outside information gathering firms/consultants will be used to compile the necessary information. This poses some risk because there are no costs associated with the Needs Analysis efforts. Nevertheless, GMS is confident that this product will set the company apart from the competition, and generate sales far in excess of the costs incurred.
| Sales Forecast | |||
| Year 1 | Year 2 | Year 3 | |
| Sales | |||
| Job Bids | $257,493 | $463,487 | $834,276 |
| Retainer | $549,337 | $714,138 | $928,379 |
| Needs Analysis | $0 | $0 | $0 |
| Other | $0 | $0 | $0 |
| Total Sales | $806,829 | $1,177,624 | $1,762,655 |
| Direct Cost of Sales | Year 1 | Year 2 | Year 3 |
| Job Bids | $0 | $0 | $0 |
| Retainer | $0 | $0 | $0 |
| Needs Analysis | $10,151 | $11,673 | $13,424 |
| Other | $0 | $0 | $0 |
| Subtotal Direct Cost of Sales | $10,151 | $11,673 | $13,424 |
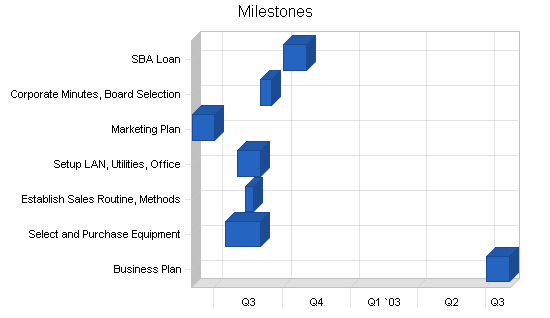
5.4 Milestones
The milestones table includes one listing each for the business plan and the marketing plan. Each of these are crucial to the long-term and short-term success of GMS. The other milestones are also important, but most are simply tasks necessary in starting up almost any business. Nevertheless, the most important milestone in this table is financial. The SBA loan will determine whether this company will have the working capital to operate for 5-12 months with little or no immediate revenue. If GMS cannot find the working capital to meet the minimum cash flow expectations set forth in this document, the company will dissolve and the owner will turn his talents elsewhere. Therefore, it is possible that the line item for “SBA Loan” may be changed to acquire family or friends as investors. Ideally it will not come to that and Mr. Dawson will be able to retain full control of the company, and direct it entirely based on his vision.
| Milestones | |||||
| Milestone | Start Date | End Date | Budget | Manager | Department |
| Business Plan | 7/1/2003 | 8/1/2003 | $250 | Dawson | NA |
| Select and Purchase Equipment | 7/15/2002 | 9/1/2002 | $4,500 | Dawson | NA |
| Establish Sales Routine, Methods | 8/12/2002 | 8/22/2002 | $0 | Dawson | NA |
| Setup LAN, Utilities, Office | 8/1/2002 | 9/1/2002 | $450 | Dawson | NA |
| Marketing Plan | 6/1/2002 | 7/1/2002 | $250 | Dawson | NA |
| Corporate Minutes, Board Selection | 9/1/2002 | 9/15/2002 | $0 | Dawson | NA |
| SBA Loan | 10/1/2002 | 11/1/2002 | $250 | Dawson | NA |
| Totals | $5,700 | ||||
Management Summary
The management team will initially consist of Bill Dawson. A Harvard MBA, and world-renowned consultant for major Fortune 500 companies, Mr. Dawson has built a reputation based his customer-centric approach to consulting, a relative anomaly in the world of high profile consulting. Many consultants are trained to believe they are right and the client was put on this earth to learn from the consultant. That is not the case for GMS, as the management team (Dawson) takes a different tact. The consultant acts as an interviewer, learning all that is possible to learn about the client in a one or two week period. As a management tool, this approach is very effective because it gives the sales team flexibility in dealing with potential customers, and relieves the uncomfortable pressure to close the sale.
Mr. Dawson’s approach to managing customers is also the approach he will take in dealing with his salespeople. GMS doesn’t need a hefty management structure, or administrative overhead. Many of those processes may be handled through outsourcing and Internet technology. On the contrary, the management structure at GMS is designed to reward the performer and educate the underperformer. Each salesperson is given a battery of psychological and rational tests, and most importantly, are screened based on how well they will fit into the Dawson management style. This leaves little to chance, and encourages a team atmosphere that remains light-hearted and fun.
6.1 Personnel Plan
This table demonstrates how GMS plans to start acquiring clients. One salesperson will be trained initially, and that person will later head a team of salespeople as the company expands. The promise of growth, and chance to work for a strategically positioned consulting business is enough to have three major players bidding for the job. Although each will see a major cut in salary from their current position, the chance to share in company profits (10%) and growth is enough to draw them to a low base, high commission position that offers no guarantees.
| Personnel Plan | |||
| Year 1 | Year 2 | Year 3 | |
| Salesperson #1 | $54,000 | $62,000 | $68,000 |
| Other | $0 | $0 | $0 |
| Total People | 1 | 3 | 5 |
| Total Payroll | $54,000 | $62,000 | $68,000 |
Financial Plan
The Financial Plan is based on a pending SBA loan, and a corresponding cash flow amount held in a highly liquid account.
7.1 Important Assumptions
The General Assumptions table explains various tax rates, personnel burden, and other financial inputs.
| General Assumptions | |||
| Year 1 | Year 2 | Year 3 | |
| Plan Month | 1 | 2 | 3 |
| Current Interest Rate | 7.00% | 7.00% | 7.00% |
| Long-term Interest Rate | 5.50% | 5.50% | 5.50% |
| Tax Rate | 31.83% | 32.00% | 31.83% |
| Other | 0 | 0 | 0 |
7.2 Break-even Analysis
The Break-even Analysis table is based on the assumption that each hour worked can be billed at approximately $70 per unit, and the employees will start at approximately $25/hour. This doesn’t include the cost of the payroll burden, however the assumptions are fairly accurate. Fixed costs are related to the lease and other monthly costs.

| Break-even Analysis | |
| Monthly Revenue Break-even | $10,203 |
| Assumptions: | |
| Average Percent Variable Cost | 1% |
| Estimated Monthly Fixed Cost | $10,075 |
7.3 Projected Cash Flow
The following table and chart show the Projected Cash Flow figures for Growth Management and Strategies.

| Pro Forma Cash Flow | |||
| Year 1 | Year 2 | Year 3 | |
| Cash Received | |||
| Cash from Operations | |||
| Cash Sales | $806,829 | $1,177,624 | $1,762,655 |
| Subtotal Cash from Operations | $806,829 | $1,177,624 | $1,762,655 |
| Additional Cash Received | |||
| Sales Tax, VAT, HST/GST Received | $0 | $0 | $0 |
| New Current Borrowing | $0 | $0 | $0 |
| New Other Liabilities (interest-free) | $0 | $0 | $0 |
| New Long-term Liabilities | $0 | $0 | $0 |
| Sales of Other Current Assets | $0 | $0 | $0 |
| Sales of Long-term Assets | $0 | $0 | $0 |
| New Investment Received | $0 | $0 | $0 |
| Subtotal Cash Received | $806,829 | $1,177,624 | $1,762,655 |
| Expenditures | Year 1 | Year 2 | Year 3 |
| Expenditures from Operations | |||
| Cash Spending | $54,000 | $62,000 | $68,000 |
| Bill Payments | $191,326 | $481,392 | $581,431 |
| Subtotal Spent on Operations | $245,326 | $543,392 | $649,431 |
| Additional Cash Spent | |||
| Sales Tax, VAT, HST/GST Paid Out | $0 | $0 | $0 |
| Principal Repayment of Current Borrowing | $0 | $0 | $0 |
| Other Liabilities Principal Repayment | $0 | $0 | $0 |
| Long-term Liabilities Principal Repayment | $0 | $0 | $0 |
| Purchase Other Current Assets | $0 | $0 | $0 |
| Purchase Long-term Assets | $0 | $0 | $0 |
| Dividends | $0 | $0 | $0 |
| Subtotal Cash Spent | $245,326 | $543,392 | $649,431 |
| Net Cash Flow | $561,503 | $634,232 | $1,113,224 |
| Cash Balance | $607,303 | $1,241,536 | $2,354,759 |
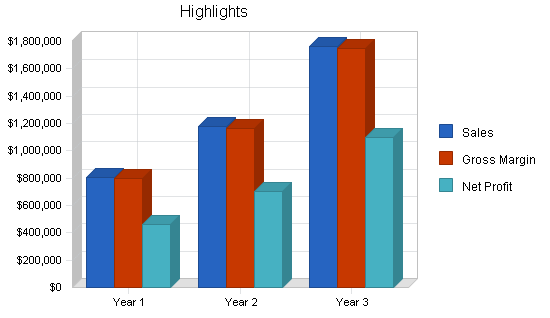
7.4 Projected Profit and Loss
The following table and charts are the Projected Profit and Loss and Gross Margin figures for Growth Management and Strategies.


| Pro Forma Profit and Loss | |||
| Year 1 | Year 2 | Year 3 | |
| Sales | $806,829 | $1,177,624 | $1,762,655 |
| Direct Cost of Sales | $10,151 | $11,673 | $13,424 |
| Other Costs of Sales | $0 | $0 | $0 |
| Total Cost of Sales | $10,151 | $11,673 | $13,424 |
| Gross Margin | $796,679 | $1,165,951 | $1,749,231 |
| Gross Margin % | 98.74% | 99.01% | 99.24% |
| Expenses | |||
| Payroll | $54,000 | $62,000 | $68,000 |
| Sales and Marketing and Other Expenses | $6,000 | $6,000 | $6,000 |
| Depreciation | $0 | $0 | $0 |
| Rent | $42,000 | $42,000 | $42,000 |
| Utilities | $7,800 | $7,800 | $7,800 |
| Insurance | $3,000 | $3,000 | $3,000 |
| Payroll Taxes | $8,100 | $9,300 | $10,200 |
| Other | $0 | $0 | $0 |
| Total Operating Expenses | $120,900 | $130,100 | $137,000 |
| Profit Before Interest and Taxes | $675,779 | $1,035,851 | $1,612,231 |
| EBITDA | $675,779 | $1,035,851 | $1,612,231 |
| Interest Expense | $1,375 | $1,375 | $1,375 |
| Taxes Incurred | $215,990 | $331,032 | $512,789 |
| Net Profit | $458,414 | $703,444 | $1,098,067 |
| Net Profit/Sales | 56.82% | 59.73% | 62.30% |
7.5 Projected Balance Sheet
The following table is the Projected Balance Sheet for Growth Management and Strategies.
| Pro Forma Balance Sheet | |||
| Year 1 | Year 2 | Year 3 | |
| Assets | |||
| Current Assets | |||
| Cash | $607,303 | $1,241,536 | $2,354,759 |
| Other Current Assets | $0 | $0 | $0 |
| Total Current Assets | $607,303 | $1,241,536 | $2,354,759 |
| Long-term Assets | |||
| Long-term Assets | $0 | $0 | $0 |
| Accumulated Depreciation | $0 | $0 | $0 |
| Total Long-term Assets | $0 | $0 | $0 |
| Total Assets | $607,303 | $1,241,536 | $2,354,759 |
| Liabilities and Capital | Year 1 | Year 2 | Year 3 |
| Current Liabilities | |||
| Accounts Payable | $103,090 | $33,878 | $49,035 |
| Current Borrowing | $0 | $0 | $0 |
| Other Current Liabilities | $0 | $0 | $0 |
| Subtotal Current Liabilities | $103,090 | $33,878 | $49,035 |
| Long-term Liabilities | $25,000 | $25,000 | $25,000 |
| Total Liabilities | $128,090 | $58,878 | $74,035 |
| Paid-in Capital | $35,000 | $35,000 | $35,000 |
| Retained Earnings | ($14,200) | $444,214 | $1,147,658 |
| Earnings | $458,414 | $703,444 | $1,098,067 |
| Total Capital | $479,214 | $1,182,658 | $2,280,725 |
| Total Liabilities and Capital | $607,303 | $1,241,536 | $2,354,759 |
| Net Worth | $479,214 | $1,182,658 | $2,280,725 |
7.6 Business Ratios
Business ratios for the years of this plan are shown below. Industry profile ratios based on the Standard Industrial Classification (SIC) code 8742, Business Management Consultants, are shown for comparison.
| Ratio Analysis | ||||
| Year 1 | Year 2 | Year 3 | Industry Profile | |
| Sales Growth | 0.00% | 45.96% | 49.68% | 6.98% |
| Percent of Total Assets | ||||
| Other Current Assets | 0.00% | 0.00% | 0.00% | 43.95% |
| Total Current Assets | 100.00% | 100.00% | 100.00% | 75.76% |
| Long-term Assets | 0.00% | 0.00% | 0.00% | 24.24% |
| Total Assets | 100.00% | 100.00% | 100.00% | 100.00% |
| Current Liabilities | 16.97% | 2.73% | 2.08% | 31.78% |
| Long-term Liabilities | 4.12% | 2.01% | 1.06% | 17.26% |
| Total Liabilities | 21.09% | 4.74% | 3.14% | 49.04% |
| Net Worth | 78.91% | 95.26% | 96.86% | 50.96% |
| Percent of Sales | ||||
| Sales | 100.00% | 100.00% | 100.00% | 100.00% |
| Gross Margin | 98.74% | 99.01% | 99.24% | 100.00% |
| Selling, General & Administrative Expenses | 41.90% | 39.27% | 37.09% | 85.31% |
| Advertising Expenses | 0.00% | 0.00% | 0.00% | 1.02% |
| Profit Before Interest and Taxes | 83.76% | 87.96% | 91.47% | 1.90% |
| Main Ratios | ||||
| Current | 5.89 | 36.65 | 48.02 | 1.88 |
| Quick | 5.89 | 36.65 | 48.02 | 1.48 |
| Total Debt to Total Assets | 21.09% | 4.74% | 3.14% | 55.78% |
| Pre-tax Return on Net Worth | 140.73% | 87.47% | 70.63% | 3.41% |
| Pre-tax Return on Assets | 111.05% | 83.32% | 68.41% | 7.72% |
| Additional Ratios | Year 1 | Year 2 | Year 3 | |
| Net Profit Margin | 56.82% | 59.73% | 62.30% | n.a |
| Return on Equity | 95.66% | 59.48% | 48.15% | n.a |
| Activity Ratios | ||||
| Accounts Payable Turnover | 2.86 | 12.17 | 12.17 | n.a |
| Payment Days | 27 | 61 | 25 | n.a |
| Total Asset Turnover | 1.33 | 0.95 | 0.75 | n.a |
| Debt Ratios | ||||
| Debt to Net Worth | 0.27 | 0.05 | 0.03 | n.a |
| Current Liab. to Liab. | 0.80 | 0.58 | 0.66 | n.a |
| Liquidity Ratios | ||||
| Net Working Capital | $504,214 | $1,207,658 | $2,305,725 | n.a |
| Interest Coverage | 491.48 | 753.35 | 1,172.53 | n.a |
| Additional Ratios | ||||
| Assets to Sales | 0.75 | 1.05 | 1.34 | n.a |
| Current Debt/Total Assets | 17% | 3% | 2% | n.a |
| Acid Test | 5.89 | 36.65 | 48.02 | n.a |
| Sales/Net Worth | 1.68 | 1.00 | 0.77 | n.a |
| Dividend Payout | 0.00 | 0.00 | 0.00 | n.a |
Appendix
| Sales Forecast | |||||||||||||
| Month 1 | Month 2 | Month 3 | Month 4 | Month 5 | Month 6 | Month 7 | Month 8 | Month 9 | Month 10 | Month 11 | Month 12 | ||
| Sales | |||||||||||||
| Job Bids | 0% | $1,000 | $1,500 | $2,250 | $3,375 | $5,063 | $7,594 | $11,391 | $17,086 | $25,629 | $38,443 | $57,665 | $86,498 |
| Retainer | 0% | $500 | $875 | $1,531 | $2,680 | $4,689 | $8,207 | $14,361 | $25,133 | $43,982 | $76,968 | $134,695 | $235,716 |
| Needs Analysis | 0% | $0 | $0 | $0 | $0 | $0 | $0 | $0 | $0 | $0 | $0 | $0 | $0 |
| Other | 0% | $0 | $0 | $0 | $0 | $0 | $0 | $0 | $0 | $0 | $0 | $0 | $0 |
| Total Sales | $1,500 | $2,375 | $3,781 | $6,055 | $9,752 | $15,800 | $25,752 | $42,218 | $69,611 | $115,412 | $192,360 | $322,213 | |
| Direct Cost of Sales | Month 1 | Month 2 | Month 3 | Month 4 | Month 5 | Month 6 | Month 7 | Month 8 | Month 9 | Month 10 | Month 11 | Month 12 | |
| Job Bids | $0 | $0 | $0 | $0 | $0 | $0 | $0 | $0 | $0 | $0 | $0 | $0 | |
| Retainer | $0 | $0 | $0 | $0 | $0 | $0 | $0 | $0 | $0 | $0 | $0 | $0 | |
| Needs Analysis | $350 | $403 | $463 | $532 | $612 | $704 | $810 | $931 | $1,071 | $1,231 | $1,416 | $1,628 | |
| Other | $0 | $0 | $0 | $0 | $0 | $0 | $0 | $0 | $0 | $0 | $0 | $0 | |
| Subtotal Direct Cost of Sales | $350 | $403 | $463 | $532 | $612 | $704 | $810 | $931 | $1,071 | $1,231 | $1,416 | $1,628 | |
| Personnel Plan | |||||||||||||
| Month 1 | Month 2 | Month 3 | Month 4 | Month 5 | Month 6 | Month 7 | Month 8 | Month 9 | Month 10 | Month 11 | Month 12 | ||
| Salesperson #1 | 0% | $4,500 | $4,500 | $4,500 | $4,500 | $4,500 | $4,500 | $4,500 | $4,500 | $4,500 | $4,500 | $4,500 | $4,500 |
| Other | 0% | $0 | $0 | $0 | $0 | $0 | $0 | $0 | $0 | $0 | $0 | $0 | $0 |
| Total People | 1 | 1 | 1 | 1 | 1 | 1 | 1 | 1 | 1 | 1 | 1 | 1 | |
| Total Payroll | $4,500 | $4,500 | $4,500 | $4,500 | $4,500 | $4,500 | $4,500 | $4,500 | $4,500 | $4,500 | $4,500 | $4,500 | |
| General Assumptions | |||||||||||||
| Month 1 | Month 2 | Month 3 | Month 4 | Month 5 | Month 6 | Month 7 | Month 8 | Month 9 | Month 10 | Month 11 | Month 12 | ||
| Plan Month | 1 | 2 | 3 | 4 | 5 | 6 | 7 | 8 | 9 | 10 | 11 | 12 | |
| Current Interest Rate | 7.00% | 7.00% | 7.00% | 7.00% | 7.00% | 7.00% | 7.00% | 7.00% | 7.00% | 7.00% | 7.00% | 7.00% | |
| Long-term Interest Rate | 5.50% | 5.50% | 5.50% | 5.50% | 5.50% | 5.50% | 5.50% | 5.50% | 5.50% | 5.50% | 5.50% | 5.50% | |
| Tax Rate | 30.00% | 32.00% | 32.00% | 32.00% | 32.00% | 32.00% | 32.00% | 32.00% | 32.00% | 32.00% | 32.00% | 32.00% | |
| Other | 0 | 0 | 0 | 0 | 0 | 0 | 0 | 0 | 0 | 0 | 0 | 0 | |
| Pro Forma Profit and Loss | |||||||||||||
| Month 1 | Month 2 | Month 3 | Month 4 | Month 5 | Month 6 | Month 7 | Month 8 | Month 9 | Month 10 | Month 11 | Month 12 | ||
| Sales | $1,500 | $2,375 | $3,781 | $6,055 | $9,752 | $15,800 | $25,752 | $42,218 | $69,611 | $115,412 | $192,360 | $322,213 | |
| Direct Cost of Sales | $350 | $403 | $463 | $532 | $612 | $704 | $810 | $931 | $1,071 | $1,231 | $1,416 | $1,628 | |
| Other Costs of Sales | $0 | $0 | $0 | $0 | $0 | $0 | $0 | $0 | $0 | $0 | $0 | $0 | |
| Total Cost of Sales | $350 | $403 | $463 | $532 | $612 | $704 | $810 | $931 | $1,071 | $1,231 | $1,416 | $1,628 | |
| Gross Margin | $1,150 | $1,973 | $3,318 | $5,522 | $9,140 | $15,096 | $24,943 | $41,287 | $68,540 | $114,180 | $190,944 | $320,585 | |
| Gross Margin % | 76.67% | 83.05% | 87.76% | 91.21% | 93.72% | 95.54% | 96.86% | 97.79% | 98.46% | 98.93% | 99.26% | 99.49% | |
| Expenses | |||||||||||||
| Payroll | $4,500 | $4,500 | $4,500 | $4,500 | $4,500 | $4,500 | $4,500 | $4,500 | $4,500 | $4,500 | $4,500 | $4,500 | |
| Sales and Marketing and Other Expenses | $500 | $500 | $500 | $500 | $500 | $500 | $500 | $500 | $500 | $500 | $500 | $500 | |
| Depreciation | $0 | $0 | $0 | $0 | $0 | $0 | $0 | $0 | $0 | $0 | $0 | $0 | |
| Rent | $3,500 | $3,500 | $3,500 | $3,500 | $3,500 | $3,500 | $3,500 | $3,500 | $3,500 | $3,500 | $3,500 | $3,500 | |
| Utilities | $650 | $650 | $650 | $650 | $650 | $650 | $650 | $650 | $650 | $650 | $650 | $650 | |
| Insurance | $250 | $250 | $250 | $250 | $250 | $250 | $250 | $250 | $250 | $250 | $250 | $250 | |
| Payroll Taxes | 15% | $675 | $675 | $675 | $675 | $675 | $675 | $675 | $675 | $675 | $675 | $675 | $675 |
| Other | $0 | $0 | $0 | $0 | $0 | $0 | $0 | $0 | $0 | $0 | $0 | $0 | |
| Total Operating Expenses | $10,075 | $10,075 | $10,075 | $10,075 | $10,075 | $10,075 | $10,075 | $10,075 | $10,075 | $10,075 | $10,075 | $10,075 | |
| Profit Before Interest and Taxes | ($8,925) | ($8,103) | ($6,757) | ($4,553) | ($935) | $5,021 | $14,868 | $31,212 | $58,465 | $104,105 | $180,869 | $310,510 | |
| EBITDA | ($8,925) | ($8,103) | ($6,757) | ($4,553) | ($935) | $5,021 | $14,868 | $31,212 | $58,465 | $104,105 | $180,869 | $310,510 | |
| Interest Expense | $115 | $115 | $115 | $115 | $115 | $115 | $115 | $115 | $115 | $115 | $115 | $115 | |
| Taxes Incurred | ($2,712) | ($2,629) | ($2,199) | ($1,494) | ($336) | $1,570 | $4,721 | $9,951 | $18,672 | $33,277 | $57,841 | $99,327 | |
| Net Profit | ($6,328) | ($5,588) | ($4,672) | ($3,174) | ($714) | $3,337 | $10,032 | $21,147 | $39,678 | $70,714 | $122,913 | $211,069 | |
| Net Profit/Sales | -421.85% | -235.27% | -123.57% | -52.42% | -7.32% | 21.12% | 38.96% | 50.09% | 57.00% | 61.27% | 63.90% | 65.51% | |
| Pro Forma Cash Flow | |||||||||||||
| Month 1 | Month 2 | Month 3 | Month 4 | Month 5 | Month 6 | Month 7 | Month 8 | Month 9 | Month 10 | Month 11 | Month 12 | ||
| Cash Received | |||||||||||||
| Cash from Operations | |||||||||||||
| Cash Sales | $1,500 | $2,375 | $3,781 | $6,055 | $9,752 | $15,800 | $25,752 | $42,218 | $69,611 | $115,412 | $192,360 | $322,213 | |
| Subtotal Cash from Operations | $1,500 | $2,375 | $3,781 | $6,055 | $9,752 | $15,800 | $25,752 | $42,218 | $69,611 | $115,412 | $192,360 | $322,213 | |
| Additional Cash Received | |||||||||||||
| Sales Tax, VAT, HST/GST Received | 0.00% | $0 | $0 | $0 | $0 | $0 | $0 | $0 | $0 | $0 | $0 | $0 | $0 |
| New Current Borrowing | $0 | $0 | $0 | $0 | $0 | $0 | $0 | $0 | $0 | $0 | $0 | $0 | |
| New Other Liabilities (interest-free) | $0 | $0 | $0 | $0 | $0 | $0 | $0 | $0 | $0 | $0 | $0 | $0 | |
| New Long-term Liabilities | $0 | $0 | $0 | $0 | $0 | $0 | $0 | $0 | $0 | $0 | $0 | $0 | |
| Sales of Other Current Assets | $0 | $0 | $0 | $0 | $0 | $0 | $0 | $0 | $0 | $0 | $0 | $0 | |
| Sales of Long-term Assets | $0 | $0 | $0 | $0 | $0 | $0 | $0 | $0 | $0 | $0 | $0 | $0 | |
| New Investment Received | $0 | $0 | $0 | $0 | $0 | $0 | $0 | $0 | $0 | $0 | $0 | $0 | |
| Subtotal Cash Received | $1,500 | $2,375 | $3,781 | $6,055 | $9,752 | $15,800 | $25,752 | $42,218 | $69,611 | $115,412 | $192,360 | $322,213 | |
| Expenditures | Month 1 | Month 2 | Month 3 | Month 4 | Month 5 | Month 6 | Month 7 | Month 8 | Month 9 | Month 10 | Month 11 | Month 12 | |
| Expenditures from Operations | |||||||||||||
| Cash Spending | $4,500 | $4,500 | $4,500 | $4,500 | $4,500 | $4,500 | $4,500 | $4,500 | $4,500 | $4,500 | $4,500 | $4,500 | |
| Bill Payments | $111 | $3,332 | $3,479 | $3,979 | $4,770 | $6,032 | $8,072 | $11,398 | $16,867 | $25,925 | $41,023 | $66,337 | |
| Subtotal Spent on Operations | $4,611 | $7,832 | $7,979 | $8,479 | $9,270 | $10,532 | $12,572 | $15,898 | $21,367 | $30,425 | $45,523 | $70,837 | |
| Additional Cash Spent | |||||||||||||
| Sales Tax, VAT, HST/GST Paid Out | $0 | $0 | $0 | $0 | $0 | $0 | $0 | $0 | $0 | $0 | $0 | $0 | |
| Principal Repayment of Current Borrowing | $0 | $0 | $0 | $0 | $0 | $0 | $0 | $0 | $0 | $0 | $0 | $0 | |
| Other Liabilities Principal Repayment | $0 | $0 | $0 | $0 | $0 | $0 | $0 | $0 | $0 | $0 | $0 | $0 | |
| Long-term Liabilities Principal Repayment | $0 | $0 | $0 | $0 | $0 | $0 | $0 | $0 | $0 | $0 | $0 | $0 | |
| Purchase Other Current Assets | $0 | $0 | $0 | $0 | $0 | $0 | $0 | $0 | $0 | $0 | $0 | $0 | |
| Purchase Long-term Assets | $0 | $0 | $0 | $0 | $0 | $0 | $0 | $0 | $0 | $0 | $0 | $0 | |
| Dividends | $0 | $0 | $0 | $0 | $0 | $0 | $0 | $0 | $0 | $0 | $0 | $0 | |
| Subtotal Cash Spent | $4,611 | $7,832 | $7,979 | $8,479 | $9,270 | $10,532 | $12,572 | $15,898 | $21,367 | $30,425 | $45,523 | $70,837 | |
| Net Cash Flow | ($3,111) | ($5,457) | ($4,198) | ($2,425) | $482 | $5,268 | $13,180 | $26,320 | $48,244 | $84,987 | $146,837 | $251,376 | |
| Cash Balance | $42,689 | $37,232 | $33,034 | $30,609 | $31,092 | $36,360 | $49,539 | $75,859 | $124,103 | $209,090 | $355,927 | $607,303 | |
| Pro Forma Balance Sheet | |||||||||||||
| Month 1 | Month 2 | Month 3 | Month 4 | Month 5 | Month 6 | Month 7 | Month 8 | Month 9 | Month 10 | Month 11 | Month 12 | ||
| Assets | Starting Balances | ||||||||||||
| Current Assets | |||||||||||||
| Cash | $45,800 | $42,689 | $37,232 | $33,034 | $30,609 | $31,092 | $36,360 | $49,539 | $75,859 | $124,103 | $209,090 | $355,927 | $607,303 |
| Other Current Assets | $0 | $0 | $0 | $0 | $0 | $0 | $0 | $0 | $0 | $0 | $0 | $0 | $0 |
| Total Current Assets | $45,800 | $42,689 | $37,232 | $33,034 | $30,609 | $31,092 | $36,360 | $49,539 | $75,859 | $124,103 | $209,090 | $355,927 | $607,303 |
| Long-term Assets | |||||||||||||
| Long-term Assets | $0 | $0 | $0 | $0 | $0 | $0 | $0 | $0 | $0 | $0 | $0 | $0 | $0 |
| Accumulated Depreciation | $0 | $0 | $0 | $0 | $0 | $0 | $0 | $0 | $0 | $0 | $0 | $0 | $0 |
| Total Long-term Assets | $0 | $0 | $0 | $0 | $0 | $0 | $0 | $0 | $0 | $0 | $0 | $0 | $0 |
| Total Assets | $45,800 | $42,689 | $37,232 | $33,034 | $30,609 | $31,092 | $36,360 | $49,539 | $75,859 | $124,103 | $209,090 | $355,927 | $607,303 |
| Liabilities and Capital | Month 1 | Month 2 | Month 3 | Month 4 | Month 5 | Month 6 | Month 7 | Month 8 | Month 9 | Month 10 | Month 11 | Month 12 | |
| Current Liabilities | |||||||||||||
| Accounts Payable | $0 | $3,217 | $3,347 | $3,822 | $4,571 | $5,767 | $7,698 | $10,846 | $16,020 | $24,585 | $38,858 | $62,782 | $103,090 |
| Current Borrowing | $0 | $0 | $0 | $0 | $0 | $0 | $0 | $0 | $0 | $0 | $0 | $0 | $0 |
| Other Current Liabilities | $0 | $0 | $0 | $0 | $0 | $0 | $0 | $0 | $0 | $0 | $0 | $0 | $0 |
| Subtotal Current Liabilities | $0 | $3,217 | $3,347 | $3,822 | $4,571 | $5,767 | $7,698 | $10,846 | $16,020 | $24,585 | $38,858 | $62,782 | $103,090 |
| Long-term Liabilities | $25,000 | $25,000 | $25,000 | $25,000 | $25,000 | $25,000 | $25,000 | $25,000 | $25,000 | $25,000 | $25,000 | $25,000 | $25,000 |
| Total Liabilities | $25,000 | $28,217 | $28,347 | $28,822 | $29,571 | $30,767 | $32,698 | $35,846 | $41,020 | $49,585 | $63,858 | $87,782 | $128,090 |
| Paid-in Capital | $35,000 | $35,000 | $35,000 | $35,000 | $35,000 | $35,000 | $35,000 | $35,000 | $35,000 | $35,000 | $35,000 | $35,000 | $35,000 |
| Retained Earnings | ($14,200) | ($14,200) | ($14,200) | ($14,200) | ($14,200) | ($14,200) | ($14,200) | ($14,200) | ($14,200) | ($14,200) | ($14,200) | ($14,200) | ($14,200) |
| Earnings | $0 | ($6,328) | ($11,915) | ($16,588) | ($19,761) | ($20,475) | ($17,139) | ($7,107) | $14,040 | $53,718 | $124,432 | $247,345 | $458,414 |
| Total Capital | $20,800 | $14,472 | $8,885 | $4,212 | $1,039 | $325 | $3,661 | $13,693 | $34,840 | $74,518 | $145,232 | $268,145 | $479,214 |
| Total Liabilities and Capital | $45,800 | $42,689 | $37,232 | $33,034 | $30,609 | $31,092 | $36,360 | $49,539 | $75,859 | $124,103 | $209,090 | $355,927 | $607,303 |
| Net Worth | $20,800 | $14,472 | $8,885 | $4,212 | $1,039 | $325 | $3,661 | $13,693 | $34,840 | $74,518 | $145,232 | $268,145 | $479,214 |


