
Ideal Business Support Services
Executive Summary
Ideal Business Support is a full-service support agency for the insurance industry. Ideal offers a wide range of support services tailored for insurance agents. Ideal will specialize on a few offerings, but can do almost anything. While the support service market is competitive, most companies are generalists. Ideal will stand out by concentrating on the insurance niche.
Ideal has two strong competitive advantages. The first is industry knowledge of insurance. Sarah Helpinghand, the owner, spent five years previous to Ideal working as an insurance agent. This experience is priceless. Additionally, the value of networking based on Sarah’s previous insurance relationships will give Ideal a large leg up on the competition.
Lastly, Sarah will be designing an intensive training program to share her intellectual capital regarding the insurance industry with the rest of her company. All employees with go through this training.
Ideal is projected to reach profitability by month 11 and will have modest net profits by year three.

1.1 Mission
Ideal Business Support’s mission is to provide the highest quality support services for insurance agent industry. We exist to attract and maintain customers. When we adhere to this maxim, everything else will fall into place. Our services will exceed the expectations of our customers.
1.2 Objectives
The objectives for the first three years of operation include:
- To create a service-based company whose primary goal is to exceed customers’ expectations.
- The utilization of Ideal in at least 20 different insurance agents practices.
- To increase the number of clients served by 20% per year through superior performance.
- To develop a sustainable start-up business that is profitable.
Company Summary
Ideal Business Support Services, soon to be located in Salem, OR, will offer business support services for the insurance industry. Ideal will concentrate on transcription, database management, word processing and website development. These services will be offered to insurance agents who do not have the staff to perform these functions. By providing these services to the agents, the agents do not need to pay the overhead for the equipment, personnel, and knowledge.
The business will be based in downtown Salem and will have four employees in addition to Sarah Helpinghand, the founder and owner. Ideal is projected to reach profitability by month 11.
2.1 Company Ownership
Ideal Business Support Services is an Oregon corporation owned by Sarah Helpinghand.
2.2 Start-up Summary
Ideal Business Support Services have the following start-up expenses:
- Computer system with three workstations, a printer, CD-RW, Microsoft Office, and Microsoft Access.
- Office furniture including four desks and chairs, three file cabinets.
- Legal fees regarding business formation and generating and reviewing contracts.
- Copier, fax, and two phone lines.
- Website development.
- Various office supplies.
- Two laptop computers with Pentium processors and Microsoft Office Professional version.
- Transcription machine.
Please note that any equipment that will be used for more than a year will be considered a long-term asset and will be depreciated using the straight-line method.
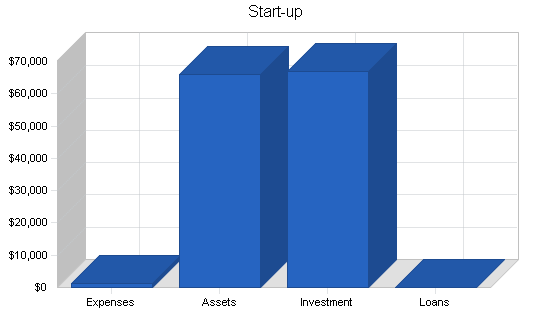
| Start-up | |
| Requirements | |
| Start-up Expenses | |
| Legal | $1,000 |
| Stationery etc. | $100 |
| Other | $0 |
| Total Start-up Expenses | $1,100 |
| Start-up Assets | |
| Cash Required | $57,400 |
| Other Current Assets | $0 |
| Long-term Assets | $8,500 |
| Total Assets | $65,900 |
| Total Requirements | $67,000 |
| Start-up Funding | |
| Start-up Expenses to Fund | $1,100 |
| Start-up Assets to Fund | $65,900 |
| Total Funding Required | $67,000 |
| Assets | |
| Non-cash Assets from Start-up | $8,500 |
| Cash Requirements from Start-up | $57,400 |
| Additional Cash Raised | $0 |
| Cash Balance on Starting Date | $57,400 |
| Total Assets | $65,900 |
| Liabilities and Capital | |
| Liabilities | |
| Current Borrowing | $0 |
| Long-term Liabilities | $0 |
| Accounts Payable (Outstanding Bills) | $0 |
| Other Current Liabilities (interest-free) | $0 |
| Total Liabilities | $0 |
| Capital | |
| Planned Investment | |
| Sarah | $67,000 |
| Other | $0 |
| Additional Investment Requirement | $0 |
| Total Planned Investment | $67,000 |
| Loss at Start-up (Start-up Expenses) | ($1,100) |
| Total Capital | $65,900 |
| Total Capital and Liabilities | $65,900 |
| Total Funding | $67,000 |
Services
Ideal Business Support Services, as the name implies, offers support services for the insurance industry. Ideal’s service offerings will be diverse, however, it will be specializing in transcription, database management, word processing, and website development and maintenance.
These services will be typically used by insurance agents who do not have the need to have a full-time person on payroll and the equipment in overhead. Ideal will be able to come in on short notice and perform the tasks that are needed by the agent.
Market Analysis Summary
Ideal will be focusing on a very specific part of the business market, the insurance industry. Within the industry there are two types of agents, exclusive agents that represent one specific company, and insurance brokers who represent multiple insurance companies.
Everyone needs insurance. Some types, such as car insurance is mandate by law. Other types, such as homeowners, just make good fiscal sense. For these reasons alone, the insurance industry is going to be around for a while and it makes sense to concentrate on them.
Salem has several support service companies but none as focussed as Ideal and none with the same industry knowledge that Ideal has.
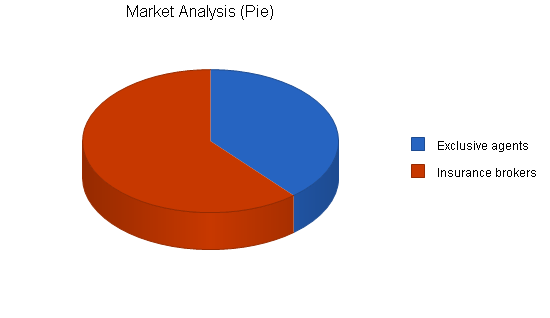
4.1 Market Segmentation
The insurance market that is in need of support services can be broken down into two segments:
- Exclusive agents: these agents represent only one type of insurance, such as State Farm. While the selection here is limited, the advantage of the exclusive agent is that they have a strong relationship with their representative company which is good for any claims issues. The stronger the relationship the agent has with the insurance company, the more effective of a cheerleader they can be for you.
- Insurance brokers: these agents do not have an exclusive contract with any one insurance company. They can offer insurance from multiple companies. The advantage of this set up is that they can offer a wider range of service offerings than an agent who only sells one brand of insurance.
| Market Analysis | |||||||
| Year 1 | Year 2 | Year 3 | Year 4 | Year 5 | |||
| Potential Customers | Growth | CAGR | |||||
| Exclusive agents | 7% | 78 | 83 | 89 | 95 | 102 | 6.94% |
| Insurance brokers | 8% | 123 | 133 | 144 | 156 | 168 | 8.11% |
| Total | 7.66% | 201 | 216 | 233 | 251 | 270 | 7.66% |
4.2 Target Market Segment Strategy
Ideal Business Support Services is focusing on the insurance industry because the agents that represent the insurance companies are often located in small offices. An insurance agent will have one or two support staff in their office in addition to the agent. This is a perfect atmosphere for a support agency because the services Ideal provides are typically out of the field of expertise for the normal support staff.
Another reason for focusing on a specific industry is that it is easier to be competitive when the focus of a business is narrow. Too often a business will stagnate when they try to do to many different things to too many customers. A narrow focus is very beneficial for a company, particularly one that is just starting up.
For these reasons, Ideal Business Support Services will concentrate on the insurance industry to be able to quickly grow and obtain market share.
4.3 Service Business Analysis
There are approximately 70-100 different insurance agents in the Salem area alone. While some are in larger offices, many are one or two person agent offices. This high concentration of small insurance agents is due to a previous historical trend where the service offering of insurance was done at the local level by “someone you could trust.” Recently there has been the trend to offer insurance without an agent, via the phone or Internet. While this method of service delivery has gained market share, there is no reason to believe that it will eclipse the original agent-customer relationship. For many people, insurance is a very personal thing and they are more comfortable to discuss insurance needs in person with an agent as opposed to taking a chance and purchasing a commodity-like insurance over the phone or Internet. There is significant value in having the agent who knows you personally as your advocate against the insurance company if problems arise. For these reasons, the insurance agent will be around for a long time to come.

4.3.1 Competition and Buying Patterns
The competition consists of many different support service companies that offer a very wide range of service offerings. These companies replicate the offerings of Ideal, however none target the insurance industry only.
The buying patterns of the agents mimic a long-term relationship. If they are happy they will generally stay with the same service provider. The reasons for this is that there is generally a break-in period where both parties spend time getting to know each other, and the different needs each has. If this can be done up front once and never again, then it is more cost effective then jumping through the hoops each time.
Strategy and Implementation Summary
Ideal will use its sustainable competitive advantages to steadily gain market share. The first advantage is based on extensive inside industry knowledge of the insurance field. The second advantage is an already established network of contacts within the industry.
While these competitive advantages currently reside in Sarah’s head as intellectual capital, it will be downloaded to the organization through intensive training courses that Sarah is designing and putting all employees through.
5.1 Sales Strategy
Ideal’s sales strategy will based on closing the deal through a persuasive spiel detailing how Ideal can provide a superior service relative to the competitor. Because Ideal is intimately familiar with the industry, they can provide a superior service for the same cost.
This approach will only work with agents that have already decided to forgo an in-house support staff and are trying to decide between a specific support staff.
Sarah will also be targeting newly registered agents who are making the decision whether to have an in-house solution or to outsource the service. Although Sarah no longer sells insurance, she has kept her license current. This allows her to be part of the various insurance associations that agents typically belong to. By being an active member of the association, she is able to do a lot of networking for her business. This develops new relationships with insurance agents that she was not aware of before while in practice. Additionally, it allows her to maintain relationships with all the agents that she was colleagues with previously. Sarah will turn this access into contracts.
5.1.1 Sales Forecast
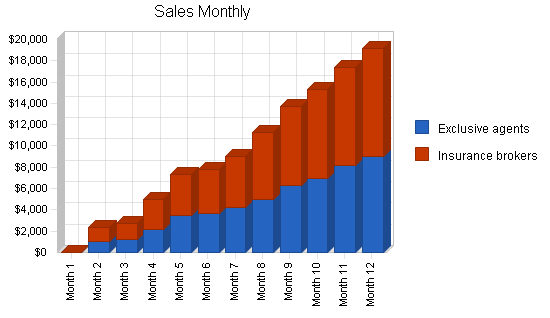
The first month will be used to set up the office. This will include choosing the site, purchasing furniture, and setting up the computer network. During this first month Sarah will be contacting some of her former colleagues
The first week of the second month will be used for an intensive training of two of the support staff. The last three weeks of the month will see some sales activity. Sales will steadily increase from this point.
Month five will see the hiring of the final two support staff. They will also be trained during the first week of the month and then will take on a work load.
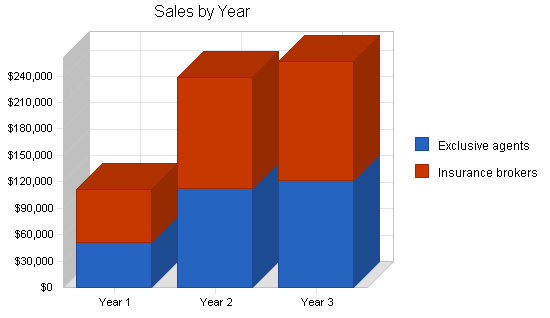
| Sales Forecast | |||
| Year 1 | Year 2 | Year 3 | |
| Sales | |||
| Exclusive agents | $51,049 | $112,548 | $121,458 |
| Insurance brokers | $59,812 | $125,745 | $134,745 |
| Total Sales | $110,861 | $238,293 | $256,203 |
| Direct Cost of Sales | Year 1 | Year 2 | Year 3 |
| Exclusive agents | $7,657 | $16,882 | $18,219 |
| Insurance brokers | $8,972 | $18,862 | $20,212 |
| Subtotal Direct Cost of Sales | $16,629 | $35,744 | $38,430 |
5.2 Competitive Edge
Ideal’s competitive edge is a very specific, deep industry knowledge of insurance. While having this specific knowledge will preclude a lot of the market, it makes a small part of the market quite attractive to you and your customers.
This deep industry knowledge is based on Sarah’s five years spent as an independent insurance agent. Sarah will then gather all of this intellectual capital and process it into a training program so is is shared knowledge throughout the organization.
This approach is somewhat backwards relative to the norm for the support service industry. Generally, the background of the company owner is from the support staff industry. They then apply the support staff proficiencies to the industry of their different customers. Sarah believes that the intricacies of the insurance industry are far more complex then that of the support agency. Her rationale is that she can pick up the few things she does not know about support much quicker than having to learn about each industry.
Sarah’s industry access is valuable for networking as well. Having spent time in the industry, Sarah developed many strong relationships with agents. Having established these relationships previously created a trust bond that is significant when it comes to attempting to transform the professional insurance relationship to a support service based relationship.
5.3 Milestones
Ideal will have several milestones early on:
- Business plan completion. This will be done as a roadmap for the organization. While Ideal does not need a business plan to raise capital, it will be an indispensable tool for the ongoing performance and improvement of the company.
- Office set up.
- Training program. This will be the development of a training program for the employees.
- Revenue of $50,000.
| Milestones | |||||
| Milestone | Start Date | End Date | Budget | Manager | Department |
| Business plan completion | 1/1/2001 | 2/1/2001 | $0 | ABC | Marketing |
| Office set up | 1/1/2001 | 2/1/2001 | $0 | ABC | Department |
| Training program | 1/1/2001 | 2/1/2001 | $0 | ABC | Department |
| Revenue of $50,000 | 1/1/2001 | 10/31/2001 | $0 | ABC | Department |
| Totals | $0 | ||||
Management Summary
Sarah Helpinghand, founder and owner received her Bachelor degree in business management from Willamette University. The summer of her last year she interned with State Farm Insurance which has a large corporate headquarter in Salem. From this internship Sarah was able to learn a lot about the insurance industry.
Upon graduation Sarah “fell into a job” through a contact at State Farm. Her friend knew an insurance agent who was retiring and looking for someone to take over their practice. Sarah came highly recommended and was offered the job. She readily accepted and spent five years as an agent. Toward the end of her tenure as an agent she was getting a bit restless. She was looking for a new challenge, something she could do all on her own. The idea one day dawned on her that she could leverage her industry knowledge of insurance, and with the bit of information she had about support services from college and create her own company.
6.1 Personnel Plan
Sarah will be working full time for Ideal. Her responsibilities will be generating contracts, training, payroll, customer service, and other back office tasks. During month two she will bring on board two support specialists. The headcount will remain at three until month five when the business generated will be too much for the two support staff and two more will be hired. The support staff will be paid $12 an hour, several dollars more an hour than the market rate. The purpose behind this is to protect Sarah’s investment in training the staff. It costs too much for her to invest time and money into training someone and have them leave after a few months. Paying the staff more than market is her insurance to keep them with the company.
| Personnel Plan | |||
| Year 1 | Year 2 | Year 3 | |
| Sarah | $30,000 | $30,000 | $30,000 |
| Support staff | $21,120 | $23,040 | $23,040 |
| Support staff | $21,120 | $23,040 | $23,040 |
| Support staff | $15,360 | $23,040 | $23,040 |
| Support staff | $15,360 | $23,040 | $23,040 |
| Total People | 5 | 5 | 5 |
| Total Payroll | $102,960 | $122,160 | $122,160 |
Financial Plan
The following sections will outline the important financial assumptions, key financial indicators, break-even analysis, profit and loss, cash flow, and the balance sheet.
7.1 Break-even Analysis
The break-even analysis indicates what is needed in monthly revenue to break even.

| Break-even Analysis | |
| Monthly Revenue Break-even | $13,445 |
| Assumptions: | |
| Average Percent Variable Cost | 15% |
| Estimated Monthly Fixed Cost | $11,428 |
7.2 Important Assumptions
The following table highlights some of the important financial assumptions for Ideal.
| General Assumptions | |||
| Year 1 | Year 2 | Year 3 | |
| Plan Month | 1 | 2 | 3 |
| Current Interest Rate | 10.00% | 10.00% | 10.00% |
| Long-term Interest Rate | 10.00% | 10.00% | 10.00% |
| Tax Rate | 25.42% | 25.00% | 25.42% |
| Other | 0 | 0 | 0 |
7.3 Projected Profit and Loss
The following table will indicate projected profit and loss.


| Pro Forma Profit and Loss | |||
| Year 1 | Year 2 | Year 3 | |
| Sales | $110,861 | $238,293 | $256,203 |
| Direct Cost of Sales | $16,629 | $35,744 | $38,430 |
| Other | $0 | $0 | $0 |
| Total Cost of Sales | $16,629 | $35,744 | $38,430 |
| Gross Margin | $94,232 | $202,549 | $217,773 |
| Gross Margin % | 85.00% | 85.00% | 85.00% |
| Expenses | |||
| Payroll | $102,960 | $122,160 | $122,160 |
| Sales and Marketing and Other Expenses | $3,000 | $2,500 | $2,500 |
| Depreciation | $2,832 | $2,832 | $2,832 |
| Leased Equipment | $0 | $0 | $0 |
| Utilities | $1,500 | $1,500 | $1,500 |
| Insurance | $1,800 | $1,800 | $1,800 |
| Rent | $9,600 | $9,600 | $9,600 |
| Payroll Taxes | $15,444 | $18,324 | $18,324 |
| Other | $0 | $0 | $0 |
| Total Operating Expenses | $137,136 | $158,716 | $158,716 |
| Profit Before Interest and Taxes | ($42,904) | $43,833 | $59,057 |
| EBITDA | ($40,072) | $46,665 | $61,889 |
| Interest Expense | $0 | $0 | $0 |
| Taxes Incurred | $0 | $10,958 | $15,010 |
| Net Profit | ($42,904) | $32,875 | $44,046 |
| Net Profit/Sales | -38.70% | 13.80% | 17.19% |
7.4 Projected Cash Flow
The following chart and table indicates projected cash flow.

| Pro Forma Cash Flow | |||
| Year 1 | Year 2 | Year 3 | |
| Cash Received | |||
| Cash from Operations | |||
| Cash Sales | $38,801 | $83,403 | $89,671 |
| Cash from Receivables | $48,735 | $128,079 | $162,764 |
| Subtotal Cash from Operations | $87,536 | $211,482 | $252,435 |
| Additional Cash Received | |||
| Sales Tax, VAT, HST/GST Received | $0 | $0 | $0 |
| New Current Borrowing | $0 | $0 | $0 |
| New Other Liabilities (interest-free) | $0 | $0 | $0 |
| New Long-term Liabilities | $0 | $0 | $0 |
| Sales of Other Current Assets | $0 | $0 | $0 |
| Sales of Long-term Assets | $0 | $0 | $0 |
| New Investment Received | $3,000 | $0 | $0 |
| Subtotal Cash Received | $90,536 | $211,482 | $252,435 |
| Expenditures | Year 1 | Year 2 | Year 3 |
| Expenditures from Operations | |||
| Cash Spending | $102,960 | $122,160 | $122,160 |
| Bill Payments | $42,443 | $79,346 | $86,611 |
| Subtotal Spent on Operations | $145,403 | $201,506 | $208,771 |
| Additional Cash Spent | |||
| Sales Tax, VAT, HST/GST Paid Out | $0 | $0 | $0 |
| Principal Repayment of Current Borrowing | $0 | $0 | $0 |
| Other Liabilities Principal Repayment | $0 | $0 | $0 |
| Long-term Liabilities Principal Repayment | $0 | $0 | $0 |
| Purchase Other Current Assets | $0 | $0 | $0 |
| Purchase Long-term Assets | $0 | $0 | $0 |
| Dividends | $0 | $0 | $0 |
| Subtotal Cash Spent | $145,403 | $201,506 | $208,771 |
| Net Cash Flow | ($54,867) | $9,976 | $43,664 |
| Cash Balance | $2,533 | $12,509 | $56,173 |
7.5 Projected Balance Sheet
The following table indicates the projected balance sheet.
| Pro Forma Balance Sheet | |||
| Year 1 | Year 2 | Year 3 | |
| Assets | |||
| Current Assets | |||
| Cash | $2,533 | $12,509 | $56,173 |
| Accounts Receivable | $23,325 | $50,136 | $53,904 |
| Other Current Assets | $0 | $0 | $0 |
| Total Current Assets | $25,858 | $62,645 | $110,077 |
| Long-term Assets | |||
| Long-term Assets | $8,500 | $8,500 | $8,500 |
| Accumulated Depreciation | $2,832 | $5,664 | $8,496 |
| Total Long-term Assets | $5,668 | $2,836 | $4 |
| Total Assets | $31,526 | $65,481 | $110,081 |
| Liabilities and Capital | Year 1 | Year 2 | Year 3 |
| Current Liabilities | |||
| Accounts Payable | $5,530 | $6,610 | $7,164 |
| Current Borrowing | $0 | $0 | $0 |
| Other Current Liabilities | $0 | $0 | $0 |
| Subtotal Current Liabilities | $5,530 | $6,610 | $7,164 |
| Long-term Liabilities | $0 | $0 | $0 |
| Total Liabilities | $5,530 | $6,610 | $7,164 |
| Paid-in Capital | $70,000 | $70,000 | $70,000 |
| Retained Earnings | ($1,100) | ($44,004) | ($11,129) |
| Earnings | ($42,904) | $32,875 | $44,046 |
| Total Capital | $25,996 | $58,871 | $102,917 |
| Total Liabilities and Capital | $31,526 | $65,481 | $110,081 |
| Net Worth | $25,996 | $58,871 | $102,917 |
7.6 Business Ratios
Business ratios for the years of this plan are shown below. Industry profile ratios based on the NAICS code 524298, Other Insurance Related Activities, are shown for comparison.
| Ratio Analysis | ||||
| Year 1 | Year 2 | Year 3 | Industry Profile | |
| Sales Growth | 0.00% | 114.95% | 7.52% | 3.95% |
| Percent of Total Assets | ||||
| Accounts Receivable | 73.99% | 76.57% | 48.97% | 24.53% |
| Other Current Assets | 0.00% | 0.00% | 0.00% | 69.49% |
| Total Current Assets | 82.02% | 95.67% | 100.00% | 94.07% |
| Long-term Assets | 17.98% | 4.33% | 0.00% | 5.93% |
| Total Assets | 100.00% | 100.00% | 100.00% | 100.00% |
| Current Liabilities | 17.54% | 10.10% | 6.51% | 29.76% |
| Long-term Liabilities | 0.00% | 0.00% | 0.00% | 9.55% |
| Total Liabilities | 17.54% | 10.10% | 6.51% | 39.31% |
| Net Worth | 82.46% | 89.90% | 93.49% | 60.69% |
| Percent of Sales | ||||
| Sales | 100.00% | 100.00% | 100.00% | 100.00% |
| Gross Margin | 85.00% | 85.00% | 85.00% | 100.00% |
| Selling, General & Administrative Expenses | 123.70% | 71.20% | 67.71% | 60.33% |
| Advertising Expenses | 1.62% | 0.55% | 0.51% | 1.26% |
| Profit Before Interest and Taxes | -38.70% | 18.39% | 23.05% | 6.43% |
| Main Ratios | ||||
| Current | 4.68 | 9.48 | 15.36 | 2.23 |
| Quick | 4.68 | 9.48 | 15.36 | 2.00 |
| Total Debt to Total Assets | 17.54% | 10.10% | 6.51% | 49.79% |
| Pre-tax Return on Net Worth | -165.04% | 74.46% | 57.38% | 7.52% |
| Pre-tax Return on Assets | -136.09% | 66.94% | 53.65% | 14.98% |
| Additional Ratios | Year 1 | Year 2 | Year 3 | |
| Net Profit Margin | -38.70% | 13.80% | 17.19% | n.a |
| Return on Equity | -165.04% | 55.84% | 42.80% | n.a |
| Activity Ratios | ||||
| Accounts Receivable Turnover | 3.09 | 3.09 | 3.09 | n.a |
| Collection Days | 55 | 87 | 114 | n.a |
| Accounts Payable Turnover | 8.68 | 12.17 | 12.17 | n.a |
| Payment Days | 27 | 28 | 29 | n.a |
| Total Asset Turnover | 3.52 | 3.64 | 2.33 | n.a |
| Debt Ratios | ||||
| Debt to Net Worth | 0.21 | 0.11 | 0.07 | n.a |
| Current Liab. to Liab. | 1.00 | 1.00 | 1.00 | n.a |
| Liquidity Ratios | ||||
| Net Working Capital | $20,328 | $56,035 | $102,913 | n.a |
| Interest Coverage | 0.00 | 0.00 | 0.00 | n.a |
| Additional Ratios | ||||
| Assets to Sales | 0.28 | 0.27 | 0.43 | n.a |
| Current Debt/Total Assets | 18% | 10% | 7% | n.a |
| Acid Test | 0.46 | 1.89 | 7.84 | n.a |
| Sales/Net Worth | 4.26 | 4.05 | 2.49 | n.a |
| Dividend Payout | 0.00 | 0.00 | 0.00 | n.a |
Appendix
| Sales Forecast | |||||||||||||
| Month 1 | Month 2 | Month 3 | Month 4 | Month 5 | Month 6 | Month 7 | Month 8 | Month 9 | Month 10 | Month 11 | Month 12 | ||
| Sales | |||||||||||||
| Exclusive agents | 0% | $0 | $1,001 | $1,204 | $2,145 | $3,454 | $3,658 | $4,258 | $4,987 | $6,254 | $6,985 | $8,125 | $8,978 |
| Insurance brokers | 0% | $0 | $1,325 | $1,545 | $2,785 | $3,852 | $4,141 | $4,787 | $6,235 | $7,458 | $8,325 | $9,214 | $10,145 |
| Total Sales | $0 | $2,326 | $2,749 | $4,930 | $7,306 | $7,799 | $9,045 | $11,222 | $13,712 | $15,310 | $17,339 | $19,123 | |
| Direct Cost of Sales | Month 1 | Month 2 | Month 3 | Month 4 | Month 5 | Month 6 | Month 7 | Month 8 | Month 9 | Month 10 | Month 11 | Month 12 | |
| Exclusive agents | $0 | $150 | $181 | $322 | $518 | $549 | $639 | $748 | $938 | $1,048 | $1,219 | $1,347 | |
| Insurance brokers | $0 | $199 | $232 | $418 | $578 | $621 | $718 | $935 | $1,119 | $1,249 | $1,382 | $1,522 | |
| Subtotal Direct Cost of Sales | $0 | $349 | $412 | $740 | $1,096 | $1,170 | $1,357 | $1,683 | $2,057 | $2,297 | $2,601 | $2,868 | |
| Personnel Plan | |||||||||||||
| Month 1 | Month 2 | Month 3 | Month 4 | Month 5 | Month 6 | Month 7 | Month 8 | Month 9 | Month 10 | Month 11 | Month 12 | ||
| Sarah | 0% | $2,500 | $2,500 | $2,500 | $2,500 | $2,500 | $2,500 | $2,500 | $2,500 | $2,500 | $2,500 | $2,500 | $2,500 |
| Support staff | 0% | $0 | $1,920 | $1,920 | $1,920 | $1,920 | $1,920 | $1,920 | $1,920 | $1,920 | $1,920 | $1,920 | $1,920 |
| Support staff | 0% | $0 | $1,920 | $1,920 | $1,920 | $1,920 | $1,920 | $1,920 | $1,920 | $1,920 | $1,920 | $1,920 | $1,920 |
| Support staff | 0% | $0 | $0 | $0 | $0 | $1,920 | $1,920 | $1,920 | $1,920 | $1,920 | $1,920 | $1,920 | $1,920 |
| Support staff | 0% | $0 | $0 | $0 | $0 | $1,920 | $1,920 | $1,920 | $1,920 | $1,920 | $1,920 | $1,920 | $1,920 |
| Total People | 1 | 3 | 3 | 3 | 5 | 5 | 5 | 5 | 5 | 5 | 5 | 5 | |
| Total Payroll | $2,500 | $6,340 | $6,340 | $6,340 | $10,180 | $10,180 | $10,180 | $10,180 | $10,180 | $10,180 | $10,180 | $10,180 | |
| General Assumptions | |||||||||||||
| Month 1 | Month 2 | Month 3 | Month 4 | Month 5 | Month 6 | Month 7 | Month 8 | Month 9 | Month 10 | Month 11 | Month 12 | ||
| Plan Month | 1 | 2 | 3 | 4 | 5 | 6 | 7 | 8 | 9 | 10 | 11 | 12 | |
| Current Interest Rate | 10.00% | 10.00% | 10.00% | 10.00% | 10.00% | 10.00% | 10.00% | 10.00% | 10.00% | 10.00% | 10.00% | 10.00% | |
| Long-term Interest Rate | 10.00% | 10.00% | 10.00% | 10.00% | 10.00% | 10.00% | 10.00% | 10.00% | 10.00% | 10.00% | 10.00% | 10.00% | |
| Tax Rate | 30.00% | 25.00% | 25.00% | 25.00% | 25.00% | 25.00% | 25.00% | 25.00% | 25.00% | 25.00% | 25.00% | 25.00% | |
| Other | 0 | 0 | 0 | 0 | 0 | 0 | 0 | 0 | 0 | 0 | 0 | 0 | |
| Pro Forma Profit and Loss | |||||||||||||
| Month 1 | Month 2 | Month 3 | Month 4 | Month 5 | Month 6 | Month 7 | Month 8 | Month 9 | Month 10 | Month 11 | Month 12 | ||
| Sales | $0 | $2,326 | $2,749 | $4,930 | $7,306 | $7,799 | $9,045 | $11,222 | $13,712 | $15,310 | $17,339 | $19,123 | |
| Direct Cost of Sales | $0 | $349 | $412 | $740 | $1,096 | $1,170 | $1,357 | $1,683 | $2,057 | $2,297 | $2,601 | $2,868 | |
| Other | $0 | $0 | $0 | $0 | $0 | $0 | $0 | $0 | $0 | $0 | $0 | $0 | |
| Total Cost of Sales | $0 | $349 | $412 | $740 | $1,096 | $1,170 | $1,357 | $1,683 | $2,057 | $2,297 | $2,601 | $2,868 | |
| Gross Margin | $0 | $1,977 | $2,337 | $4,191 | $6,210 | $6,629 | $7,688 | $9,539 | $11,655 | $13,014 | $14,738 | $16,255 | |
| Gross Margin % | 0.00% | 85.00% | 85.00% | 85.00% | 85.00% | 85.00% | 85.00% | 85.00% | 85.00% | 85.00% | 85.00% | 85.00% | |
| Expenses | |||||||||||||
| Payroll | $2,500 | $6,340 | $6,340 | $6,340 | $10,180 | $10,180 | $10,180 | $10,180 | $10,180 | $10,180 | $10,180 | $10,180 | |
| Sales and Marketing and Other Expenses | $250 | $250 | $250 | $250 | $250 | $250 | $250 | $250 | $250 | $250 | $250 | $250 | |
| Depreciation | $236 | $236 | $236 | $236 | $236 | $236 | $236 | $236 | $236 | $236 | $236 | $236 | |
| Leased Equipment | $0 | $0 | $0 | $0 | $0 | $0 | $0 | $0 | $0 | $0 | $0 | $0 | |
| Utilities | $125 | $125 | $125 | $125 | $125 | $125 | $125 | $125 | $125 | $125 | $125 | $125 | |
| Insurance | $150 | $150 | $150 | $150 | $150 | $150 | $150 | $150 | $150 | $150 | $150 | $150 | |
| Rent | $800 | $800 | $800 | $800 | $800 | $800 | $800 | $800 | $800 | $800 | $800 | $800 | |
| Payroll Taxes | 15% | $375 | $951 | $951 | $951 | $1,527 | $1,527 | $1,527 | $1,527 | $1,527 | $1,527 | $1,527 | $1,527 |
| Other | $0 | $0 | $0 | $0 | $0 | $0 | $0 | $0 | $0 | $0 | $0 | $0 | |
| Total Operating Expenses | $4,436 | $8,852 | $8,852 | $8,852 | $13,268 | $13,268 | $13,268 | $13,268 | $13,268 | $13,268 | $13,268 | $13,268 | |
| Profit Before Interest and Taxes | ($4,436) | ($6,875) | ($6,515) | ($4,662) | ($7,058) | ($6,639) | ($5,580) | ($3,729) | ($1,613) | ($255) | $1,470 | $2,987 | |
| EBITDA | ($4,200) | ($6,639) | ($6,279) | ($4,426) | ($6,822) | ($6,403) | ($5,344) | ($3,493) | ($1,377) | ($19) | $1,706 | $3,223 | |
| Interest Expense | $0 | $0 | $0 | $0 | $0 | $0 | $0 | $0 | $0 | $0 | $0 | $0 | |
| Taxes Incurred | $0 | $0 | $0 | $0 | $0 | $0 | $0 | $0 | $0 | $0 | $0 | $0 | |
| Net Profit | ($4,436) | ($6,875) | ($6,515) | ($4,662) | ($7,058) | ($6,639) | ($5,580) | ($3,729) | ($1,613) | ($255) | $1,470 | $2,987 | |
| Net Profit/Sales | 0.00% | -295.57% | -237.01% | -94.55% | -96.60% | -85.12% | -61.69% | -33.23% | -11.76% | -1.66% | 8.48% | 15.62% | |
| Pro Forma Cash Flow | |||||||||||||
| Month 1 | Month 2 | Month 3 | Month 4 | Month 5 | Month 6 | Month 7 | Month 8 | Month 9 | Month 10 | Month 11 | Month 12 | ||
| Cash Received | |||||||||||||
| Cash from Operations | |||||||||||||
| Cash Sales | $0 | $814 | $962 | $1,726 | $2,557 | $2,730 | $3,166 | $3,928 | $4,799 | $5,359 | $6,069 | $6,693 | |
| Cash from Receivables | $0 | $0 | $50 | $1,521 | $1,834 | $3,256 | $4,760 | $5,096 | $5,926 | $7,348 | $8,947 | $9,995 | |
| Subtotal Cash from Operations | $0 | $814 | $1,013 | $3,247 | $4,391 | $5,986 | $7,925 | $9,024 | $10,726 | $12,707 | $15,016 | $16,689 | |
| Additional Cash Received | |||||||||||||
| Sales Tax, VAT, HST/GST Received | 0.00% | $0 | $0 | $0 | $0 | $0 | $0 | $0 | $0 | $0 | $0 | $0 | $0 |
| New Current Borrowing | $0 | $0 | $0 | $0 | $0 | $0 | $0 | $0 | $0 | $0 | $0 | $0 | |
| New Other Liabilities (interest-free) | $0 | $0 | $0 | $0 | $0 | $0 | $0 | $0 | $0 | $0 | $0 | $0 | |
| New Long-term Liabilities | $0 | $0 | $0 | $0 | $0 | $0 | $0 | $0 | $0 | $0 | $0 | $0 | |
| Sales of Other Current Assets | $0 | $0 | $0 | $0 | $0 | $0 | $0 | $0 | $0 | $0 | $0 | $0 | |
| Sales of Long-term Assets | $0 | $0 | $0 | $0 | $0 | $0 | $0 | $0 | $0 | $0 | $0 | $0 | |
| New Investment Received | $0 | $0 | $0 | $0 | $0 | $0 | $0 | $0 | $0 | $3,000 | $0 | $0 | |
| Subtotal Cash Received | $0 | $814 | $1,013 | $3,247 | $4,391 | $5,986 | $7,925 | $9,024 | $10,726 | $15,707 | $15,016 | $16,689 | |
| Expenditures | Month 1 | Month 2 | Month 3 | Month 4 | Month 5 | Month 6 | Month 7 | Month 8 | Month 9 | Month 10 | Month 11 | Month 12 | |
| Expenditures from Operations | |||||||||||||
| Cash Spending | $2,500 | $6,340 | $6,340 | $6,340 | $10,180 | $10,180 | $10,180 | $10,180 | $10,180 | $10,180 | $10,180 | $10,180 | |
| Bill Payments | $57 | $1,731 | $2,627 | $2,699 | $3,047 | $3,950 | $4,028 | $4,220 | $4,548 | $4,917 | $5,159 | $5,462 | |
| Subtotal Spent on Operations | $2,557 | $8,071 | $8,967 | $9,039 | $13,227 | $14,130 | $14,208 | $14,400 | $14,728 | $15,097 | $15,339 | $15,642 | |
| Additional Cash Spent | |||||||||||||
| Sales Tax, VAT, HST/GST Paid Out | $0 | $0 | $0 | $0 | $0 | $0 | $0 | $0 | $0 | $0 | $0 | $0 | |
| Principal Repayment of Current Borrowing | $0 | $0 | $0 | $0 | $0 | $0 | $0 | $0 | $0 | $0 | $0 | $0 | |
| Other Liabilities Principal Repayment | $0 | $0 | $0 | $0 | $0 | $0 | $0 | $0 | $0 | $0 | $0 | $0 | |
| Long-term Liabilities Principal Repayment | $0 | $0 | $0 | $0 | $0 | $0 | $0 | $0 | $0 | $0 | $0 | $0 | |
| Purchase Other Current Assets | $0 | $0 | $0 | $0 | $0 | $0 | $0 | $0 | $0 | $0 | $0 | $0 | |
| Purchase Long-term Assets | $0 | $0 | $0 | $0 | $0 | $0 | $0 | $0 | $0 | $0 | $0 | $0 | |
| Dividends | $0 | $0 | $0 | $0 | $0 | $0 | $0 | $0 | $0 | $0 | $0 | $0 | |
| Subtotal Cash Spent | $2,557 | $8,071 | $8,967 | $9,039 | $13,227 | $14,130 | $14,208 | $14,400 | $14,728 | $15,097 | $15,339 | $15,642 | |
| Net Cash Flow | ($2,557) | ($7,257) | ($7,954) | ($5,793) | ($8,835) | ($8,145) | ($6,283) | ($5,376) | ($4,002) | $610 | ($323) | $1,047 | |
| Cash Balance | $54,843 | $47,587 | $39,632 | $33,839 | $25,004 | $16,859 | $10,577 | $5,201 | $1,199 | $1,809 | $1,486 | $2,533 | |
| Pro Forma Balance Sheet | |||||||||||||
| Month 1 | Month 2 | Month 3 | Month 4 | Month 5 | Month 6 | Month 7 | Month 8 | Month 9 | Month 10 | Month 11 | Month 12 | ||
| Assets | Starting Balances | ||||||||||||
| Current Assets | |||||||||||||
| Cash | $57,400 | $54,843 | $47,587 | $39,632 | $33,839 | $25,004 | $16,859 | $10,577 | $5,201 | $1,199 | $1,809 | $1,486 | $2,533 |
| Accounts Receivable | $0 | $0 | $1,512 | $3,248 | $4,932 | $7,847 | $9,660 | $10,780 | $12,978 | $15,964 | $18,567 | $20,890 | $23,325 |
| Other Current Assets | $0 | $0 | $0 | $0 | $0 | $0 | $0 | $0 | $0 | $0 | $0 | $0 | $0 |
| Total Current Assets | $57,400 | $54,843 | $49,099 | $42,880 | $38,771 | $32,851 | $26,519 | $21,356 | $18,179 | $17,163 | $20,376 | $22,376 | $25,858 |
| Long-term Assets | |||||||||||||
| Long-term Assets | $8,500 | $8,500 | $8,500 | $8,500 | $8,500 | $8,500 | $8,500 | $8,500 | $8,500 | $8,500 | $8,500 | $8,500 | $8,500 |
| Accumulated Depreciation | $0 | $236 | $472 | $708 | $944 | $1,180 | $1,416 | $1,652 | $1,888 | $2,124 | $2,360 | $2,596 | $2,832 |
| Total Long-term Assets | $8,500 | $8,264 | $8,028 | $7,792 | $7,556 | $7,320 | $7,084 | $6,848 | $6,612 | $6,376 | $6,140 | $5,904 | $5,668 |
| Total Assets | $65,900 | $63,107 | $57,127 | $50,672 | $46,327 | $40,171 | $33,603 | $28,204 | $24,791 | $23,539 | $26,516 | $28,280 | $31,526 |
| Liabilities and Capital | Month 1 | Month 2 | Month 3 | Month 4 | Month 5 | Month 6 | Month 7 | Month 8 | Month 9 | Month 10 | Month 11 | Month 12 | |
| Current Liabilities | |||||||||||||
| Accounts Payable | $0 | $1,643 | $2,537 | $2,599 | $2,915 | $3,816 | $3,888 | $4,068 | $4,384 | $4,745 | $4,977 | $5,271 | $5,530 |
| Current Borrowing | $0 | $0 | $0 | $0 | $0 | $0 | $0 | $0 | $0 | $0 | $0 | $0 | $0 |
| Other Current Liabilities | $0 | $0 | $0 | $0 | $0 | $0 | $0 | $0 | $0 | $0 | $0 | $0 | $0 |
| Subtotal Current Liabilities | $0 | $1,643 | $2,537 | $2,599 | $2,915 | $3,816 | $3,888 | $4,068 | $4,384 | $4,745 | $4,977 | $5,271 | $5,530 |
| Long-term Liabilities | $0 | $0 | $0 | $0 | $0 | $0 | $0 | $0 | $0 | $0 | $0 | $0 | $0 |
| Total Liabilities | $0 | $1,643 | $2,537 | $2,599 | $2,915 | $3,816 | $3,888 | $4,068 | $4,384 | $4,745 | $4,977 | $5,271 | $5,530 |
| Paid-in Capital | $67,000 | $67,000 | $67,000 | $67,000 | $67,000 | $67,000 | $67,000 | $67,000 | $67,000 | $67,000 | $70,000 | $70,000 | $70,000 |
| Retained Earnings | ($1,100) | ($1,100) | ($1,100) | ($1,100) | ($1,100) | ($1,100) | ($1,100) | ($1,100) | ($1,100) | ($1,100) | ($1,100) | ($1,100) | ($1,100) |
| Earnings | $0 | ($4,436) | ($11,311) | ($17,826) | ($22,488) | ($29,546) | ($36,185) | ($41,764) | ($45,494) | ($47,106) | ($47,361) | ($45,891) | ($42,904) |
| Total Capital | $65,900 | $61,464 | $54,589 | $48,074 | $43,412 | $36,354 | $29,716 | $24,136 | $20,406 | $18,794 | $21,539 | $23,009 | $25,996 |
| Total Liabilities and Capital | $65,900 | $63,107 | $57,127 | $50,672 | $46,327 | $40,171 | $33,603 | $28,204 | $24,791 | $23,539 | $26,516 | $28,280 | $31,526 |
| Net Worth | $65,900 | $61,464 | $54,589 | $48,074 | $43,412 | $36,354 | $29,716 | $24,136 | $20,406 | $18,794 | $21,539 | $23,009 | $25,996 |


