
Concrete Installation
Executive Summary
Introduction
Concrete Installation LLC plans to become the leading provider of concrete formwork services in the area. This means always having the best and most efficient facilities, processes, and people. To achieve this, Concrete Installation is investing in many ways that will pay off in competitive advantages for its customers.
The company’s overall strategy will be based on a continuing improvement process of setting objectives, measuring results, and providing feedback to facilitate further growth and progress.
Concrete Installation is an Oklahoma Limited Liability company, with principal offices located in Sulphur, Oklahoma. Concrete Installation’s management is highly experienced and qualified. Mr. Barry Newman leads the management team with over ten years of experience in the construction industry.
Products/Services
Concrete Installation has developed sophisticated formwork solutions for some of the most complex construction projects being done today. The company’s standard form systems are versatile and completely adaptable to a variety of configurations such as Y-walls, shafts, and circular walls.
The Concrete Installation system can be adapted to almost any construction requirement that calls for forming. The company’s expert staff has the capability to design and manufacture any custom component or accessory item that may be required to complete the formwork package.
Owners, developers, construction managers, general contractors, and concrete subcontractors have realized substantial savings in labor and material costs by using structural contours construction methods, systems and equipment. Applications include commercial and residential structures, bridges, educational projects, recreational projects, civil projects, tunnels, utility projects, environmental projects, and virtually every other type of concrete construction.
The Market
The housing industry has proceeded at a red-hot pace for several years running. An all-time record was set in 1998, when 886,000 new-site single family homes were sold. That represented a 10% gain from the robust total of 804,000 homes sold in 1997, and an 8.1% rise from the prior record of 819,000 units in 1977. Single-family housing construction accounted for $48 million of the total $125 million generated in the industry. This makes for an excellent opportunity to expand Concrete Installation operations and gain significant market share in its primary target market segment. The company also plans to focus to a lesser extent on the residential and heavy construction industry, which is also very robust at the moment.
The company plans to rapidly develop marketing alliances with industry leaders and pursue new sales of its services to residential and commercial builders. The market strategy is to capitalize on Concrete Installation’s alliances by securing city, county, and state and federal government contracts.
Concrete Installation plans to use a direct sales force, relationship selling, and subcontractors to reach its markets. These channels are most appropriate because of time to market, reduced capital requirements, and fast access to established distribution channels.
Financial Considerations
We expect to be profitable during the first year of operations. Despite initial large outlays in cash to promote sales, the company’s cash account is expected to remain healthy. The company expects to earn approximately 1.5 million dollars in revenue by Year 3.
1.1 Mission
The mission of Concrete Installation is to provide quality service at competitive pricing.

Company Summary
Concrete Installation is an Oklahoma Limited Liability company, with principal offices located in Sulphur, Oklahoma.
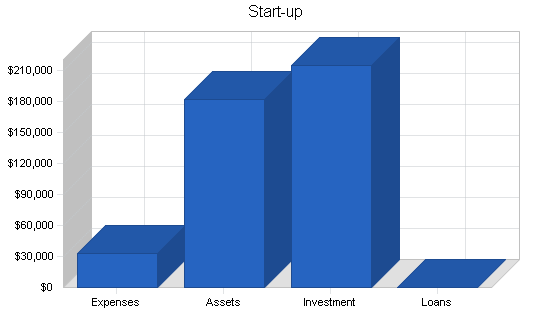
| Start-up | |
| Requirements | |
| Start-up Expenses | |
| Legal | $500 |
| Stationery etc. | $100 |
| Brochures | $500 |
| Consultants | $1,000 |
| Insurance | $15,000 |
| Rent | $500 |
| Expensed equipment | $14,000 |
| Other | $1,400 |
| Total Start-up Expenses | $33,000 |
| Start-up Assets | |
| Cash Required | $132,000 |
| Start-up Inventory | $0 |
| Other Current Assets | $30,000 |
| Long-term Assets | $20,000 |
| Total Assets | $182,000 |
| Total Requirements | $215,000 |
| Start-up Funding | |
| Start-up Expenses to Fund | $33,000 |
| Start-up Assets to Fund | $182,000 |
| Total Funding Required | $215,000 |
| Assets | |
| Non-cash Assets from Start-up | $50,000 |
| Cash Requirements from Start-up | $132,000 |
| Additional Cash Raised | $0 |
| Cash Balance on Starting Date | $132,000 |
| Total Assets | $182,000 |
| Liabilities and Capital | |
| Liabilities | |
| Current Borrowing | $0 |
| Long-term Liabilities | $0 |
| Accounts Payable (Outstanding Bills) | $0 |
| Other Current Liabilities (interest-free) | $0 |
| Total Liabilities | $0 |
| Capital | |
| Planned Investment | |
| Barry Newman | $15,000 |
| Investor | $200,000 |
| Additional Investment Requirement | $0 |
| Total Planned Investment | $215,000 |
| Loss at Start-up (Start-up Expenses) | ($33,000) |
| Total Capital | $182,000 |
| Total Capital and Liabilities | $182,000 |
| Total Funding | $215,000 |
2.1 Safety
Concrete Installation will be committed to conducting business in a manner that protects the health and safety of all employees, customers, and persons living in the community where it operates. To accomplish this, Concrete Installation will ensure that it complies with current Health Administration and Occupational Health and Safety laws and will maintain its operations, procedures, technologies, and policies accordingly. Each employee will have the responsibility to fully comply with established safety rules and to perform work in such a manner to prevent injuries to themselves and others. Concrete Installation is very concerned about job-site safety and plans to set up a comprehensive safety program.
Services
The Concrete Installation system can be adapted to almost any construction requirement that calls for forming. The company’s expert staff has the capability to design and manufacture any custom component or accessory item that may be required to complete the formwork package.
Owners, developers, construction managers, general contractors, and concrete subcontractors have realized substantial savings in labor and material costs by using structural contours construction methods, systems and equipment. Applications include commercial and residential structures, bridges, educational projects, recreational projects, civil projects, tunnels, utility projects, environmental projects, and virtually every other type of concrete construction.
Concrete Installation’s formworks will offer major advances, complete adaptability, and high strength-to-weight ratio, and all at cost effective prices. Assembly will be quick and easy. During form use, maintenance will be minimal. Concrete Installation will recommend, as a safety precaution, occasional inspection for bolts and nuts that may have loosened from handling.
The required formwork drawings that Concrete Installation will furnish to the contractor eliminate all guesswork. The company will specify the order of assembly and erection including the location of the strongbacks and joists, the location and actual loading of the form ties, location of all accessories and advise clients of the maximum allowable rate of concrete placement.
Accident prevention is the cornerstone of Concrete Installation’s safety commitment. The company will strive to eliminate foreseeable hazards which could result in personal injury or illness; at Concrete Installation, health and safety will not be compromised. Concrete Installation will sell its services clients in the area of commercial construction.
3.1 Applications
The following applications are uses for Concrete Installation’s services.
- Foundations
- Parking Lots
- Parking Garages
- Low Rise/Tilt-Up
- High Rise
- Flowable Fill/Soil Displacement
- Retaining Walls
Market Analysis Summary
Industry Statistics – Concrete Work
Special trade contractors primarily engaged in concrete work, including portland cement and asphalt.
| Estimated number of U.S. establishments | 30,214 |
| Number of people employed in this industry | 230,338 |
| Total annual sales in this industry | $21 million |
| Average employees per establishment | 8 |
| Average sales per establishment | $.7 million |
Establishments primarily engaged in manufacturing portland cement concrete manufactured and delivered to a purchaser in a plastic and unhardened steel.
| Estimated number of U.S. establishments | 5,798 |
| Number of people employed in this industry | 89,662 |
| Total annual sales in this industry | $19 million |
| Average number of employees per establishment | 17 |
| Average sales per establishment | $6.5 million |
4.1 Market Segmentation
The housing industry has proceeded at a red-hot pace for several years running. An all-time record was set in 1998, when 886,000 new-site single family homes were sold. That represented a 10% gain from the robust total of 804,000 homes sold in 1997, and an 8.1% rise from the prior record of 819,000 units in 1977. Single-family housing construction accounted for $48 million of the total $125 million generated in the industry.
Home sales strengthened even further during most of 1999’s first 10 months. In that period, new single-family home sales increased by 4.8% on a year-to-year basis, to 791,000 units, according to the U.S. Department of Commerce. Through October 1999, seasonally adjusted sales had exceeded 800,000 on an annualized basis in every month since the start of 1998.

The record setting string of home sales since the second half of 1997 has forced builders to pick up the pace of their construction activity. During 1998, total starts increased by 9.7% to 1.62 million units. Starts for single family units moved up 12 % for the year, and those of multifamily units were ahead by 1.5%. As an indication of building activity at year-end 1999, housing starts in November 1999 came in at a seasonally-adjusted annual rate of 1.6 million units.
The table below outlines the total market potential of the three targeted market segments in the served markets (in US$ thousands).
(Information provided by Standard & Poor’s)

| Market Analysis | |||||||
| Year 1 | Year 2 | Year 3 | Year 4 | Year 5 | |||
| Potential Customers | Growth | CAGR | |||||
| Single-family housing construction | 8% | 125,000 | 135,000 | 145,800 | 157,464 | 170,061 | 8.00% |
| Residential construction | 5% | 25,000 | 26,250 | 27,563 | 28,941 | 30,388 | 5.00% |
| Heavy construction | 5% | 50,000 | 52,500 | 55,125 | 57,881 | 60,775 | 5.00% |
| Total | 6.90% | 200,000 | 213,750 | 228,488 | 244,286 | 261,224 | 6.90% |
Strategy and Implementation Summary
The company plans to rapidly develop marketing alliances with industry leaders and pursue new sales of its services to residential and commercial builders. The market strategy is to capitalize on Concrete Installation’s alliances by securing city, county, and state and federal government contracts.
Concrete Installation will be committed to ensuring that the products used on its’ customers job sites, everything from access scaffolding to concrete shoring frames and forming equipment, is safe and OSHA approved. Along with clients, the company believes in a health and safety initiative that is all pervasive, managing any potential loss in the work environment.
Concrete Installation will develop sophisticated formwork solutions for some of the most complex construction projects being done today. The company’s standard form systems will be versatile and completely adaptable to a variety of configurations such as Y-walls, shafts, and circular walls.
With that in mind, Concrete Installation will adopt a corporate strategy that is dedicated to improving the performance of activities on the critical path of its customers’ projects. The company will do this by building on its core strengths: innovative equipment, design engineering expertise, and project and site management, within an environment of safety excellence.
At Concrete Installation, customer service is a pro-active partnership, a relationship that ensures a professional, efficiently run, safe workplace. The company’s customer service philosophy starts at the top, is ingrained into the fabric of the company, and is closely aligned to Concrete Installation’s goal of contributing to its’ customers critical success factors.
Customer service can be divided into two interrelated areas: equipment and people. On the job site, with the help of a newly integrated technology system and a well-trained staff, Concrete Installation will be able to maintain excellent control over such key areas as inventory, shipments/deliveries, damage loss, and invoicing. Troubleshooting, which customer service representatives often do right on the job site, will be handled quickly and efficiently. On the people side, Concrete Installation will provide a highly qualified and well-prepared labor force, ensuring that schedules and deadlines are met and worker safety remains a top consideration.
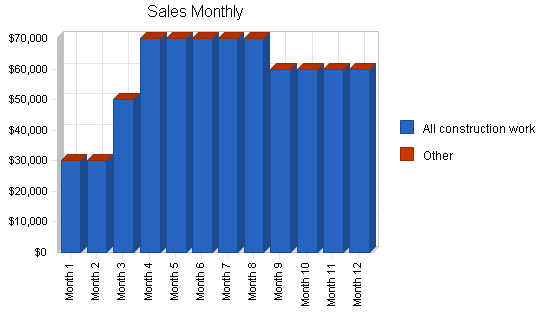
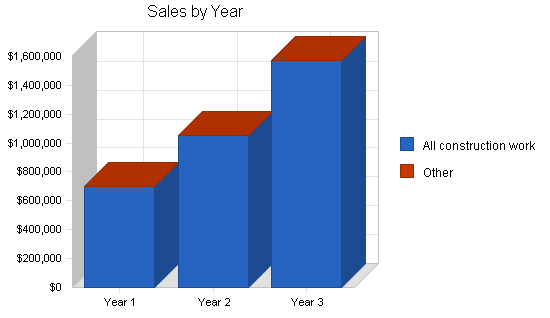
5.1 Sales Forecast
The following table and charts show our projected Sales Forecast.
| Sales Forecast | |||
| Year 1 | Year 2 | Year 3 | |
| Sales | |||
| All construction work | $700,000 | $1,050,000 | $1,575,000 |
| Other | $0 | $0 | $0 |
| Total Sales | $700,000 | $1,050,000 | $1,575,000 |
| Direct Cost of Sales | Year 1 | Year 2 | Year 3 |
| All construction work | $448,000 | $558,750 | $698,437 |
| Other | $0 | $0 | $0 |
| Subtotal Direct Cost of Sales | $448,000 | $558,750 | $698,437 |
5.2 Marketing Strategy
Concrete Installation plans to use a direct sales force, relationship selling, and subcontractors to reach its markets. These channels are most appropriate because of time to market, reduced capital requirements, and fast access to established distribution channels. The overall marketing plan for Concrete Installation’s service is based on the following fundamentals:
- The segment of the market(s) planned to reach.
- Distribution channels planned to be used to reach market segments: television, radio, sales associates, and mail order.
- Share of the market expected to capture over a fixed period of time.
In addition, Concrete Installation plans to advertise in magazines, newspapers, and radio.
The table and chart below outline the company’s sales forecast for FY2000-2002. In our sales forecasts, the cost of sales includes only direct labor costs (administrative labor costs are discussed below).
Promotional Campaign
Concrete Installation is committed to an extensive promotional campaign. This will be done aggressively and on a broad scale. To accomplish initial sales goals, the company will require an effective promotional campaign to accomplish two primary objectives:
- Attract customers who will constantly look to Concrete Installation for their construction projects.
- Attract quality sales personnel who have a desire to be successful.
In addition to standard advertisement practices, Concrete Installation will gain considerable recognition through these additional promotional mediums:
- Press releases sent to major radio stations, newspapers, and magazines.
- Radio advertising on secondary stations.
Marketing Programs
For the first six months of operation, advertising and promotion is budgeted at approximately $11,000. A fixed amount of sales revenues will go toward the state Concrete Installation advertisement campaign. On an ongoing basis, Concrete Installation feels that it can budget advertising expenses at less than 10% of revenues.
Incentives. As an extra incentive for customers to remember Concrete Installation’s name, the company plans to distribute coffee mugs, T-shirts, pens, and other advertising specialties with its logo.
Brochures. The objective of brochures is to portray Concrete Installations’ goals and products as an attractive functionality. It is also to show customers how to use the latest in technology as it relates to construction and building services. Concrete Installation will develop three brochures: one to be used to promote sales, one to use to announce the product in a new market, and the other to recruit sales associates.
Management Summary
The company’s management philosophy will be based on responsibility and mutual respect. Concrete Installation will maintain an environment and structure that will encourage productivity and respect for customers and fellow employees.
Concrete Installation will be responsible to its employees, the men and women who work with the company throughout the state. At Concrete Installation, everyone will be considered as an individual and the company will respect their dignity and recognize their merit. Employees will be encouraged to have a sense of security and pride in their jobs. Additionally, employees will be free to make suggestions and complaints. The company will afford equal opportunity for employment, development, and advancement for those qualified.
Concrete Installation employees will be committed to:
- Providing a safe work environment to protect employees, the employees of customers and subcontractors, and the public.
- Supplying safe products for customers.
- Continuously improving the company’s safety program to reduce the risk of accidents and occupational illness in a changing work environment.
- Encouraging employees to participate in accident prevention programs and take personal responsibility for their own and their co-workers’ health and safety.
- Regulatory compliance and contribution to high safety standards for our industry.
- Monitoring workplaces, enforcing safe work practices, and communicating the company’s safety performance to employees and other stakeholders.
- Making safety a value-added service that the company provides to its customers.
6.1 Personnel Plan
Concrete Installation’s management is highly experienced and qualified. Mr. Barry Newman leads the management team. Besides the direct labor costs discusses in section 5.0, other labor costs include only Mr. Newman’s assistant and a part-time accountant. The table below outlines Concrete Installation’s personnel plan for FY2000-2002.
| Personnel Plan | |||
| Year 1 | Year 2 | Year 3 | |
| Administration | $43,478 | $43,478 | $52,174 |
| Other | $0 | $0 | $0 |
| Total People | 3 | 3 | 3 |
| Total Payroll | $43,478 | $43,478 | $52,174 |
Financial Plan
The following sections describe the financials for Concrete Installation.
7.1 Projected Cash Flow
Projected cash flow statements for FY2000-2002 are provided below.

| Pro Forma Cash Flow | |||
| Year 1 | Year 2 | Year 3 | |
| Cash Received | |||
| Cash from Operations | |||
| Cash Sales | $175,000 | $262,500 | $393,750 |
| Cash from Receivables | $436,500 | $743,250 | $1,114,875 |
| Subtotal Cash from Operations | $611,500 | $1,005,750 | $1,508,625 |
| Additional Cash Received | |||
| Sales Tax, VAT, HST/GST Received | $0 | $0 | $0 |
| New Current Borrowing | $0 | $0 | $0 |
| New Other Liabilities (interest-free) | $0 | $0 | $0 |
| New Long-term Liabilities | $0 | $0 | $0 |
| Sales of Other Current Assets | $0 | $0 | $0 |
| Sales of Long-term Assets | $0 | $0 | $0 |
| New Investment Received | $0 | $0 | $0 |
| Subtotal Cash Received | $611,500 | $1,005,750 | $1,508,625 |
| Expenditures | Year 1 | Year 2 | Year 3 |
| Expenditures from Operations | |||
| Cash Spending | $43,478 | $43,478 | $52,174 |
| Bill Payments | $575,604 | $783,028 | $1,046,580 |
| Subtotal Spent on Operations | $619,082 | $826,506 | $1,098,754 |
| Additional Cash Spent | |||
| Sales Tax, VAT, HST/GST Paid Out | $0 | $0 | $0 |
| Principal Repayment of Current Borrowing | $0 | $0 | $0 |
| Other Liabilities Principal Repayment | $0 | $0 | $0 |
| Long-term Liabilities Principal Repayment | $0 | $0 | $0 |
| Purchase Other Current Assets | $0 | $0 | $0 |
| Purchase Long-term Assets | $105,000 | $100,000 | $100,000 |
| Dividends | $0 | $0 | $0 |
| Subtotal Cash Spent | $724,082 | $926,506 | $1,198,754 |
| Net Cash Flow | ($112,582) | $79,244 | $309,871 |
| Cash Balance | $19,418 | $98,662 | $408,533 |
7.2 Break-even Analysis
During the first year of operations, the break-even sales volume is estimated as shown below.

| Break-even Analysis | |
| Monthly Revenue Break-even | $24,706 |
| Assumptions: | |
| Average Percent Variable Cost | 64% |
| Estimated Monthly Fixed Cost | $8,894 |
7.3 Projected Profit and Loss
Concrete Installation is in the early stage of development, thus initial projections have only been made on accounts that are believed to most drive the income statement.


| Pro Forma Profit and Loss | |||
| Year 1 | Year 2 | Year 3 | |
| Sales | $700,000 | $1,050,000 | $1,575,000 |
| Direct Cost of Sales | $448,000 | $558,750 | $698,437 |
| Other | $50,000 | $50,000 | $50,000 |
| Total Cost of Sales | $498,000 | $608,750 | $748,437 |
| Gross Margin | $202,000 | $441,250 | $826,563 |
| Gross Margin % | 28.86% | 42.02% | 52.48% |
| Expenses | |||
| Payroll | $43,478 | $43,478 | $52,174 |
| Sales and Marketing and Other Expenses | $28,600 | $77,000 | $112,000 |
| Depreciation | $3,600 | $5,000 | $6,000 |
| Gasoline and oil | $2,030 | $4,000 | $5,000 |
| Telephone | $1,500 | $2,400 | $2,400 |
| Utilities | $6,000 | $6,000 | $6,500 |
| Insurance | $9,000 | $9,000 | $9,000 |
| Rent | $6,000 | $6,500 | $7,000 |
| Payroll Taxes | $6,522 | $6,522 | $7,826 |
| Other | $0 | $0 | $0 |
| Total Operating Expenses | $106,730 | $159,900 | $207,900 |
| Profit Before Interest and Taxes | $95,270 | $281,350 | $618,663 |
| EBITDA | $98,870 | $286,350 | $624,663 |
| Interest Expense | $0 | $0 | $0 |
| Taxes Incurred | $23,621 | $70,338 | $157,243 |
| Net Profit | $71,650 | $211,013 | $461,419 |
| Net Profit/Sales | 10.24% | 20.10% | 29.30% |
7.4 Projected Balance Sheet
The table below provides Concrete Installation’s projected balance sheets for 2000-2002.
| Pro Forma Balance Sheet | |||
| Year 1 | Year 2 | Year 3 | |
| Assets | |||
| Current Assets | |||
| Cash | $19,418 | $98,662 | $408,533 |
| Accounts Receivable | $88,500 | $132,750 | $199,125 |
| Inventory | $42,240 | $52,682 | $65,853 |
| Other Current Assets | $30,000 | $30,000 | $30,000 |
| Total Current Assets | $180,158 | $314,094 | $703,510 |
| Long-term Assets | |||
| Long-term Assets | $125,000 | $225,000 | $325,000 |
| Accumulated Depreciation | $3,600 | $8,600 | $14,600 |
| Total Long-term Assets | $121,400 | $216,400 | $310,400 |
| Total Assets | $301,558 | $530,494 | $1,013,910 |
| Liabilities and Capital | Year 1 | Year 2 | Year 3 |
| Current Liabilities | |||
| Accounts Payable | $47,908 | $65,832 | $87,828 |
| Current Borrowing | $0 | $0 | $0 |
| Other Current Liabilities | $0 | $0 | $0 |
| Subtotal Current Liabilities | $47,908 | $65,832 | $87,828 |
| Long-term Liabilities | $0 | $0 | $0 |
| Total Liabilities | $47,908 | $65,832 | $87,828 |
| Paid-in Capital | $215,000 | $215,000 | $215,000 |
| Retained Earnings | ($33,000) | $38,650 | $249,663 |
| Earnings | $71,650 | $211,013 | $461,419 |
| Total Capital | $253,650 | $464,663 | $926,082 |
| Total Liabilities and Capital | $301,558 | $530,494 | $1,013,910 |
| Net Worth | $253,650 | $464,663 | $926,082 |
7.5 Business Ratios
The following table presents important ratios from the concrete work industry, as determined by the Standard Industry Classification (SIC) Index code 1771.
| Ratio Analysis | ||||
| Year 1 | Year 2 | Year 3 | Industry Profile | |
| Sales Growth | 0.00% | 50.00% | 50.00% | 7.50% |
| Percent of Total Assets | ||||
| Accounts Receivable | 29.35% | 25.02% | 19.64% | 30.90% |
| Inventory | 14.01% | 9.93% | 6.49% | 6.30% |
| Other Current Assets | 9.95% | 5.66% | 2.96% | 29.80% |
| Total Current Assets | 59.74% | 59.21% | 69.39% | 67.00% |
| Long-term Assets | 40.26% | 40.79% | 30.61% | 33.00% |
| Total Assets | 100.00% | 100.00% | 100.00% | 100.00% |
| Current Liabilities | 15.89% | 12.41% | 8.66% | 43.50% |
| Long-term Liabilities | 0.00% | 0.00% | 0.00% | 14.10% |
| Total Liabilities | 15.89% | 12.41% | 8.66% | 57.60% |
| Net Worth | 84.11% | 87.59% | 91.34% | 42.40% |
| Percent of Sales | ||||
| Sales | 100.00% | 100.00% | 100.00% | 100.00% |
| Gross Margin | 28.86% | 42.02% | 52.48% | 29.40% |
| Selling, General & Administrative Expenses | 18.65% | 21.93% | 23.02% | 15.50% |
| Advertising Expenses | 3.29% | 6.67% | 6.35% | 0.30% |
| Profit Before Interest and Taxes | 13.61% | 26.80% | 39.28% | 2.40% |
| Main Ratios | ||||
| Current | 3.76 | 4.77 | 8.01 | 1.55 |
| Quick | 2.88 | 3.97 | 7.26 | 1.17 |
| Total Debt to Total Assets | 15.89% | 12.41% | 8.66% | 57.60% |
| Pre-tax Return on Net Worth | 37.56% | 60.55% | 66.80% | 6.50% |
| Pre-tax Return on Assets | 31.59% | 53.04% | 61.02% | 15.40% |
| Additional Ratios | Year 1 | Year 2 | Year 3 | |
| Net Profit Margin | 10.24% | 20.10% | 29.30% | n.a |
| Return on Equity | 28.25% | 45.41% | 49.82% | n.a |
| Activity Ratios | ||||
| Accounts Receivable Turnover | 5.93 | 5.93 | 5.93 | n.a |
| Collection Days | 57 | 51 | 51 | n.a |
| Inventory Turnover | 10.91 | 11.77 | 11.78 | n.a |
| Accounts Payable Turnover | 13.01 | 12.17 | 12.17 | n.a |
| Payment Days | 27 | 26 | 26 | n.a |
| Total Asset Turnover | 2.32 | 1.98 | 1.55 | n.a |
| Debt Ratios | ||||
| Debt to Net Worth | 0.19 | 0.14 | 0.09 | n.a |
| Current Liab. to Liab. | 1.00 | 1.00 | 1.00 | n.a |
| Liquidity Ratios | ||||
| Net Working Capital | $132,250 | $248,263 | $615,682 | n.a |
| Interest Coverage | 0.00 | 0.00 | 0.00 | n.a |
| Additional Ratios | ||||
| Assets to Sales | 0.43 | 0.51 | 0.64 | n.a |
| Current Debt/Total Assets | 16% | 12% | 9% | n.a |
| Acid Test | 1.03 | 1.95 | 4.99 | n.a |
| Sales/Net Worth | 2.76 | 2.26 | 1.70 | n.a |
| Dividend Payout | 0.00 | 0.00 | 0.00 | n.a |
Appendix
| Sales Forecast | |||||||||||||
| Month 1 | Month 2 | Month 3 | Month 4 | Month 5 | Month 6 | Month 7 | Month 8 | Month 9 | Month 10 | Month 11 | Month 12 | ||
| Sales | |||||||||||||
| All construction work | 0% | $30,000 | $30,000 | $50,000 | $70,000 | $70,000 | $70,000 | $70,000 | $70,000 | $60,000 | $60,000 | $60,000 | $60,000 |
| Other | 0% | $0 | $0 | $0 | $0 | $0 | $0 | $0 | $0 | $0 | $0 | $0 | $0 |
| Total Sales | $30,000 | $30,000 | $50,000 | $70,000 | $70,000 | $70,000 | $70,000 | $70,000 | $60,000 | $60,000 | $60,000 | $60,000 | |
| Direct Cost of Sales | Month 1 | Month 2 | Month 3 | Month 4 | Month 5 | Month 6 | Month 7 | Month 8 | Month 9 | Month 10 | Month 11 | Month 12 | |
| All construction work | $19,200 | $19,200 | $32,000 | $44,800 | $44,800 | $44,800 | $44,800 | $44,800 | $38,400 | $38,400 | $38,400 | $38,400 | |
| Other | $0 | $0 | $0 | $0 | $0 | $0 | $0 | $0 | $0 | $0 | $0 | $0 | |
| Subtotal Direct Cost of Sales | $19,200 | $19,200 | $32,000 | $44,800 | $44,800 | $44,800 | $44,800 | $44,800 | $38,400 | $38,400 | $38,400 | $38,400 | |
| Personnel Plan | |||||||||||||
| Month 1 | Month 2 | Month 3 | Month 4 | Month 5 | Month 6 | Month 7 | Month 8 | Month 9 | Month 10 | Month 11 | Month 12 | ||
| Administration | 0% | $3,623 | $3,623 | $3,623 | $3,623 | $3,623 | $3,623 | $3,623 | $3,623 | $3,623 | $3,623 | $3,623 | $3,625 |
| Other | 0% | $0 | $0 | $0 | $0 | $0 | $0 | $0 | $0 | $0 | $0 | $0 | $0 |
| Total People | 3 | 3 | 3 | 3 | 3 | 3 | 3 | 3 | 3 | 3 | 3 | 3 | |
| Total Payroll | $3,623 | $3,623 | $3,623 | $3,623 | $3,623 | $3,623 | $3,623 | $3,623 | $3,623 | $3,623 | $3,623 | $3,625 | |
| General Assumptions | |||||||||||||
| Month 1 | Month 2 | Month 3 | Month 4 | Month 5 | Month 6 | Month 7 | Month 8 | Month 9 | Month 10 | Month 11 | Month 12 | ||
| Plan Month | 1 | 2 | 3 | 4 | 5 | 6 | 7 | 8 | 9 | 10 | 11 | 12 | |
| Current Interest Rate | 10.00% | 10.00% | 10.00% | 10.00% | 10.00% | 10.00% | 10.00% | 10.00% | 10.00% | 10.00% | 10.00% | 10.00% | |
| Long-term Interest Rate | 10.00% | 10.00% | 10.00% | 10.00% | 10.00% | 10.00% | 10.00% | 10.00% | 10.00% | 10.00% | 10.00% | 10.00% | |
| Tax Rate | 30.00% | 25.00% | 25.00% | 25.00% | 25.00% | 25.00% | 25.00% | 25.00% | 25.00% | 25.00% | 25.00% | 25.00% | |
| Other | 0 | 0 | 0 | 0 | 0 | 0 | 0 | 0 | 0 | 0 | 0 | 0 | |
| Pro Forma Profit and Loss | |||||||||||||
| Month 1 | Month 2 | Month 3 | Month 4 | Month 5 | Month 6 | Month 7 | Month 8 | Month 9 | Month 10 | Month 11 | Month 12 | ||
| Sales | $30,000 | $30,000 | $50,000 | $70,000 | $70,000 | $70,000 | $70,000 | $70,000 | $60,000 | $60,000 | $60,000 | $60,000 | |
| Direct Cost of Sales | $19,200 | $19,200 | $32,000 | $44,800 | $44,800 | $44,800 | $44,800 | $44,800 | $38,400 | $38,400 | $38,400 | $38,400 | |
| Other | $6,000 | $4,000 | $4,000 | $4,000 | $4,000 | $4,000 | $4,000 | $4,000 | $4,000 | $4,000 | $4,000 | $4,000 | |
| Total Cost of Sales | $25,200 | $23,200 | $36,000 | $48,800 | $48,800 | $48,800 | $48,800 | $48,800 | $42,400 | $42,400 | $42,400 | $42,400 | |
| Gross Margin | $4,800 | $6,800 | $14,000 | $21,200 | $21,200 | $21,200 | $21,200 | $21,200 | $17,600 | $17,600 | $17,600 | $17,600 | |
| Gross Margin % | 16.00% | 22.67% | 28.00% | 30.29% | 30.29% | 30.29% | 30.29% | 30.29% | 29.33% | 29.33% | 29.33% | 29.33% | |
| Expenses | |||||||||||||
| Payroll | $3,623 | $3,623 | $3,623 | $3,623 | $3,623 | $3,623 | $3,623 | $3,623 | $3,623 | $3,623 | $3,623 | $3,625 | |
| Sales and Marketing and Other Expenses | $2,300 | $2,300 | $2,400 | $2,400 | $2,400 | $2,400 | $2,400 | $2,400 | $2,400 | $2,400 | $2,400 | $2,400 | |
| Depreciation | $300 | $300 | $300 | $300 | $300 | $300 | $300 | $300 | $300 | $300 | $300 | $300 | |
| Gasoline and oil | $100 | $100 | $150 | $200 | $200 | $200 | $200 | $200 | $170 | $170 | $170 | $170 | |
| Telephone | $125 | $125 | $125 | $125 | $125 | $125 | $125 | $125 | $125 | $125 | $125 | $125 | |
| Utilities | $500 | $500 | $500 | $500 | $500 | $500 | $500 | $500 | $500 | $500 | $500 | $500 | |
| Insurance | $750 | $750 | $750 | $750 | $750 | $750 | $750 | $750 | $750 | $750 | $750 | $750 | |
| Rent | $500 | $500 | $500 | $500 | $500 | $500 | $500 | $500 | $500 | $500 | $500 | $500 | |
| Payroll Taxes | 15% | $543 | $543 | $543 | $543 | $543 | $543 | $543 | $543 | $543 | $543 | $543 | $544 |
| Other | $0 | $0 | $0 | $0 | $0 | $0 | $0 | $0 | $0 | $0 | $0 | $0 | |
| Total Operating Expenses | $8,741 | $8,741 | $8,891 | $8,941 | $8,941 | $8,941 | $8,941 | $8,941 | $8,911 | $8,911 | $8,911 | $8,914 | |
| Profit Before Interest and Taxes | ($3,941) | ($1,941) | $5,109 | $12,259 | $12,259 | $12,259 | $12,259 | $12,259 | $8,689 | $8,689 | $8,689 | $8,686 | |
| EBITDA | ($3,641) | ($1,641) | $5,409 | $12,559 | $12,559 | $12,559 | $12,559 | $12,559 | $8,989 | $8,989 | $8,989 | $8,986 | |
| Interest Expense | $0 | $0 | $0 | $0 | $0 | $0 | $0 | $0 | $0 | $0 | $0 | $0 | |
| Taxes Incurred | ($1,182) | ($485) | $1,277 | $3,065 | $3,065 | $3,065 | $3,065 | $3,065 | $2,172 | $2,172 | $2,172 | $2,172 | |
| Net Profit | ($2,759) | ($1,456) | $3,831 | $9,194 | $9,194 | $9,194 | $9,194 | $9,194 | $6,516 | $6,516 | $6,516 | $6,515 | |
| Net Profit/Sales | -9.20% | -4.85% | 7.66% | 13.13% | 13.13% | 13.13% | 13.13% | 13.13% | 10.86% | 10.86% | 10.86% | 10.86% | |
| Pro Forma Cash Flow | |||||||||||||
| Month 1 | Month 2 | Month 3 | Month 4 | Month 5 | Month 6 | Month 7 | Month 8 | Month 9 | Month 10 | Month 11 | Month 12 | ||
| Cash Received | |||||||||||||
| Cash from Operations | |||||||||||||
| Cash Sales | $7,500 | $7,500 | $12,500 | $17,500 | $17,500 | $17,500 | $17,500 | $17,500 | $15,000 | $15,000 | $15,000 | $15,000 | |
| Cash from Receivables | $0 | $750 | $22,500 | $23,000 | $38,000 | $52,500 | $52,500 | $52,500 | $52,500 | $52,250 | $45,000 | $45,000 | |
| Subtotal Cash from Operations | $7,500 | $8,250 | $35,000 | $40,500 | $55,500 | $70,000 | $70,000 | $70,000 | $67,500 | $67,250 | $60,000 | $60,000 | |
| Additional Cash Received | |||||||||||||
| Sales Tax, VAT, HST/GST Received | 0.00% | $0 | $0 | $0 | $0 | $0 | $0 | $0 | $0 | $0 | $0 | $0 | $0 |
| New Current Borrowing | $0 | $0 | $0 | $0 | $0 | $0 | $0 | $0 | $0 | $0 | $0 | $0 | |
| New Other Liabilities (interest-free) | $0 | $0 | $0 | $0 | $0 | $0 | $0 | $0 | $0 | $0 | $0 | $0 | |
| New Long-term Liabilities | $0 | $0 | $0 | $0 | $0 | $0 | $0 | $0 | $0 | $0 | $0 | $0 | |
| Sales of Other Current Assets | $0 | $0 | $0 | $0 | $0 | $0 | $0 | $0 | $0 | $0 | $0 | $0 | |
| Sales of Long-term Assets | $0 | $0 | $0 | $0 | $0 | $0 | $0 | $0 | $0 | $0 | $0 | $0 | |
| New Investment Received | $0 | $0 | $0 | $0 | $0 | $0 | $0 | $0 | $0 | $0 | $0 | $0 | |
| Subtotal Cash Received | $7,500 | $8,250 | $35,000 | $40,500 | $55,500 | $70,000 | $70,000 | $70,000 | $67,500 | $67,250 | $60,000 | $60,000 | |
| Expenditures | Month 1 | Month 2 | Month 3 | Month 4 | Month 5 | Month 6 | Month 7 | Month 8 | Month 9 | Month 10 | Month 11 | Month 12 | |
| Expenditures from Operations | |||||||||||||
| Cash Spending | $3,623 | $3,623 | $3,623 | $3,623 | $3,623 | $3,623 | $3,623 | $3,623 | $3,623 | $3,623 | $3,623 | $3,625 | |
| Bill Payments | $1,665 | $49,209 | $28,493 | $56,814 | $70,494 | $56,883 | $56,883 | $56,883 | $56,404 | $42,755 | $49,561 | $49,561 | |
| Subtotal Spent on Operations | $5,288 | $52,832 | $32,116 | $60,437 | $74,117 | $60,506 | $60,506 | $60,506 | $60,027 | $46,378 | $53,184 | $53,186 | |
| Additional Cash Spent | |||||||||||||
| Sales Tax, VAT, HST/GST Paid Out | $0 | $0 | $0 | $0 | $0 | $0 | $0 | $0 | $0 | $0 | $0 | $0 | |
| Principal Repayment of Current Borrowing | $0 | $0 | $0 | $0 | $0 | $0 | $0 | $0 | $0 | $0 | $0 | $0 | |
| Other Liabilities Principal Repayment | $0 | $0 | $0 | $0 | $0 | $0 | $0 | $0 | $0 | $0 | $0 | $0 | |
| Long-term Liabilities Principal Repayment | $0 | $0 | $0 | $0 | $0 | $0 | $0 | $0 | $0 | $0 | $0 | $0 | |
| Purchase Other Current Assets | $0 | $0 | $0 | $0 | $0 | $0 | $0 | $0 | $0 | $0 | $0 | $0 | |
| Purchase Long-term Assets | $5,000 | $5,000 | $5,000 | $10,000 | $10,000 | $10,000 | $10,000 | $10,000 | $10,000 | $10,000 | $10,000 | $10,000 | |
| Dividends | $0 | $0 | $0 | $0 | $0 | $0 | $0 | $0 | $0 | $0 | $0 | $0 | |
| Subtotal Cash Spent | $10,288 | $57,832 | $37,116 | $70,437 | $84,117 | $70,506 | $70,506 | $70,506 | $70,027 | $56,378 | $63,184 | $63,186 | |
| Net Cash Flow | ($2,788) | ($49,582) | ($2,116) | ($29,937) | ($28,617) | ($506) | ($506) | ($506) | ($2,527) | $10,872 | ($3,184) | ($3,186) | |
| Cash Balance | $129,212 | $79,630 | $77,514 | $47,578 | $18,961 | $18,455 | $17,949 | $17,443 | $14,916 | $25,787 | $22,604 | $19,418 | |
| Pro Forma Balance Sheet | |||||||||||||
| Month 1 | Month 2 | Month 3 | Month 4 | Month 5 | Month 6 | Month 7 | Month 8 | Month 9 | Month 10 | Month 11 | Month 12 | ||
| Assets | Starting Balances | ||||||||||||
| Current Assets | |||||||||||||
| Cash | $132,000 | $129,212 | $79,630 | $77,514 | $47,578 | $18,961 | $18,455 | $17,949 | $17,443 | $14,916 | $25,787 | $22,604 | $19,418 |
| Accounts Receivable | $0 | $22,500 | $44,250 | $59,250 | $88,750 | $103,250 | $103,250 | $103,250 | $103,250 | $95,750 | $88,500 | $88,500 | $88,500 |
| Inventory | $0 | $21,120 | $21,120 | $35,200 | $49,280 | $49,280 | $49,280 | $49,280 | $49,280 | $42,240 | $42,240 | $42,240 | $42,240 |
| Other Current Assets | $30,000 | $30,000 | $30,000 | $30,000 | $30,000 | $30,000 | $30,000 | $30,000 | $30,000 | $30,000 | $30,000 | $30,000 | $30,000 |
| Total Current Assets | $162,000 | $202,832 | $175,000 | $201,964 | $215,608 | $201,491 | $200,985 | $200,479 | $199,973 | $182,906 | $186,527 | $183,344 | $180,158 |
| Long-term Assets | |||||||||||||
| Long-term Assets | $20,000 | $25,000 | $30,000 | $35,000 | $45,000 | $55,000 | $65,000 | $75,000 | $85,000 | $95,000 | $105,000 | $115,000 | $125,000 |
| Accumulated Depreciation | $0 | $300 | $600 | $900 | $1,200 | $1,500 | $1,800 | $2,100 | $2,400 | $2,700 | $3,000 | $3,300 | $3,600 |
| Total Long-term Assets | $20,000 | $24,700 | $29,400 | $34,100 | $43,800 | $53,500 | $63,200 | $72,900 | $82,600 | $92,300 | $102,000 | $111,700 | $121,400 |
| Total Assets | $182,000 | $227,532 | $204,400 | $236,064 | $259,408 | $254,991 | $264,185 | $273,379 | $282,573 | $275,206 | $288,527 | $295,044 | $301,558 |
| Liabilities and Capital | Month 1 | Month 2 | Month 3 | Month 4 | Month 5 | Month 6 | Month 7 | Month 8 | Month 9 | Month 10 | Month 11 | Month 12 | |
| Current Liabilities | |||||||||||||
| Accounts Payable | $0 | $48,291 | $26,615 | $54,448 | $68,598 | $54,987 | $54,987 | $54,987 | $54,987 | $41,103 | $47,909 | $47,909 | $47,908 |
| Current Borrowing | $0 | $0 | $0 | $0 | $0 | $0 | $0 | $0 | $0 | $0 | $0 | $0 | $0 |
| Other Current Liabilities | $0 | $0 | $0 | $0 | $0 | $0 | $0 | $0 | $0 | $0 | $0 | $0 | $0 |
| Subtotal Current Liabilities | $0 | $48,291 | $26,615 | $54,448 | $68,598 | $54,987 | $54,987 | $54,987 | $54,987 | $41,103 | $47,909 | $47,909 | $47,908 |
| Long-term Liabilities | $0 | $0 | $0 | $0 | $0 | $0 | $0 | $0 | $0 | $0 | $0 | $0 | $0 |
| Total Liabilities | $0 | $48,291 | $26,615 | $54,448 | $68,598 | $54,987 | $54,987 | $54,987 | $54,987 | $41,103 | $47,909 | $47,909 | $47,908 |
| Paid-in Capital | $215,000 | $215,000 | $215,000 | $215,000 | $215,000 | $215,000 | $215,000 | $215,000 | $215,000 | $215,000 | $215,000 | $215,000 | $215,000 |
| Retained Earnings | ($33,000) | ($33,000) | ($33,000) | ($33,000) | ($33,000) | ($33,000) | ($33,000) | ($33,000) | ($33,000) | ($33,000) | ($33,000) | ($33,000) | ($33,000) |
| Earnings | $0 | ($2,759) | ($4,215) | ($384) | $8,810 | $18,004 | $27,198 | $36,392 | $45,586 | $52,102 | $58,619 | $65,135 | $71,650 |
| Total Capital | $182,000 | $179,241 | $177,785 | $181,616 | $190,810 | $200,004 | $209,198 | $218,392 | $227,586 | $234,102 | $240,619 | $247,135 | $253,650 |
| Total Liabilities and Capital | $182,000 | $227,532 | $204,400 | $236,064 | $259,408 | $254,991 | $264,185 | $273,379 | $282,573 | $275,206 | $288,527 | $295,044 | $301,558 |
| Net Worth | $182,000 | $179,241 | $177,785 | $181,616 | $190,810 | $200,004 | $209,198 | $218,392 | $227,586 | $234,102 | $240,619 | $247,135 | $253,650 |


