
Bride’s Entourage
Executive Summary
Bride’s Entourage is a wedding attire shop like no other. While most retail bridal shops focus on selling wedding gowns, our focus is everything else. We will cater to the mothers of the bride and groom, bridesmaids, and flower girls. In addition, we will provide an array of accessories for all the female members of the bridal party.
Bride’s Entourage is registered as a single-member LLC, incorporated in Oregon state, and the sole owner is Dorina Thaker. The purpose of this business plan is to secure start-up financing. We project that the company will reach the break-even point in its fourth month of operations.
The projections outlined within this business plan indicate sufficient funds for repayment of the requested loan.
1.1 Objectives
Bride’s Entourage has the following objectives:
- To be the primary one-stop-shop for the female members of a bridal party once the bride has purchased her gown (i.e. mother of the bride, mother of the groom, bridesmaids, flower girls, footwear, and accessories).
- To have vigorous sales in the first twelve months of operations.
- In Year 3, to have sales more than double first year level and net income of at least 10% of sales.
1.2 Mission
Bride’s Entourage is a boutique that provides attire and accessories for female bridal attendants. We believe in providing superior customer service and creating a shopping experience that is relaxed and pleasurable. We also believe in providing a working environment for our employees that is professional and fun, and that empowers our employees to be trustworthy and valuable resources to our customers.
1.3 Keys to Success
To be successful in this business, Bride’s Entourage must:
- Generate and preserve a reputation of being the one-stop-shop for bridal purchases beyond the wedding gown.
- Establish a strong referral network among others in the bridal industry.
- Provide stellar customer service.
- Maintain a fresh mix of inventory.
Company Summary
Bride’s Entourage is a new retail boutique that will be a unique supplement to the existing bridal shops in the greater Portland area. While most bridal shops focus on providing the bride with her wedding gown, the focus of Bride’s Entourage is everything besides the wedding gown. Our core products include mother-of-the-bride and mother-of-the-groom attire, bridesmaids’ attire, flower girl attire, bridal footwear, and bridal accessories, such as veils, headpieces, and jewelry. Our goal is to be the one-stop-shop for items beyond the wedding gown, and to provide a fulfilling shopping experience for our customers.
2.1 Company Ownership
Bride’s Entourage is a privately held company. It is registered in the state of Oregon as a single-member LLC with Dorina Thaker as the owner.
2.2 Start-up Summary
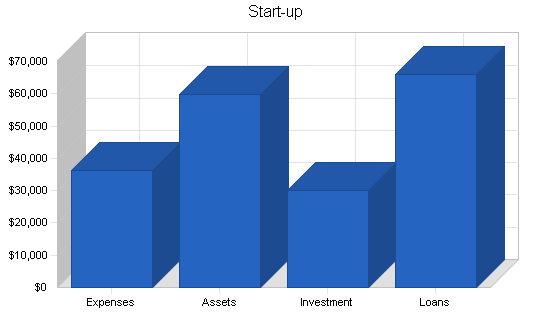
Total start-up cost estimates are shown in the following table and charts. The most significant components of the start up costs are inventory (30%), cash-on-hand (23%), and expensed equipment and leasehold improvements (19%).
The start-up costs will be financed through a combination of owner investment and long-term loans.
| Start-up Requirements | |
| Start-up Expenses | |
| Legal | $1,000 |
| Stationery | $800 |
| Other Supplies | $1,150 |
| Consultants | $1,500 |
| Insurance | $1,000 |
| Rent | $8,800 |
| Leasehold Improvements (Expensed) | $10,000 |
| Expensed Equipment | $8,000 |
| Other | $4,000 |
| Total Start-up Expenses | $36,250 |
| Start-up Assets | |
| Cash Required | $21,900 |
| Start-up Inventory | $28,350 |
| Other Current Assets | $1,000 |
| Long-term Assets | $8,500 |
| Total Assets | $59,750 |
| Total Requirements | $96,000 |
| Start-up Funding | |
| Start-up Expenses to Fund | $36,250 |
| Start-up Assets to Fund | $59,750 |
| Total Funding Required | $96,000 |
| Assets | |
| Non-cash Assets from Start-up | $37,850 |
| Cash Requirements from Start-up | $21,900 |
| Additional Cash Raised | $0 |
| Cash Balance on Starting Date | $21,900 |
| Total Assets | $59,750 |
| Liabilities and Capital | |
| Liabilities | |
| Current Borrowing | $0 |
| Long-term Liabilities | $65,000 |
| Accounts Payable (Outstanding Bills) | $1,000 |
| Other Current Liabilities (interest-free) | $0 |
| Total Liabilities | $66,000 |
| Capital | |
| Planned Investment | |
| Dorina Thaker | $30,000 |
| Other | $0 |
| Additional Investment Requirement | $0 |
| Total Planned Investment | $30,000 |
| Loss at Start-up (Start-up Expenses) | ($36,250) |
| Total Capital | ($6,250) |
| Total Capital and Liabilities | $59,750 |
| Total Funding | $96,000 |
Products
Bride’s Entourage will carry mother-of-the-bride, mother-of-the-groom, bridesmaid, and flower girl attire. In addition, we will carry bridal footwear and bridal accessories such as veils, headpieces, and jewelry. We will aim to provide products in a wide variety of styles and price-ranges that are of good quality and from reputable designers.
The dresses will be sold primarily on a made-to-order basis. We will keep a sample dress of each style in the store for customers to try on, and once they decide on a style, we will then order it in their size and in the color of their choosing. If, however, a customer is pleased with the floor sample, they will have the option to purchase that item.
When a dress is being made-to-order, a fifty percent, non-refundable deposit will be required. Once the dress arrives, the deposit will be applied toward the balance. Full payment will be due before the customer can take the dress from the store. Veils and headpieces will be sold in the same manner as the dresses. Shoes and jewelry will primarily be sold off the floor.
Bridal inventory is typically purchased in two seasons: fall and spring. The fall buying season is typically for items that will be displayed in the winter and spring, which will then be worn in the spring and summer. The spring buying season is typically for items that will be displayed in the summer and fall, which will then be worn in the fall and winter.
Most designers set “minimums,” which means that they require the purchase of a certain number of sample dresses in any given season. Some designers require that all samples be purchased at once, while other designers allow the purchase of samples to be staggered throughout the season. The buying pattern for Bride’s Entourage will be a function of designer requirements as well as customer demand for new products.
Bride’s Entourage will track the “success rate” (the number of times a particular dress is purchased), and if a dress is selling poorly, it will be discounted, sold off the rack, and replaced with a new inventory item.
Market Analysis Summary
For the past five years, Multnomah County has consistently seen around twelve thousand weddings annually. According to Multnomah County population projections, the number of females here will increase by about three percent over the next five years. It is safe to conclude from these facts that there is a solid customer-base that will increase slightly in the years to come.
What is unique about Bride’s Entourage is that it places a spotlight on the wedding purchases that are typically overshadowed by the purchase of the wedding gown. Wedding gowns, on average, comprise about 6.1% of the total wedding expenditures, while the mothers’ attire, attendants’ attire, and accessories collectively make up another 7.8% of the total wedding expenditures. Bride’s Entourage is focusing on the 7.8% that is usually an afterthought for most bridal shops.
Bride’s Entourage is a store like no other. It creates a shopping environment in which mothers, bridesmaids, and flower girls, as well as the bride, are catered to.
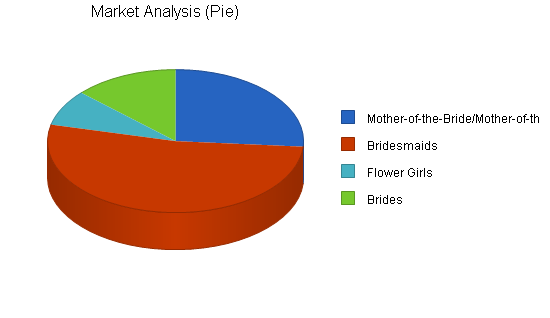
4.1 Market Segmentation
There are three major market segments that will be served by Bride’s Entourage: mother-of-the-bride/mother-of-the-groom; attendants, which includes bridesmaids and flower girls; and brides. It is important to keep in mind that most customers who are shopping for bridal attire are in it for the experience just as much as the are in it to walk away with a purchase. That means that catering to their desire for “fun” and “pampering” will be just as critical as providing them with desirable merchandise.

For almost every bride in Multnomah County, there will be at least two mothers who will need to be outfitted for the big day. For many mothers, especially the mother-of-the-bride, the wedding of her child is second only in significance to her own wedding. As a result, the style of the gown tends to take precedence over price. These customers will want a unique shopping experience that will acknowledge their significance in the upcoming wedding.
The most common number of bridesmaids, including the maid-of-honor, is four. Because bridesmaids are typically expected to pay for their own attire, they tend to be fairly cost-conscious. If they believe that they will be able to use the dress more than once, then price becomes less of an issue. The bride usually has the final say in which dress will be chosen, which creates an interesting dynamic. On the one hand, the bride’s tastes need to be accommodated, and on the other hand, the bridesmaids need to feel comfortable with the amount they are spending. Bridesmaid parties often shop as a group so that they can decide on a dress together. For groups of three or more, appointments will be recommended to ensure that proper attention and dressing room space is provided.
About 62% of all weddings have a flower girl. As with the bridesmaids’ attire, the bride usually makes the decision about the style of the dress, but the parent of the flower girl usually pays for it.
In addition to helping outfit the bridal party, Bride’s Entourage will aim to accommodate brides who are still in need of the other critical pieces to go with her gown, such as shoes, a veil and/or headpiece, and jewelry. While some brides purchase the “other items” at the time that they purchase their gown, most brides choose to shop around for the accessories.
| Market Analysis | |||||||
| Year 1 | Year 2 | Year 3 | Year 4 | Year 5 | |||
| Potential Customers | Growth | CAGR | |||||
| Mother-of-the-Bride/Mother-of-the-Groom | 3% | 24,000 | 24,720 | 25,462 | 26,226 | 27,013 | 3.00% |
| Bridesmaids | 3% | 48,000 | 49,440 | 50,923 | 52,451 | 54,025 | 3.00% |
| Flower Girls | 3% | 7,440 | 7,663 | 7,893 | 8,130 | 8,374 | 3.00% |
| Brides | 3% | 12,000 | 12,360 | 12,731 | 13,113 | 13,506 | 3.00% |
| Total | 3.00% | 91,440 | 94,183 | 97,009 | 99,920 | 102,918 | 3.00% |
4.2 Target Market Segment Strategy
The focus of Bride’s Entourage is “everything but the wedding gown.” There are nearly 40 bridal shops in the greater Portland area that focus primarily on selling wedding gowns. However, for every bride, there are, on average, at least five other females who need to be outfitted, and the bride herself will also require additional accessories.
Because most bridal shops focus on selling wedding gowns, there is minimal effort dedicated to the other necessary items. Bride’s Entourage gives the “other items” their own significance. Without the bridal gown as a distraction, the “other items” will no longer be an afterthought. Mothers and bridal attendants can have their own unique shopping experience, and brides can have a fresh environment in which to shop for their accessories.
4.3 Industry Analysis
There are over two million weddings annually in the United States, twelve thousand of which are in Multnomah County, alone. The average cost of a first wedding is currently about $20,000, and that number has consistently been increasing by about 5% each year. About 6.1% of the total wedding budget will be spent on the wedding gown, and 7.8% of the total budget will be spent on mothers’ attire, attendants’ attire, and accessories.
There are thousands of bridal shops nation-wide. Most of them are locally-owned, single-unit operations, however, there are increasing numbers of chains entering the marketplace. The primary focus of all bridal shops is the wedding gown. Some shops will also carry a limited selection of mothers’ dresses, attendants’ attire, and accessories, but their main goal is to sell wedding dresses. As a result, the market currently lacks a place to find a good selection of the other necessary items.
4.3.1 Competition and Buying Patterns
There are currently about 40 bridal shops in Multnomah County; however, the primary focus of all of those shops is wedding dresses, so they have a very limited selection of mothers’ attire, attendants’ attire, bridal footwear, and other bridal accessories. Bride’s Entourage is unique in Multnomah County in focusing on everything except the wedding gown.
Establishing a reputation for having a good selection and providing superior customer service will be key. Statistics show that brides will visit, on average, a total of six stores before purchasing their wedding gown. The “shop around before you buy” mentality may apply to the other members of the bridal party, as well, so it will be critical to provide a unique selection of items in a memorable environment. It will also be important to have a wide selection of items, so that the customers feel fulfilled with what they’ve seen at our store and won’t feel the need to shop around.
As previously mentioned, bridesmaids tend to be more cost-conscious, so competitive pricing will be key for that segment. We will offer a wide variety of styles at different price points – again, working to assure the members of the bridal party that they are being presented with a comprehensive selection, thus reducing the need to shop around.
Strategy and Implementation Summary
Bride’s Entourage has the distinct advantage of being the only store of its kind in its market. Our marketing and sales strategies will emphasize our unique advantages for the Multnomah County wedding party:
- our wide-range of clothing styles, designers, and accessories
- the attention we pay to all the female members of the wedding party
- our wonderful location in a destination shopping area
Our marketing strategy begins with standard print and online listings in wedding media, and continues through networks of wedding consultants. Our location, next to complementary shops and an upscale mall, will generate additional foot traffic.
Our sales strategy is designed to “close the deal” – from the moment a potential customer walks in the door, she will know that her place in the wedding, and her needs, are important to us. We will create an atmosphere that makes shopping for the “other items” as significant as the experience of shopping for the wedding gown. In other stores, mothers, bridesmaids, and other wedding party members are often an afterthought. At Moms, Maids, and More, they will be given as much prominence and attention as the bride receives when gown shopping.
5.1 Competitive Edge
The predominant competitive edge of Bride’s Entourage is that it is the only store of its kind in Oregon state. Most bridal shops focus on the wedding gown itself and dabble in a few other product-lines, such as mothers’ attire or bridesmaids’ attire. When shops focus primarily on the bride’s gown, there tends to be a lack of selection and lack of attention devoted to the other product lines. At a traditional bridal shop, the bride is the primary focus, and everything else is secondary.
Bride’s Entourage offers an entirely different shopping experience. At our shop, the focus is everything besides the wedding gown. This means that our customers will be offered a wide selection of their desired attire, and their needs will be our primary focus. We will have the most comprehensive selection of mothers’ attire, attendants’ attire, and bridal accessories.
Another competitive advantage is our location. We are located in downtown Portland, which is geographically convenient to customers in the greater Portland area and the surrounding suburbs. Downtown Portland is a destination shopping area, and our store is located directly across the street from one of the largest and most up-scale shopping malls in the Pacific Northwest. In addition, our shop is located on the corner of a main intersection with great street visibility and free parking. We are located in a complex that includes jewelry stores and a tuxedo shop, all of which are complementary businesses.
5.2 Marketing Strategy
Bride’s Entourage will use the following mediums for its marketing efforts:
- Local Wedding Publications – This includes magazines that are used to promote wedding shows and local wedding resource books.
- Bridal Consultants – By building relationships with local bridal consultants, we will have a direct referral source.
- TheKnot.com – This is a web site specifically geared toward people who are preparing for a wedding. Visitors to this site can do state-specific searches for shops and services in their area. By listing ourselves on this site, we will be specifically targeting our market.
- Web Links – Most designers offer a “store locator” on their web pages. Therefore, when available, we will be listed on the web sites of the designers whose lines we carry, with a link to our web site.
- Yellow Pages – We will be listed under the “bridal” section of the yellow pages, so this will serve as a standard resource for customers to find us.
5.3 Sales Strategy
- Customers need to be acknowledged and attended to right away. Everyone who walks through the door is preparing for a big event. They are probably not in our shop to browse or make a casual purchase, so they need to be taken seriously immediately.
- Our expertise will help customers stay focused. The process of choosing bridal attire can be overwhelming, because it is such a significant purchase, and because there are so many variables (e.g. colors, event setting, coordinating with the other participants, etc.). Therefore, it will be critical to navigate the customer through the process efficiently. By controlling the process, the outcome (the sale) is more attainable.
- In addition to selling goods, we are selling a shopping experience. Because each woman makes wedding purchases only a few times in her life, the process of shopping for bridal attire is quite memorable, and is often a bonding experience for moms, girl friends, and the bride. If the experience is a positive one, word of mouth will grow exponentially.
- Sales goals will be set for our employees, and achievement of those goals will be rewarded monetarily.
5.3.1 Sales Forecast
The following table illustrates the forecasted sales for Bride’s Entourage. The forecast reflects sales to slightly more than one percent of the total customer base in Multnomah County, based on the following assumptions:
- Total weddings in Multnomah County: 12,000 annually
- Two moms per wedding
- Four bridesmaids per wedding
- A flower girl at 62% of the weddings
One percent is a sensible estimate for the first year of operations. There are currently about 40 shops in Multnomah County that carry some or all of the items offered at Bride’s Entourage. Assuming that the customer base was divided evenly among these shops, each shop would have about a two-and-a-half percent market share. However, because this will be the first year of operations for Bride’s Entourage, that “even share” of the market is not expected right away. It is expected that by year two, the market share will increase to two percent, and by year three, the market share will exceed three percent. This will happen as Bride’s Entourage becomes known as the place to shop for mothers’ attire, attendants’ attire, and other bridal accessories.
To break the sales forecast down even further, the goal of of sales in year one is equivalent to selling to 160 wedding parties during the year, or to three wedding parties per week.
The table is constructed in such a way that it counts a sale when cash is received. When dresses are ordered, a minimum 50% deposit is required. When a customer receives the item they ordered, the remaining 50% is due. For projection purposes, it is assumed that the dresses will arrive two to three months after they are ordered. So, for example, if a customer orders a $200 dress in January, $100 goes into January’s sales, and $100 goes into April’s sales. For shoes and accessories, we are assuming that the items will be in stock, therefore, those projections reflect the gross amount of the sale on the day of purchase.
Costs of sales assumes that for clothing, the wholesale cost will average about 46.5% of the retail price, and for accessories, the wholesale cost will average about 30% of the retail price. For the clothing items, there is a two-month lag in cost of sales because the inventory takes two to three months to arrive from the day it is ordered, and the store does not pay for custom-ordered items until they are shipped.
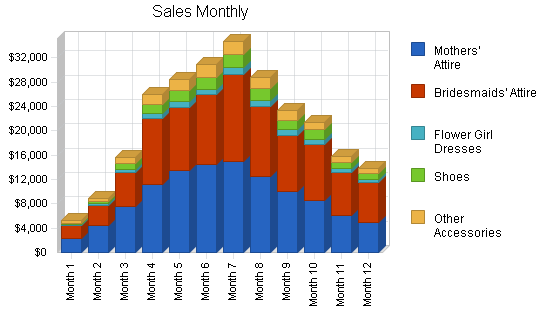

| Sales Forecast | |||
| Year 1 | Year 2 | Year 3 | |
| Sales | |||
| Mothers’ Attire | $110,500 | $193,375 | $338,406 |
| Bridesmaids’ Attire | $101,388 | $147,013 | $213,168 |
| Flower Girl Dresses | $8,650 | $11,245 | $14,619 |
| Shoes | $16,300 | $22,005 | $29,707 |
| Other Accessories | $15,950 | $20,735 | $26,956 |
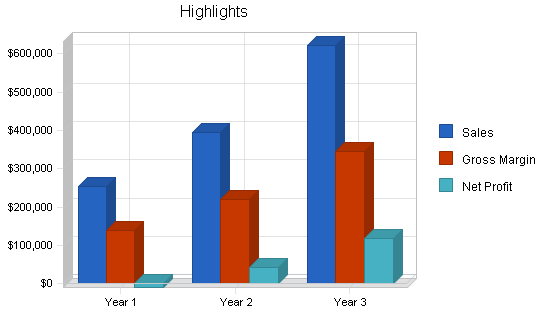
| Total Sales | $252,788 | $394,373 | $622,855 |
| Direct Cost of Sales | Year 1 | Year 2 | Year 3 |
| Clothing | $99,096 | $158,553 | $253,684 |
| Shoes and Other Accessories | $10,485 | $13,631 | $17,720 |
| Subtotal Direct Cost of Sales | $109,581 | $172,183 | $271,404 |
5.4 Milestones
The accompanying table lists the critical milestones for Bride’s Entourage from now until the store is ready to open for business. Dorina Thaker will be in charge of each of the completion of each of these items.

| Milestones | |||||
| Milestone | Start Date | End Date | Budget | Manager | Department |
| Business Plan | 6/30/2003 | 9/30/2003 | $0 | Dorina Thaker | Administrative |
| Licensing and Permits | 7/1/2003 | 8/31/2003 | $0 | Dorina Thaker | Administrative |
| Site Selection and Lease Negotiations | 7/7/2003 | 10/15/2003 | $0 | Dorina Thaker | Administrative |
| Secure Start-Up Financing | 7/28/2003 | 10/15/2003 | $0 | Dorina Thaker | Administrative |
| Secure Line of Credit | 7/28/2003 | 10/15/2003 | $0 | Dorina Thaker | Administrative |
| Buying Show | 9/10/2003 | 9/13/2003 | $0 | Dorina Thaker | Administrative |
| Web Site Construction | 10/8/2003 | 11/15/2003 | $0 | Dorina Thaker | Administrative |
| Accounting Plan | 11/15/2003 | 1/15/2004 | $0 | Dorina Thaker | Administrative |
| Leasehold Improvements | 1/2/2004 | 2/28/2004 | $0 | Dorina Thaker | Administrative |
| Personnel Plan | 1/15/2004 | 2/15/2004 | $0 | Dorina Thaker | Administrative |
| Totals | $0 | ||||
Web Plan Summary
The Bride’s Entourage website will be an expanded business card for the store. Visitors will be able to receive information about the designers we carry as well as basic store information, such as location and store hours.
The site will also be a resource for bridesmaids who are unable to physically come in to order their attire. Through a secure log in, they will be able to provide the necessary information to place their order. This is an added convenience that most bridal shops do not offer.
6.1 Website Marketing Strategy
The website will be an additional resource for customers who want to learn more about our store. Visitors to our site will fall into two primary categories:
- People who have not yet been to the shop and want to learn more about it.
- Bridesmaids who are ready to order their attire.
Category 1 visitors will be coming to the site to learn more about the store and what we have to offer. Highlights for these visitors will be the store description, links to our designers’ sites, a map to the store, contact information, and store hours.
Category 2 visitors will be bridesmaids who are unable to come into the store to be measured and/or pay their deposit. It is quite common for bridesmaids to be out-of-town and unable to physically come in to complete their purchase. While our customers will be able to complete sales by phone and fax, they will appreciate the added convenience of being able to complete their purchases online. Once the bridesmaid gown has been selected for a bridal party, a secure login will be created for each of the bridesmaids so that they can complete the necessary order information on line.
6.2 Development Requirements
Initially, the Bride’s Entourage website will be developed with few technical resources. A simple hosting provider will host the site and provide the technical back end. We will work with a contracted web page designer to develop a simple, yet classy, site.
The most technically complex portion of the site will be the bridesmaid ordering portion. For this, a secure site must be created so that credit card information can be transmitted safely. In addition, it will need to be designed in such a way that store employees will be able to set up the necessary profiles for bridesmaids to log in.
Management Summary
Bride’s Entourage will be managed by the owner, Dorina Thaker (complete resume is enclosed). Dagny is a CPA who spent four years in public accounting. Her efforts were primarily focused on auditing the financial statements of closely-held businesses in the greater Portland area. Through this work, she developed an understanding of various business cycles, internal controls, cash flow, inventory management, ratio analysis, variance analysis, small business dynamics, and basic tax principles. While working in public accounting, Dagny supervised numerous projects and teams of various sizes. She frequently represented the firm at public speaking engagements, and she established a recruiting program for the firm.
For the past two years, Dagny has performed extensive research on the bridal industry. Her mentors include a bridal boutique owner; a wedding consultant in the greater Portland area who has been planning weddings for nearly 20 years; and a coordinator of a local wedding show. In addition to performing extensive research on the bridal industry, Dagny also worked in a local bridal shop to learn the day-to-day operations. While working as a salesperson at the bridal shop, Dagny was one of the top sellers, often out-performing sales associates who had been there longer and worked more hours than her.
Dagny’s enthusiasm, perceptiveness, and organization skills will be the keys to orchestrating the efforts of the sales team and making Bride’s Entourage a successful business.
Dorina Thaker
SUMMARY OF QUALIFICATIONS
- Certified Public Accountant (CPA), licensed in the state of Oregon
- Lifetime of experience with small businesses
- Excellent organizational and communication skills
[PROPRIETARY AND CONFIDENTIAL INFORMATION REMOVED]
7.1 Personnel Plan
Bride’s Entourage will have a sales force that includes the owner and three part-time employees. The store will have two sales associates in the store on weekdays, and three associates in the store on weekends. Sales associates will be paid an hourly wage of [Proprietary and Confidential Information removed]. In years two and three, the sales associates’ hours will increase to accommodate the planned increase in sales; thus, the wages in years two and three increase significantly.
The owner, Dorina Thaker, will not be paid a salary, but will take distributions from the company profits while maintaining a positive cash balance. The financials in this plan do not yet include the owner’s draw.
| Personnel Plan | |||
| Year 1 | Year 2 | Year 3 | |
| Dorina Thaker, Owner | $0 | $0 | $0 |
| Part Time Sales Associate 1 | $16,800 | $18,000 | $18,500 |
| Part Time Sales Associate 2 | $6,960 | $15,000 | $18,000 |
| Part Time Sales Associate 3 | $6,960 | $8,000 | $8,500 |
| Total People | 4 | 4 | 4 |
| Total Payroll | $30,720 | $41,000 | $45,000 |
Financial Plan
Bride’s Entourage expects to be profitable by the end of its second year of operations. To get the business up and running, we will need to obtain financing. The initial market share will be modest; however, significant growth in market share is expected due to the unique niche that the shop is targeting. The market share is expected to grow at a more modest rate after year three.
8.1 Important Assumptions
The following assumptions are key to understanding the profit and loss projections.
- We do not sell anything on credit – all items must be paid in full before they are taken from the store.
- We are estimating that 80% of the purchases will be made with credit cards. The credit card fees are calculated as 80% of the sales, times 1.8 percent (the fee rate).
- Cost of sales for the clothing items has a two month delay. This is because most clothing items will be custom ordered and, as a result, Bride’s Entourage will not have to pay for them until they arrive about two months after they are ordered.
| General Assumptions | |||
| Year 1 | Year 2 | Year 3 | |
| Plan Month | 1 | 2 | 3 |
| Current Interest Rate | 6.25% | 6.25% | 6.25% |
| Long-term Interest Rate | 6.25% | 6.25% | 6.25% |
| Tax Rate | 30.00% | 30.00% | 30.00% |
| Other | 0 | 0 | 0 |
8.2 Break-even Analysis
For the break-even analysis, the following assumptions were used:
- Fixed costs per month are estimated as total first year operating expenses divided by 12.
- For each item sold, there is a variable price equal to about 43% of the retail price of the item.

| Break-even Analysis | |
| Monthly Revenue Break-even | $21,445 |
| Assumptions: | |
| Average Percent Variable Cost | 43% |
| Estimated Monthly Fixed Cost | $12,149 |
8.3 Projected Profit and Loss
We expect losses in the first year, because it will take time for the store to build momentum and generate traffic. However, once sales increase, the results are positive because many of the other expenses will remain fixed. In fact, we expect that sample inventory costs will actually go down in years to come. Some designers will provide sample inventory at deep discounts and/or provide the samples free of charge once good credit terms are established. As a result, the annual expenditures for sample inventory should decrease.


| Pro Forma Profit and Loss | |||
| Year 1 | Year 2 | Year 3 | |
| Sales | $252,788 | $394,373 | $622,855 |
| Direct Cost of Sales | $109,581 | $172,183 | $271,404 |
| Credit Card Fees | $3,640 | $3,155 | $4,983 |
| Total Cost of Sales | $113,221 | $175,338 | $276,387 |
| Gross Margin | $139,567 | $219,034 | $346,468 |
| Gross Margin % | 55.21% | 55.54% | 55.63% |
| Expenses | |||
| Payroll | $30,720 | $41,000 | $45,000 |
| Sales and Marketing and Other Expenses | $11,900 | $12,000 | $12,000 |
| Depreciation | $2,160 | $2,160 | $2,160 |
| Rent including triple nets | $52,800 | $54,750 | $66,900 |
| Utilities | $9,000 | $9,500 | $10,000 |
| Insurance | $4,200 | $4,600 | $5,100 |
| Payroll Taxes | $4,608 | $6,150 | $6,750 |
| Supplies | $3,600 | $4,000 | $4,300 |
| Repairs and Maintenance | $2,400 | $2,600 | $2,800 |
| Professional Fees | $3,300 | $3,500 | $4,000 |
| Taxes and Licenses | $1,100 | $1,100 | $1,100 |
| New Sample Inventory | $20,000 | $15,000 | $14,000 |
| Total Operating Expenses | $145,788 | $156,360 | $174,110 |
| Profit Before Interest and Taxes | ($6,221) | $62,674 | $172,358 |
| EBITDA | ($4,061) | $64,834 | $174,518 |
| Interest Expense | $3,622 | $2,843 | $2,030 |
| Taxes Incurred | $0 | $17,950 | $51,098 |
| Net Profit | ($9,842) | $41,882 | $119,230 |
| Net Profit/Sales | -3.89% | 10.62% | 19.14% |
8.4 Projected Cash Flow
The cash flow of Bride’s Entourage is somewhat unique. For items that are sold off the floor, the cash flow and revenue recognition is traditional, in that full payment is received at the time of the sale, and the customer takes possession of the item at that time. This is how most of the shoe sales will take place, as well as some of the other accessory purchases.
However, most of the other items in the store have a different flow. Let’s use a dress as an example. The customer will try on a sample in the store, and when she decides to purchase the item, she will most likely have to order it in the size and color of her choosing. For this process to begin, the customer must provide a deposit of at least 50% of the total price of the item (note: while some customers may choose to pay the full amount at the time the order is placed, these illustrations assume that everyone will choose the 50% option). The remaining balance will be due within thirty days of when the item arrives in our store.
This timing issue has also been taken into consideration for the costs of goods sold. The store will be billed for items when the items are shipped, thus cash outflow for the cost of the item will closely match the cash inflow of the customer paying the balance on the item.

| Pro Forma Cash Flow | |||
| Year 1 | Year 2 | Year 3 | |
| Cash Received | |||
| Cash from Operations | |||
| Cash Sales | $252,788 | $394,373 | $622,855 |
| Subtotal Cash from Operations | $252,788 | $394,373 | $622,855 |
| Additional Cash Received | |||
| Sales Tax, VAT, HST/GST Received | $0 | $0 | $0 |
| New Current Borrowing | $0 | $0 | $0 |
| New Other Liabilities (interest-free) | $0 | $0 | $0 |
| New Long-term Liabilities | $0 | $0 | $0 |
| Sales of Other Current Assets | $0 | $0 | $0 |
| Sales of Long-term Assets | $0 | $0 | $0 |
| New Investment Received | $0 | $0 | $0 |
| Subtotal Cash Received | $252,788 | $394,373 | $622,855 |
| Expenditures | Year 1 | Year 2 | Year 3 |
| Expenditures from Operations | |||
| Cash Spending | $30,720 | $41,000 | $45,000 |
| Bill Payments | $194,477 | $302,314 | $450,411 |
| Subtotal Spent on Operations | $225,197 | $343,314 | $495,411 |
| Additional Cash Spent | |||
| Sales Tax, VAT, HST/GST Paid Out | $0 | $0 | $0 |
| Principal Repayment of Current Borrowing | $0 | $0 | $0 |
| Other Liabilities Principal Repayment | $0 | $0 | $0 |
| Long-term Liabilities Principal Repayment | $13,020 | $13,000 | $13,000 |
| Purchase Other Current Assets | $0 | $0 | $0 |
| Purchase Long-term Assets | $0 | $0 | $0 |
| Dividends | $0 | $0 | $0 |
| Subtotal Cash Spent | $238,217 | $356,314 | $508,411 |
| Net Cash Flow | $14,571 | $38,058 | $114,444 |
| Cash Balance | $36,471 | $74,529 | $188,973 |
8.5 Projected Balance Sheet
Bride’s Entourage maintains a strong current ratio throughout. While the net worth of the business is negative in year one, it makes steady gains and becomes positive in year two. By the end of year three, retained earnings is also close to being positive.
| Pro Forma Balance Sheet | |||
| Year 1 | Year 2 | Year 3 | |
| Assets | |||
| Current Assets | |||
| Cash | $36,471 | $74,529 | $188,973 |
| Inventory | $6,878 | $10,808 | $17,036 |
| Other Current Assets | $1,000 | $1,000 | $1,000 |
| Total Current Assets | $44,349 | $86,337 | $207,009 |
| Long-term Assets | |||
| Long-term Assets | $8,500 | $8,500 | $8,500 |
| Accumulated Depreciation | $2,160 | $4,320 | $6,480 |
| Total Long-term Assets | $6,340 | $4,180 | $2,020 |
| Total Assets | $50,689 | $90,517 | $209,029 |
| Liabilities and Capital | Year 1 | Year 2 | Year 3 |
| Current Liabilities | |||
| Accounts Payable | $14,802 | $25,747 | $38,030 |
| Current Borrowing | $0 | $0 | $0 |
| Other Current Liabilities | $0 | $0 | $0 |
| Subtotal Current Liabilities | $14,802 | $25,747 | $38,030 |
| Long-term Liabilities | $51,980 | $38,980 | $25,980 |
| Total Liabilities | $66,782 | $64,727 | $64,010 |
| Paid-in Capital | $30,000 | $30,000 | $30,000 |
| Retained Earnings | ($36,250) | ($46,092) | ($4,210) |
| Earnings | ($9,842) | $41,882 | $119,230 |
| Total Capital | ($16,092) | $25,790 | $145,020 |
| Total Liabilities and Capital | $50,689 | $90,517 | $209,029 |
| Net Worth | ($16,092) | $25,790 | $145,020 |
8.6 Business Ratios
The following table breaks down some of the key financial ratios. Where available, industry averages for Bridal Shops – SIC code 5621.0102, are shown for comparison.
| Ratio Analysis | ||||
| Year 1 | Year 2 | Year 3 | Industry Profile | |
| Sales Growth | 0.00% | 56.01% | 57.94% | -0.02% |
| Percent of Total Assets | ||||
| Inventory | 13.57% | 11.94% | 8.15% | 50.91% |
| Other Current Assets | 1.97% | 1.10% | 0.48% | 24.44% |
| Total Current Assets | 87.49% | 95.38% | 99.03% | 85.49% |
| Long-term Assets | 12.51% | 4.62% | 0.97% | 14.51% |
| Total Assets | 100.00% | 100.00% | 100.00% | 100.00% |
| Current Liabilities | 29.20% | 28.44% | 18.19% | 29.49% |
| Long-term Liabilities | 102.55% | 43.06% | 12.43% | 11.18% |
| Total Liabilities | 131.75% | 71.51% | 30.62% | 40.67% |
| Net Worth | -31.75% | 28.49% | 69.38% | 59.33% |
| Percent of Sales | ||||
| Sales | 100.00% | 100.00% | 100.00% | 100.00% |
| Gross Margin | 55.21% | 55.54% | 55.63% | 40.07% |
| Selling, General & Administrative Expenses | 59.10% | 44.92% | 36.48% | 21.95% |
| Advertising Expenses | 0.00% | 0.00% | 0.00% | 2.92% |
| Profit Before Interest and Taxes | -2.46% | 15.89% | 27.67% | 2.90% |
| Main Ratios | ||||
| Current | 3.00 | 3.35 | 5.44 | 2.64 |
| Quick | 2.53 | 2.93 | 5.00 | 0.74 |
| Total Debt to Total Assets | 131.75% | 71.51% | 30.62% | 5.31% |
| Pre-tax Return on Net Worth | 61.16% | 232.00% | 117.45% | 47.92% |
| Pre-tax Return on Assets | -19.42% | 66.10% | 81.49% | 10.20% |
| Additional Ratios | Year 1 | Year 2 | Year 3 | |
| Net Profit Margin | -3.89% | 10.62% | 19.14% | n.a |
| Return on Equity | 0.00% | 162.40% | 82.22% | n.a |
| Activity Ratios | ||||
| Inventory Turnover | 6.78 | 19.47 | 19.49 | n.a |
| Accounts Payable Turnover | 14.07 | 12.17 | 12.17 | n.a |
| Payment Days | 27 | 24 | 25 | n.a |
| Total Asset Turnover | 4.99 | 4.36 | 2.98 | n.a |
| Debt Ratios | ||||
| Debt to Net Worth | 0.00 | 2.51 | 0.44 | n.a |
| Current Liab. to Liab. | 0.22 | 0.40 | 0.59 | n.a |
| Liquidity Ratios | ||||
| Net Working Capital | $29,548 | $60,590 | $168,980 | n.a |
| Interest Coverage | -1.72 | 22.05 | 84.91 | n.a |
| Additional Ratios | ||||
| Assets to Sales | 0.20 | 0.23 | 0.34 | n.a |
| Current Debt/Total Assets | 29% | 28% | 18% | n.a |
| Acid Test | 2.53 | 2.93 | 5.00 | n.a |
| Sales/Net Worth | 0.00 | 15.29 | 4.29 | n.a |
| Dividend Payout | 0.00 | 0.00 | 0.00 | n.a |
Appendix
| Sales Forecast | |||||||||||||
| Month 1 | Month 2 | Month 3 | Month 4 | Month 5 | Month 6 | Month 7 | Month 8 | Month 9 | Month 10 | Month 11 | Month 12 | ||
| Sales | |||||||||||||
| Mothers’ Attire | 0% | $2,250 | $4,500 | $7,500 | $11,250 | $13,500 | $14,500 | $15,000 | $12,500 | $10,000 | $8,500 | $6,000 | $5,000 |
| Bridesmaids’ Attire | 0% | $2,142 | $3,213 | $5,712 | $10,710 | $10,353 | $11,424 | $14,280 | $11,424 | $9,282 | $9,282 | $7,140 | $6,426 |
| Flower Girl Dresses | 0% | $200 | $300 | $350 | $800 | $900 | $900 | $1,050 | $1,000 | $950 | $850 | $700 | $650 |
| Shoes | 0% | $250 | $400 | $1,000 | $1,500 | $1,900 | $2,000 | $2,250 | $2,100 | $1,500 | $1,500 | $1,000 | $900 |
| Other Accessories | 0% | $425 | $500 | $1,000 | $1,625 | $1,700 | $2,100 | $2,100 | $1,800 | $1,550 | $1,300 | $1,000 | $850 |
| Total Sales | $5,267 | $8,913 | $15,562 | $25,885 | $28,353 | $30,924 | $34,680 | $28,824 | $23,282 | $21,432 | $15,840 | $13,826 | |
| Direct Cost of Sales | Month 1 | Month 2 | Month 3 | Month 4 | Month 5 | Month 6 | Month 7 | Month 8 | Month 9 | Month 10 | Month 11 | Month 12 | |
| Clothing | $0 | $0 | $4,226 | $7,538 | $12,673 | $16,687 | $15,617 | $12,248 | $11,178 | $6,843 | $6,314 | $5,773 | |
| Shoes and Other Accessories | $405 | $540 | $1,200 | $1,470 | $1,620 | $1,320 | $1,140 | $720 | $570 | $540 | $480 | $480 | |
| Subtotal Direct Cost of Sales | $405 | $540 | $5,426 | $9,008 | $14,293 | $18,007 | $16,757 | $12,968 | $11,748 | $7,383 | $6,794 | $6,253 | |
| Personnel Plan | |||||||||||||
| Month 1 | Month 2 | Month 3 | Month 4 | Month 5 | Month 6 | Month 7 | Month 8 | Month 9 | Month 10 | Month 11 | Month 12 | ||
| Dorina Thaker, Owner | 0% | $0 | $0 | $0 | $0 | $0 | $0 | $0 | $0 | $0 | $0 | $0 | $0 |
| Part Time Sales Associate 1 | 0% | $1,400 | $1,400 | $1,400 | $1,400 | $1,400 | $1,400 | $1,400 | $1,400 | $1,400 | $1,400 | $1,400 | $1,400 |
| Part Time Sales Associate 2 | 0% | $580 | $580 | $580 | $580 | $580 | $580 | $580 | $580 | $580 | $580 | $580 | $580 |
| Part Time Sales Associate 3 | 0% | $580 | $580 | $580 | $580 | $580 | $580 | $580 | $580 | $580 | $580 | $580 | $580 |
| Total People | 4 | 4 | 4 | 4 | 4 | 4 | 4 | 4 | 4 | 4 | 4 | 4 | |
| Total Payroll | $2,560 | $2,560 | $2,560 | $2,560 | $2,560 | $2,560 | $2,560 | $2,560 | $2,560 | $2,560 | $2,560 | $2,560 | |
| General Assumptions | |||||||||||||
| Month 1 | Month 2 | Month 3 | Month 4 | Month 5 | Month 6 | Month 7 | Month 8 | Month 9 | Month 10 | Month 11 | Month 12 | ||
| Plan Month | 1 | 2 | 3 | 4 | 5 | 6 | 7 | 8 | 9 | 10 | 11 | 12 | |
| Current Interest Rate | 6.25% | 6.25% | 6.25% | 6.25% | 6.25% | 6.25% | 6.25% | 6.25% | 6.25% | 6.25% | 6.25% | 6.25% | |
| Long-term Interest Rate | 6.25% | 6.25% | 6.25% | 6.25% | 6.25% | 6.25% | 6.25% | 6.25% | 6.25% | 6.25% | 6.25% | 6.25% | |
| Tax Rate | 30.00% | 30.00% | 30.00% | 30.00% | 30.00% | 30.00% | 30.00% | 30.00% | 30.00% | 30.00% | 30.00% | 30.00% | |
| Other | 0 | 0 | 0 | 0 | 0 | 0 | 0 | 0 | 0 | 0 | 0 | 0 | |
| Pro Forma Profit and Loss | |||||||||||||
| Month 1 | Month 2 | Month 3 | Month 4 | Month 5 | Month 6 | Month 7 | Month 8 | Month 9 | Month 10 | Month 11 | Month 12 | ||
| Sales | $5,267 | $8,913 | $15,562 | $25,885 | $28,353 | $30,924 | $34,680 | $28,824 | $23,282 | $21,432 | $15,840 | $13,826 | |
| Direct Cost of Sales | $405 | $540 | $5,426 | $9,008 | $14,293 | $18,007 | $16,757 | $12,968 | $11,748 | $7,383 | $6,794 | $6,253 | |
| Credit Card Fees | $76 | $128 | $224 | $373 | $408 | $445 | $499 | $415 | $335 | $309 | $228 | $199 | |
| Total Cost of Sales | $481 | $668 | $5,650 | $9,381 | $14,701 | $18,452 | $17,256 | $13,383 | $12,083 | $7,691 | $7,022 | $6,452 | |
| Gross Margin | $4,786 | $8,245 | $9,912 | $16,504 | $13,652 | $12,472 | $17,424 | $15,441 | $11,199 | $13,741 | $8,818 | $7,374 | |
| Gross Margin % | 90.87% | 92.50% | 63.69% | 63.76% | 48.15% | 40.33% | 50.24% | 53.57% | 48.10% | 64.11% | 55.67% | 53.33% | |
| Expenses | |||||||||||||
| Payroll | $2,560 | $2,560 | $2,560 | $2,560 | $2,560 | $2,560 | $2,560 | $2,560 | $2,560 | $2,560 | $2,560 | $2,560 | |
| Sales and Marketing and Other Expenses | $1,500 | $500 | $500 | $2,000 | $700 | $700 | $700 | $700 | $700 | $2,500 | $700 | $700 | |
| Depreciation | $180 | $180 | $180 | $180 | $180 | $180 | $180 | $180 | $180 | $180 | $180 | $180 | |
| Rent including triple nets | $4,400 | $4,400 | $4,400 | $4,400 | $4,400 | $4,400 | $4,400 | $4,400 | $4,400 | $4,400 | $4,400 | $4,400 | |
| Utilities | $750 | $750 | $750 | $750 | $750 | $750 | $750 | $750 | $750 | $750 | $750 | $750 | |
| Insurance | $350 | $350 | $350 | $350 | $350 | $350 | $350 | $350 | $350 | $350 | $350 | $350 | |
| Payroll Taxes | 15% | $384 | $384 | $384 | $384 | $384 | $384 | $384 | $384 | $384 | $384 | $384 | $384 |
| Supplies | $300 | $300 | $300 | $300 | $300 | $300 | $300 | $300 | $300 | $300 | $300 | $300 | |
| Repairs and Maintenance | $200 | $200 | $200 | $200 | $200 | $200 | $200 | $200 | $200 | $200 | $200 | $200 | |
| Professional Fees | $100 | $100 | $500 | $500 | $1,000 | $500 | $100 | $100 | $100 | $100 | $100 | $100 | |
| Taxes and Licenses | 15% | $0 | $0 | $0 | $0 | $0 | $0 | $0 | $100 | $0 | $1,000 | $0 | $0 |
| New Sample Inventory | $0 | $0 | $2,000 | $2,000 | $2,000 | $2,000 | $2,000 | $1,000 | $1,000 | $4,000 | $2,000 | $2,000 | |
| Total Operating Expenses | $10,724 | $9,724 | $12,124 | $13,624 | $12,824 | $12,324 | $11,924 | $11,024 | $10,924 | $16,724 | $11,924 | $11,924 | |
| Profit Before Interest and Taxes | ($5,938) | ($1,479) | ($2,212) | $2,880 | $828 | $148 | $5,500 | $4,417 | $275 | ($2,983) | ($3,106) | ($4,550) | |
| EBITDA | ($5,758) | ($1,299) | ($2,032) | $3,060 | $1,008 | $328 | $5,680 | $4,597 | $455 | ($2,803) | ($2,926) | ($4,370) | |
| Interest Expense | $333 | $327 | $322 | $316 | $310 | $305 | $299 | $293 | $288 | $282 | $276 | $271 | |
| Taxes Incurred | $0 | $0 | $0 | $0 | $0 | $0 | $0 | $0 | $0 | $0 | $0 | $0 | |
| Net Profit | ($6,271) | ($1,807) | ($2,534) | $2,564 | $517 | ($156) | $5,201 | $4,124 | ($13) | ($3,265) | ($3,382) | ($4,821) | |
| Net Profit/Sales | -119.06% | -20.27% | -16.28% | 9.91% | 1.82% | -0.51% | 15.00% | 14.31% | -0.06% | -15.23% | -21.35% | -34.87% | |
| Pro Forma Cash Flow | |||||||||||||
| Month 1 | Month 2 | Month 3 | Month 4 | Month 5 | Month 6 | Month 7 | Month 8 | Month 9 | Month 10 | Month 11 | Month 12 | ||
| Cash Received | |||||||||||||
| Cash from Operations | |||||||||||||
| Cash Sales | $5,267 | $8,913 | $15,562 | $25,885 | $28,353 | $30,924 | $34,680 | $28,824 | $23,282 | $21,432 | $15,840 | $13,826 | |
| Subtotal Cash from Operations | $5,267 | $8,913 | $15,562 | $25,885 | $28,353 | $30,924 | $34,680 | $28,824 | $23,282 | $21,432 | $15,840 | $13,826 | |
| Additional Cash Received | |||||||||||||
| Sales Tax, VAT, HST/GST Received | 0.00% | $0 | $0 | $0 | $0 | $0 | $0 | $0 | $0 | $0 | $0 | $0 | $0 |
| New Current Borrowing | $0 | $0 | $0 | $0 | $0 | $0 | $0 | $0 | $0 | $0 | $0 | $0 | |
| New Other Liabilities (interest-free) | $0 | $0 | $0 | $0 | $0 | $0 | $0 | $0 | $0 | $0 | $0 | $0 | |
| New Long-term Liabilities | $0 | $0 | $0 | $0 | $0 | $0 | $0 | $0 | $0 | $0 | $0 | $0 | |
| Sales of Other Current Assets | $0 | $0 | $0 | $0 | $0 | $0 | $0 | $0 | $0 | $0 | $0 | $0 | |
| Sales of Long-term Assets | $0 | $0 | $0 | $0 | $0 | $0 | $0 | $0 | $0 | $0 | $0 | $0 | |
| New Investment Received | $0 | $0 | $0 | $0 | $0 | $0 | $0 | $0 | $0 | $0 | $0 | $0 | |
| Subtotal Cash Received | $5,267 | $8,913 | $15,562 | $25,885 | $28,353 | $30,924 | $34,680 | $28,824 | $23,282 | $21,432 | $15,840 | $13,826 | |
| Expenditures | Month 1 | Month 2 | Month 3 | Month 4 | Month 5 | Month 6 | Month 7 | Month 8 | Month 9 | Month 10 | Month 11 | Month 12 | |
| Expenditures from Operations | |||||||||||||
| Cash Spending | $2,560 | $2,560 | $2,560 | $2,560 | $2,560 | $2,560 | $2,560 | $2,560 | $2,560 | $2,560 | $2,560 | $2,560 | |
| Bill Payments | $1,280 | $8,361 | $7,523 | $9,984 | $12,115 | $28,000 | $32,190 | $25,112 | $17,839 | $19,145 | $17,111 | $15,817 | |
| Subtotal Spent on Operations | $3,840 | $10,921 | $10,083 | $12,544 | $14,675 | $30,560 | $34,750 | $27,672 | $20,399 | $21,705 | $19,671 | $18,377 | |
| Additional Cash Spent | |||||||||||||
| Sales Tax, VAT, HST/GST Paid Out | $0 | $0 | $0 | $0 | $0 | $0 | $0 | $0 | $0 | $0 | $0 | $0 | |
| Principal Repayment of Current Borrowing | $0 | $0 | $0 | $0 | $0 | $0 | $0 | $0 | $0 | $0 | $0 | $0 | |
| Other Liabilities Principal Repayment | $0 | $0 | $0 | $0 | $0 | $0 | $0 | $0 | $0 | $0 | $0 | $0 | |
| Long-term Liabilities Principal Repayment | $1,085 | $1,085 | $1,085 | $1,085 | $1,085 | $1,085 | $1,085 | $1,085 | $1,085 | $1,085 | $1,085 | $1,085 | |
| Purchase Other Current Assets | $0 | $0 | $0 | $0 | $0 | $0 | $0 | $0 | $0 | $0 | $0 | $0 | |
| Purchase Long-term Assets | $0 | $0 | $0 | $0 | $0 | $0 | $0 | $0 | $0 | $0 | $0 | $0 | |
| Dividends | $0 | $0 | $0 | $0 | $0 | $0 | $0 | $0 | $0 | $0 | $0 | $0 | |
| Subtotal Cash Spent | $4,925 | $12,006 | $11,168 | $13,629 | $15,760 | $31,645 | $35,835 | $28,757 | $21,484 | $22,790 | $20,756 | $19,462 | |
| Net Cash Flow | $342 | ($3,093) | $4,394 | $12,256 | $12,593 | ($721) | ($1,155) | $67 | $1,798 | ($1,358) | ($4,916) | ($5,636) | |
| Cash Balance | $22,242 | $19,149 | $23,544 | $35,799 | $48,392 | $47,671 | $46,516 | $46,583 | $48,381 | $47,023 | $42,107 | $36,471 | |
| Pro Forma Balance Sheet | |||||||||||||
| Month 1 | Month 2 | Month 3 | Month 4 | Month 5 | Month 6 | Month 7 | Month 8 | Month 9 | Month 10 | Month 11 | Month 12 | ||
| Assets | Starting Balances | ||||||||||||
| Current Assets | |||||||||||||
| Cash | $21,900 | $22,242 | $19,149 | $23,544 | $35,799 | $48,392 | $47,671 | $46,516 | $46,583 | $48,381 | $47,023 | $42,107 | $36,471 |
| Inventory | $28,350 | $27,945 | $27,405 | $21,979 | $12,971 | $15,722 | $19,807 | $18,433 | $14,264 | $12,923 | $8,121 | $7,473 | $6,878 |
| Other Current Assets | $1,000 | $1,000 | $1,000 | $1,000 | $1,000 | $1,000 | $1,000 | $1,000 | $1,000 | $1,000 | $1,000 | $1,000 | $1,000 |
| Total Current Assets | $51,250 | $51,187 | $47,554 | $46,522 | $49,770 | $65,114 | $68,478 | $65,949 | $61,847 | $62,304 | $56,144 | $50,580 | $44,349 |
| Long-term Assets | |||||||||||||
| Long-term Assets | $8,500 | $8,500 | $8,500 | $8,500 | $8,500 | $8,500 | $8,500 | $8,500 | $8,500 | $8,500 | $8,500 | $8,500 | $8,500 |
| Accumulated Depreciation | $0 | $180 | $360 | $540 | $720 | $900 | $1,080 | $1,260 | $1,440 | $1,620 | $1,800 | $1,980 | $2,160 |
| Total Long-term Assets | $8,500 | $8,320 | $8,140 | $7,960 | $7,780 | $7,600 | $7,420 | $7,240 | $7,060 | $6,880 | $6,700 | $6,520 | $6,340 |
| Total Assets | $59,750 | $59,507 | $55,694 | $54,482 | $57,550 | $72,714 | $75,898 | $73,189 | $68,907 | $69,184 | $62,844 | $57,100 | $50,689 |
| Liabilities and Capital | Month 1 | Month 2 | Month 3 | Month 4 | Month 5 | Month 6 | Month 7 | Month 8 | Month 9 | Month 10 | Month 11 | Month 12 | |
| Current Liabilities | |||||||||||||
| Accounts Payable | $1,000 | $8,113 | $7,192 | $9,599 | $11,187 | $26,919 | $31,344 | $24,519 | $17,198 | $18,573 | $16,583 | $15,306 | $14,802 |
| Current Borrowing | $0 | $0 | $0 | $0 | $0 | $0 | $0 | $0 | $0 | $0 | $0 | $0 | $0 |
| Other Current Liabilities | $0 | $0 | $0 | $0 | $0 | $0 | $0 | $0 | $0 | $0 | $0 | $0 | $0 |
| Subtotal Current Liabilities | $1,000 | $8,113 | $7,192 | $9,599 | $11,187 | $26,919 | $31,344 | $24,519 | $17,198 | $18,573 | $16,583 | $15,306 | $14,802 |
| Long-term Liabilities | $65,000 | $63,915 | $62,830 | $61,745 | $60,660 | $59,575 | $58,490 | $57,405 | $56,320 | $55,235 | $54,150 | $53,065 | $51,980 |
| Total Liabilities | $66,000 | $72,028 | $70,022 | $71,344 | $71,847 | $86,494 | $89,834 | $81,924 | $73,518 | $73,808 | $70,733 | $68,371 | $66,782 |
| Paid-in Capital | $30,000 | $30,000 | $30,000 | $30,000 | $30,000 | $30,000 | $30,000 | $30,000 | $30,000 | $30,000 | $30,000 | $30,000 | $30,000 |
| Retained Earnings | ($36,250) | ($36,250) | ($36,250) | ($36,250) | ($36,250) | ($36,250) | ($36,250) | ($36,250) | ($36,250) | ($36,250) | ($36,250) | ($36,250) | ($36,250) |
| Earnings | $0 | ($6,271) | ($8,077) | ($10,611) | ($8,047) | ($7,530) | ($7,686) | ($2,486) | $1,639 | $1,626 | ($1,640) | ($5,022) | ($9,842) |
| Total Capital | ($6,250) | ($12,521) | ($14,327) | ($16,861) | ($14,297) | ($13,780) | ($13,936) | ($8,736) | ($4,611) | ($4,624) | ($7,890) | ($11,272) | ($16,092) |
| Total Liabilities and Capital | $59,750 | $59,507 | $55,694 | $54,482 | $57,550 | $72,714 | $75,898 | $73,189 | $68,907 | $69,184 | $62,844 | $57,100 | $50,689 |
| Net Worth | ($6,250) | ($12,521) | ($14,327) | ($16,861) | ($14,297) | ($13,780) | ($13,936) | ($8,736) | ($4,611) | ($4,624) | ($7,890) | ($11,272) | ($16,092) |

