
Sedibeng Breweries
Executive Summary
Sedibeng Breweries is a medium-scale brewery that is located in the growing industrial centre of Selebi Phikwe, Botswana. This is a relatively new business in its start-up phase having been incorporated recently.
We are on the brink of penetrating a lucrative market in a rapidly-growing economy. The current trend towards an increase in the number of entrepreneurs and competition amongst existing companies presents an opportunity for Sedibeng Breweries to penetrate the market. Our products will be positioned very carefully. They will be of extremely high quality to ensure customer satisfaction, supported by impeccable service to our customers. Our primary goal will be to establish and strengthen our license to trade, which will be bestowed by the communities in which we function. As Sedibeng Breweries prospers and grows, these communities will continue to benefit from both the value created by Sedibeng Breweries and its behavior as a corporate citizen.
Initial plans are to produce three main lines of products primarily focusing on X, Y, and Z beer (which comes in different flavors: B, P, C and S). These products will be sold in different sized containers ranging from the 250 ml ginger beer to the 500 ml traditional beer. These products shall be extensively distributed to remote, yet extremely viable areas where the market is appreciative of readily available, good quality brew.
To prosper there is need for Sedibeng to be flexible and responsive, to delight customers by providing them with what they want, when they want it and before the competition. From product concept to goods dispatch we intend to ensure that every policy and procedure, system and process must have the objective of improving the flexibility and response of the whole company. There is a need for interaction between all functional areas, particularly between marketing and manufacturing, if the organization is to realize its full potential, with manufacturing being employed as a strategic weapon.
Our marketing strategy will be based mainly on ensuring customers know what need the product(s) is able to fulfill, and making the right product and information available to the right target customer. Hence we intend to implement a market penetration strategy that will ensure that we are well known and respected in our respective industry. We will ensure that our products’ prices take into consideration people’s budgets, and that these people appreciate the product(s) and know that it exists, including where to find it. However these prices will also take into consideration the cost of production and distribution so as to ensure that we remain viable and operational. The marketing effort will convey the sense of quality and satisfaction in every picture, every promotion, and every publication. Our promotional strategy will involve integrating advertising, events, personal selling, public relations and direct marketing. In the long term Internet marketing shall also be undertaken, details of which are provided in the marketing section of the following plan.
Our target markets will primarily constitute the corporate and working class who appreciate good quality traditional beer. The working class will range from the miners, who constitute a large portion of the market, to administrative personnel appreciative of good quality traditional beer. The corporate or managerial segment will constitute those managers, who though aware of their image and reputation, want to put aside their ties and jackets after hours and/or on weekends to drink good traditional beer, easily accessible in the urban areas. The common bond will be the appreciation of a good-quality traditional brew able to fulfill their thirst. Sedibeng is primarily targeting a market share of 6% to attain sales of approximately $1.5 million in our initial year. Sedibeng Breweries will pride itself on its production ability, competitive prices, its high standards of quality and its adaptability to changes in the market and in the method of its practice.
It is important to recognize that we do not intend that our tangible resources alone will make us potent competitors but more so our intangibles, such as our ability to relate to consumers, management style, corporate culture and commitment. These elements will differentiate us from our competitors and contribute towards the development of a sustainable competitive advantage.
We intend to compensate our personnel well, so as to retain their invaluable expertise and to ensure job satisfaction and enrichment through delegation of authority. Our compensation will include health care, generous profit sharing, plus a minimum of three weeks vacation. As an equal opportunity employer, we respect the diversity and human rights of our people, and strive to achieve optimal productivity, while realizing each employee’s full potential. Awards will be given out to outstanding individuals, groups and plants for hard work and production so as to instill a sense of fun and promote the maintenance of high standards. By encouraging all employees close to our customers to think tactically about what Sedibeng Breweries service offerings should be, and by having enthusiastic, capable and empowered people interacting with our customers, we build the competitive advantage of being able to meet our customers’ needs better than anyone else.
Sedibeng Breweries intends to provide the customer with more than just a traditional brew. We intend to provide a quality brew that will not only be refreshing and pleasurable, but also encourage gatherings and sharing of fun. Our customers are assured of products that have been produced using the highest quality standards.
As we grow we want to grow right. Initially pursuing organic development and expansion we intend to undertake vertical integration in the future so as to be in total control of our raw materials and goods dispatch. For example, we realizing that we have to be in constant touch with our stakeholders to ensure market knowledge at all times. This is the nature of the channels we deal with. Also, we intend to build our management team correctly. We need the right people, in the right place, at the right time if we are to ensure optimum growth. We intend to develop our team so that our people can grow as the company grows– a mutually beneficial relationship. We shall strive to attain our primary goal, which is to develop and strengthen our license to trade, bestowed by the communities in which we function. As Sedibeng Breweries prospers and grows, these communities will continue to benefit from both the value created by Sedibeng and its behavior as a corporate citizen.
1.1 Objectives
Our business strategy will revolve around the need to provide quality brew to our various target customers, in the process fully satisfying their needs. This shall be undertaken through the implementation of high quality control standards and technological innovations, as well as the recruitment of a professional production and sales team, and the production of good quality marketing material designed to cater for various kinds of customers. This marketing material shall be professionally done so as to be reflective of our intended image and reputation. We shall position ourselves as a quality manufacturer that strives to provide quench fulfillment, enjoyment, reliability and a good image. We intend to establish a good rapport with all the relevant stakeholders.
With time we intend to establish our presence on the World Wide Web, which will increase the knowledge of our products to the various market segments we shall be targeting. Web presence is a natural objective in reaching the appropriate potential customers. Well-done brochures, company profiles and business cards often has a triggering effect on clients contemplating on ordering our products. Hence this will undoubtedly generate increased sales of our products.

Our objectives will revolve around the following guiding principles:
- Provision of a great work environment, treating each other with respect and dignity.
- Apply high-quality standards of excellence to all business processes.
- Develop enthusiastically-satisfied customers all of the time.
- Contribute positively to our communities and our environment.
- To continuously formalize and measure cross-functional working communication so as to ensure that the various departments work harmoniously towards attainment of company objectives.
- To instill a culture of continuous improvement in beating standards of customer satisfaction and efficiency.
- Fully commit to supporting growth and development in the economy.
Ultimately we intend to create a stable business platform that will create prosperity for all those involved in the business venture at all levels, and to uplift unemployed Botswanans who are prepared to participate in this venture.
1.2 Keys to Success
The keys to Sedibeng Breweries success will undoubtedly be effective market segmentation through identification of several niche markets and implementation strategies. Along these lines the company intends to implement advertising, personal selling and direct marketing strategies aimed at the target markets. Our advertising marketing strategies will rotate around.
Hence our key success factors will include the following:
Excellence in Fulfilling the Promise: We intend to produce and provide products of uncompromised quality to our customers. This is so as to meet the needs and standards of our customers.
Effective and Efficient Distribution Network: The importance of such cannot be overemphasized in our line of business. We intend to establish an excellent distribution network that will enable us to rapidly respond to customers’ orders, and be available in remote areas our competitor has not yet exploited.
Assembly Technology: To ensure quality brewed beverages it is essential to utilize the latest and most efficient assembly technology. Keeping abreast with technological developments will ensure we gain, and maintain, a competitive advantage utilizing the latest production techniques.
Loyalty and Dedication: The loyalty and dedication of our employees shall be essential to the prosperity of the organization. We recognize that Corporate commitment to success should lead to the survival and prosperity of the products, and ultimately the organization as a whole.
Marketing Know-how: In an increasingly competitive market there is need to aggressively market our business so as to be continuously at the top of our prospective and current client’s minds.
Adherence to Stringent Values and Principles: Sedibeng needs to acknowledge the fact that the financial and strategic management of the business will ultimately determine its prosperity and success. Hence we intend to adhere to stringent values and principles that will enable such to be achieved.
1.3 Mission
Sedibeng Breweries intends to create a pleasant, enjoyable and sociable environment through the provision of refreshing high-quality brews. Hence we intend to assist in the creation of a welcoming and relaxed ambiance reflective of people enjoying themselves. We are sensitive to the taste, look and feel of good beer, as well as affordable prices depending on the market. We intend to provide the best possible value to our customers who care about quality products at affordable prices, and we want every dollar spent on our products to be well spent. Hence our value proposition is to sell the benefit of refreshness and enjoyment to our various consumers at reasonable prices.
Internally we intend to create and nurture a healthy, creative, respectful and enjoyable office and plant environment, in which our employees are fairly compensated and encouraged to respect the customer and the quality of the product we produce. In addition follow-up will be mandatory so as to ensure customer satisfaction and make any improvements as recommended by the customers in future. We seek a fair and responsible profit, enough to keep the company financially healthy for the short and long term, and to fairly compensate owners and investors for the money and risk.
We also intend to obtain ISO 9000 certification from the South African Bureau of Standards (SABS) so that our products are internationally recognized and approved. This will assist in our penetrating the regional and international markets, intentions of which we have in future. However this will occur after we have established ourselves on the local market. The above is well summarized in our mission statement which goes as follows:
Our mission is to carefully attend to detail in the hygiene in all our brews, and to uphold superb quality at all levels of production. To satisfy all our customers and stakeholders.
Company Summary
Sedibeng Breweries is a relatively new company providing high quality alcoholic and non-alcoholic beverages in the local market. Sedibeng Breweries intends to focus on the brewing process and the brewery itself. The brewery will house four stainless steel vessels whose shiny finish will be highlighted by the flood lights on the ceiling. Interested stakeholders will be able to observe the brewing process during the day and will be offered guided educational tours of the brewing facility.
It will focus initially on providing and satisfying two kinds of markets:
-
Corporate Class: This will constitute all those people in middle and top managerial positions who appreciate good quality traditional beer.
-
Working Class: This will range from the miners who constitute a large portion of the market to administrative personnel appreciative of good quality traditional beer.
As it grows it will take on people and expand into related markets. It will also look for additional leverage by establishing relationships and representations with appropriate strategic allies.
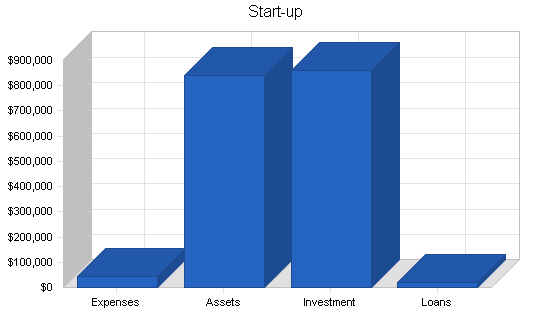
2.1 Start-up Summary
Total start-up capital and expenses (including legal costs, logo design, stationery and related expenses) came to approximately $41,700. Start-up assets required and utilized included brewing plant and machinery, pick-ups, office furniture, personal computers and other office equipment. This figure comes to $840,000.
| Start-up Funding | |
| Start-up Expenses to Fund | $41,700 |
| Start-up Assets to Fund | $840,000 |
| Total Funding Required | $881,700 |
| Assets | |
| Non-cash Assets from Start-up | $760,000 |
| Cash Requirements from Start-up | $80,000 |
| Additional Cash Raised | $0 |
| Cash Balance on Starting Date | $80,000 |
| Total Assets | $840,000 |
| Liabilities and Capital | |
| Liabilities | |
| Current Borrowing | $20,000 |
| Long-term Liabilities | $0 |
| Accounts Payable (Outstanding Bills) | $0 |
| Other Current Liabilities (interest-free) | $0 |
| Total Liabilities | $20,000 |
| Capital | |
| Planned Investment | |
| Investor 1 | $650,000 |
| Investor 2 | $76,700 |
| Investor 3 | $35,000 |
| Investor 4 | $100,000 |
| Additional Investment Requirement | $0 |
| Total Planned Investment | $861,700 |
| Loss at Start-up (Start-up Expenses) | ($41,700) |
| Total Capital | $820,000 |
| Total Capital and Liabilities | $840,000 |
| Total Funding | $881,700 |
| Start-up | |
| Requirements | |
| Start-up Expenses | |
| Legal | $1,000 |
| Stationery etc. | $2,000 |
| Brochures | $2,000 |
| Insurance | $700 |
| Rent | $6,000 |
| Research and Development | $20,000 |
| Expensed Equipment | $10,000 |
| Total Start-up Expenses | $41,700 |
| Start-up Assets | |
| Cash Required | $80,000 |
| Start-up Inventory | $10,000 |
| Other Current Assets | $0 |
| Long-term Assets | $750,000 |
| Total Assets | $840,000 |
| Total Requirements | $881,700 |
2.2 Company Ownership
Sedibeng Breweries is a Private Limited company incorporated at the Registrar of Companies through the foresight and vision of Mr. X and Mr. Y. Its fiscal year is the calendar year. Though it has only been in existence for seven months it realizes the potential market and opportunity for growth given implementation of the appropriate strategies, aided by the necessary finances.
2.3 Company Locations and Facilities
At present the company plants and offices are located in the growing industrial center of Selebi Phikwe, Kasane and Palaype with intentions of establishing an additional plant in Maun or Francistown, largely depending on the dictates of the market and the obtaining of a lease. Our current facilities provide offices, plants and machinery, office equipment and so on.
2.4 Company Values
Sedibeng Breweries is committed towards an open governance system whereby its activities are managed and undertaken ethically, transparently, and in the interests of all concerned stakeholders.
This shall be undertaken through implementation of the following company values:
- We intend to conduct our business ethically and transparently, respecting all applicable laws.
- We intend to be a responsible corporate citizen fulfilling our obligations as an integral member of society. Hence our business decisions shall give appropriate weight and consideration to social and environmental impacts.
- We intend to provide products of uncompromising quality to meet the needs of our customers.
- We intend to seek mutually beneficial and enduring relationships in all the commitments that we make, ensuring that they are straightforward and honest. Hence our communication shall be open and accurate, internally and externally.
- We intend to optimize the creation of wealth to provide fair reward and recognition for the contributions of our stakeholders.
- Ultimately we intend to uphold all the above company values, promoting our employees and respective third parties engaged by us to do likewise.
Through promotion and implementation of the above stated company values we believe that we will be able to attain our corporate and stakeholders’ goals and objectives for the benefit of all concerned, in particular the communities in which we will operate.
Products
Sedibeng Breweries produces and markets several products. There are three main products currently in its production line. These are:
- X Beer
- Y Beer
- Z Beer (Note: Z comes in different flavors):
- B
- P
- C
- S
All products are periodically taken for testing to the National Food Laboratory for quality checks so as to ensure that they conform to required quality standards.
3.1 Product Description
Sedibeng Breweries produces products of high quality and impeccable taste. The company currently produces three main lines of products, namely X beer, Y beer and Z beer. All three have unique properties that will enable them to excel on the market. We will also be watching for technological developments in South Africa and overseas, allowing us to be first on the market and produce high-quality products through cost effective means. In addition the company will select suitable products for production under license.
Our current product listing is as follows:
- X Beer
Although similar in appearance to the only other product available in the market, our beer has the superior flavour and texture, smooth, with no rough solids. This stems from (discussion removed for confidentiality). - Y Beer
This refreshing drink has the unique feature that it can be enjoyed both as an alcoholic or non-alcoholic drink, depending on the fermentation period after production. If consumed fresh, that is, within the first week of production, it contains only traces of alcohol, typically even less than that found in medication (discussion removed for confidentiality). - Z Beer
This traditional food product is widely consumed as a substitute for regular meals and energy booster, whenever available. Up to now it has only been available in two sources, namely home prepared or more commonly bought from a shop having a fridge to keep the product refrigerated.
This denies the people in rural area access to these delicious and nutritious foodstuffs. In fact, it is so wholesome that a growing child is able survive on one litter of this per day, as it contains protein, starches, calcium, vitamins and other essential trace elements. We have the ability to produce a long life Z that needs NO refrigeration, which can be sold from the shelf in the same fashion as Ultra Mel and similar products. This means that it can be bought by consumers who might not always have access to cooling or refrigeration facilities, to be consumed later, as a food whilst way from home, or as an emergency food supply. This is available in several flavors, such as x, y, w, t, s and other xx flavors that the market might want. It is also a good product to use in school feeding schemes and similar projects.
3.2 Competitive Comparison
Identifying competition in terms of companies that fill the same needs that we do, our competitors are few in our main product lines, though dominant in the market. Hence there will be a need to strongly differentiate ourselves from these other businesses. However on a broader scale our competition comes in several forms:
- The most significant competition is that of XX Breweries, which is arguably the market leader. Having been on the market for a relatively long period of time added to the fact that they are backed by Y Breweries’ financial, technological and human resources acumen. They have a wide and established distribution network that they utilize to their advantage. Our key advantage in competition with XX Breweries is that we are accessible in extremely remote areas. We intend to vigorously undertake new channel and distribution development in addition to deploying aggressive marketing strategies. Also, strategic alliances shall assist in our attainment of goals and objectives.
- Other manufacturers of traditional brews including homes and local bars will also constitute our competitors. They often have access to the local and remote areas and knowledge of these areas. However the product is not constantly of high standard, which we shall fully exploit.
- On a larger scale manufacturers of other beverages including soft drinks and coffees also constitute competition, but of a generic nature, as people have to choose between them as refreshments. These products being marketed in supermarkets are often advertised on an extensive basis. To this end we intend to implement a strategy that will integrate the various promotional elements or tools such that our products are well known and appreciated on the market.
3.3 Macro-environment
Over the last few months abnormal weather has affected many parts of Southern Africa, including Botswana, during the key summer season. It has been extraordinarily severe with heavy rainfall, flooding and there definitely promises to be low temperatures, particularly in the winter season. This is likely to have an adverse effect on our initial financial performance, though marginal as consumption levels may decrease slightly.
At a large scale, market research demonstrates that the brewing industry market is growing and changing. Generally there is a trend toward more appealing and attractive brews as potential customers either are moving to the urban areas as a result of urbanization or are satisfied with an existing brew in their area. Research indicates that those in the rural areas are often satisfied with the existing brew due to lack of access to other higher-quality brews, whilst the new generation of executives being more educated and aware of the global environment wants to be seen drinking something attractive and recognized by others–status recognition. In addition this same market is not only more image conscious but appreciative of a quality brew as it is more selective. Therefore with the emergence of this generation of individuals, the appreciation of quality brews and packaging, dictates that our product lines will be popular.
Private sector development has been recognized as a vital ingredient in creating employment and training opportunities, and realizing the national goal of sustainable economic diversification. In addition to the country increasingly becoming a tourist destination, we foresee the demand for our products especially in the resorts and lodges where it will be promoted. Through undertaking of our professional business activities we foresee that it should not be too difficult to gain market acceptance provided we deliver the final product on time, of good quality, and at competitive prices.
3.4 Technology
Sedibeng Breweries will strive to maintain the latest and most efficient assembly technology so as to ensure quality-brewed beverages, and maintain low production costs ultimately benefiting the consumer. Keeping abreast with technological developments will ensure we gain and maintain a competitive advantage utilizing the latest production techniques.
3.5 Future Products
In putting the company together we have attempted to offer enough products to allow us to always be in demand by our customers and clients. The most important factor in developing future products is market need. Our understanding of the needs of our target market segments shall be one of our competitive advantages. It is critical to our effort to develop the right new products. We also intend to have what we call a “core product engine” that will be the foundation of future products. This shall be established in time as we determine our core product. In the future, Sedibeng Breweries will broaden its coverage by expanding into additional markets (i.e., the whole of Southern Africa) and additional product areas. In doing so we will strive to ensure that it is compatible with the existing products and assembly technology.
3.6 Fulfillment
- The key fulfillment and delivery will be provided by the principals and values of the business. The real core value will be the provision of a thirst quenching refreshing brew, provided by a combination of quality ingredients, good production techniques, hard work, and education (in that order). Hence we intend to ensure that the products we produce are always of high quality and standards, and available to the relevant target market.
- We will turn to reliable farmers, suppliers and distributors who will assist in ensuring that the products are delivered timely and are of the highest quality. We will also rely on these stakeholders for relevant information on the market situation (trends, consumer tastes, feelings and comments amongst other things).
SWOT Analysis
We are in a highly lucrative market in a rapidly growing economy. We foresee our strengths as the ability to respond quickly to what the market dictates and to provide quality brew in a growing market. In addition, through aggressive marketing and quality management we intend to become a well-respected and known entity in our respective industry. Our key personnel have a wide and thorough knowledge of the local manufacturing market and expertise, which will go towards penetrating the market. However we acknowledge our weakness of a medium-sized company without a lot of experience, and the threat of new competition taking aim at our niche. Below are the summarized strengths, weaknesses, opportunities and threats.
4.1 Strengths
- Strategic market segmentation and implementation strategies.
- Diversified market segments: ensuring the lack of dependency on one particular market.
- Combination of skills in directorship. The directors intend to jointly develop business strategy and long-term plans, having wide experience in product and business know-how.
- Establishment and maintenance of strong capital base.
-
An aggressive and focused marketing campaign with clear goals and strategies.
4.2 Weaknesses
- Lack of a reputation in comparison to our competitors.
-
The introduction of new organizational practices and personnel who have not previously worked together presents a challenge to the company.
- A limited financial base compared to the major players in the industry.
- Lack of clear-cut channels of distribution.
-
Establishment on the Internet will produce technological challenges.
4.3 Opportunities
- Specific niche: Appreciation for high-quality brew, enjoyment, and refreshment (and integration therein).
- The new generation of individuals and families has a far greater appreciation of attractive packaging (image conscious).
-
Current drive by government and specialized institutions such as the Botswana Export Development and Investment Authority towards export of locally manufactured products.
-
Internet marketing and sales–though still in its infancy.
-
Increasing number of foreign firms, especially from South Africa looking at penetrating the market.
4.4 Threats
The present growth in the market may result in market saturation, through competition. This competition could emerge from a variety of given sources including:
-
Established mass-market companies’ development of new lines and vertically integrating so as to be totally in control of supplies and products being sold on the respective markets.
- New marketing strategies and tactics by established products and companies.
- Existing competition.
- Other start-up companies generated by healthy economic growth nationwide.
-
Intolerable price increases by foreign suppliers may occur.
Market Analysis Summary
Today we are experiencing rapid growth in the economy of unsurpassed nature. This has been brought about by (amongst other things) the relaxation of foreign exchange policies and macro economic policies geared towards attracting foreign investors into the country. The fiscal and monetary policies of the government geared towards maintaining growth with social justice have largely contributed towards this, evidenced by our economy averaging a growth rate of 7% since 1990–very high by international standards.
The current drive and emphasis by the government on diversification of the industrial base away from the minerals sector presents an opportunity for Sedibeng Breweries to make a valuable contribution towards achieving this goal. This will result in implementation of modern production techniques and transfer of knowledge. Having undertaken a thorough and comprehensive research of the market we realized that there was a need for a manufacturer that focuses on producing affordable thirst quenching brew tailored to satisfying client’s needs. Though there are breweries currently on the market, some of whom have been in existence for a relatively long period of time, we believe that there is a market need for one (ourselves in this instance) that particularly focuses on the low to medium earning individuals. We intend to provide products of extremely high quality–something that cannot be over-emphasized in the international arena with the current drive towards globalization. The marketing mix of the products has been carefully and strategically put together to position them in the market.
Aware of the fact that we will be operating in a predominantly monopolistic market structure we intend to ensure that our marketing strategies are considerate of the importance of the fit between our products capabilities and benefits, and the target market, so as to develop a strong sustainable competitive position in the market. As a result we intend to implement a niche marketing strategy, focusing on certain target markets, particularly in view of XX Breweries dominance on the market. Our initial overall target market share shall be 6% of the local market. This share will vary with the actual products, with ginger beer having a larger share than traditional beer due to its uniqueness.
We appreciate that entering such a market is not a bed of roses, particularly as it is monopolistic. Hence we intend to implement an aggressive marketing strategy, well supported by the other business functions. The above prognosis influenced our decision to enter the brewing industry.
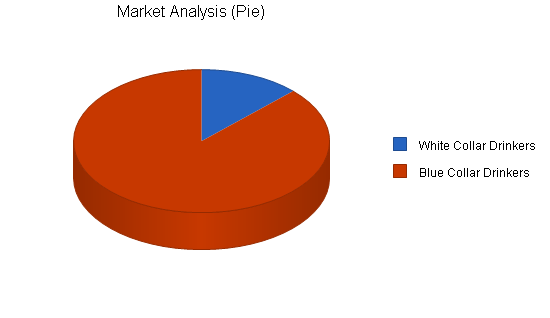
5.1 Market Segmentation
Sedibeng Breweries will be focusing on the corporate and working class who appreciate good quality traditional beer. The working class will range from the miners who constitute a large portion of the market, to administrative personnel appreciative of good quality traditional beer. The corporate or managerial segment will constitute those managers who though aware of their image and reputation, want to put aside their ties and jackets after hours and/or on weekends to drink good traditional beer, easily accessible in the urban areas.
Our most important group of potential customers are those in the rural areas who often converge after hours to socialize and update one another on local news. These are potential customers who want to have an enjoyable time whilst drinking a good refreshing beverage. They do not want to waste their time making their own brew, but appreciate a good quality brew at a reasonable price.
We also intend to appeal to the foreign and local tourists who would be looking at experiencing traditional foods and drinks, a change from the usual beverages they often have.
| Market Analysis | |||||||
| Year 1 | Year 2 | Year 3 | Year 4 | Year 5 | |||
| Potential Customers | Growth | CAGR | |||||
| White Collar Drinkers | 4% | 100,147 | 104,153 | 108,319 | 112,652 | 117,158 | 4.00% |
| Blue Collar Drinkers | 2% | 693,675 | 709,630 | 725,951 | 742,648 | 759,729 | 2.30% |
| Total | 2.52% | 793,822 | 813,783 | 834,270 | 855,300 | 876,887 | 2.52% |
5.2 Target Market Segment Strategy
Our marketing strategy will be based mainly on making the right product available to the right target customer. We will ensure that our products’ prices take into consideration peoples’ budgets, and that these people appreciate the product and know that it exists, including where to find it. The marketing will convey the sense of quality in every picture, every promotion, and every publication. There is already a sense of segment strategy in the way we define our target market. We are choosing to compete in areas that lend themselves to local competition, service and channel areas that match our strengths, and avoid our weaknesses.
Our strategy calls for the development of relationships with suppliers, distributors and retailers to support our business. Regular visits will be undertaken to these areas so as to ensure that we are meeting their expectations.
5.2.1 Market Trends
Our target markets are increasingly growing towards recognizing the difference between poor quality brews and those of high quality. This development is an important trend for us as it represents our target market. We now are having an increasing number of people who appreciate the traditional brews whilst living in the urban areas. With this in mind we intend to ensure that our packaging is respectable and attractive.
Today’s extremely stressful work environment dictates that individuals consume healthy drinks especially in the summer season, this presents an opportunity that we may exploit, marketing the health aspect of our beverages.
5.2.2 Market Growth
Import statistics provide a reliable guide as to the size of the brewing industry. According to the Trade Department, the market has been growing at a steady rate of 7% per annum although it is projected to increase slightly in 1999 and 2000. According to the most recent Trade Department import statistics for beer and wine, total beer and wine imports stood at 10,421,968 liters ($14,473,000) in 1998 whilst total exports stood at 864,668 liters ($281,363) in the same year. This brought about a total market size estimated at just over 11,286,636 liters in 1998. Specifically, imports for traditional beer stood at 310,627 liters in 1998 which represented an increase of approximately 32.56% from the previous year (1997). In 1997 these imports had risen by approximately 66.14%.
5.2.3 Market Needs
Sedibeng Breweries will set out to provide good quality products that will help instill a jovial environment. Sedibeng Breweries intends to provide the customer with more than a drink to quench one’s thirst. We intend to provide a quality brew that not only quenches one’s thirst but enables one to enjoy themselves and be proud of it. The quality of raw materials and assembly technology evident in our products will serve to enhance the appearance of our customers, in turn adding to their status. The large market is due to the fact that opaque beer is traditional beer for most Botswana. It is consumed for social, ritual and ceremonial purposes and hence appeals to a vast majority of the rural population in particular.
5.3 Industry Analysis
Industry analysis information is presented in the following subtopics.
5.3.1 Competition and Buying Patterns
The key element in purchase decisions made at the Sedibeng Breweries customer level is the availability of an affordable, thirst-quenching product of good quality. The most important factor in this market is the distribution network. This is particularly so considering the good distribution network that XX Breweries Limited has in place enabling them to produce products that are constantly in demand throughout the country.
5.3.2 Main Competitors
Being in a predominantly monopolistic market structure, competition in the brewery manufacturing market as a whole is not that intense (in terms of numbers) at the current time due to the dominance of XX Breweries Limited, which has been on the market for a relatively long period of time. Cognisance should also be taken of home brewers who represent competition on our intended market. However upon closer research we identified several niches in the market that we may exploit, not wanting to confront XX Breweries one-on-one.
In general, our competition will be stiff, as we intend to penetrate the low to medium earning customer. At the same time we shall be differentiating ourselves from XX Breweries. We intend to market ourselves in such a way that with time competitor customers will choose our products over competitors’ on the basis of our higher quality, thirst-quenching brews. We shall now provide a more thorough outline of our main competitors in the same strategic group as ourselves, including their strengths and weaknesses.
XX Breweries Limited and ZZ Breweries – T Brewery Holdings
Arguably the largest and most reputable manufacturer, supplier and marketer of alcoholic and non-alcoholic beverages in the country, XX Breweries has been on the market for a considerable period of time now. Part of the large and extremely reputable conglomerate, YY Breweries International, XX Breweries is currently the dominant domestic producers of beer, sorghum and Coca-Cola products in the country, with an overall market share of more than 95%. XX Breweries is able to take advantage of the financial, managerial and technical clout that it has through YY Breweries International. Due to its size it enjoys an economy of scale and thus the competitive advantage of being able to offer low priced beverages in large quantities to its target markets. YY Breweries International Africa enjoys strong cash flows in the form of royalty payments, management fees and dividends from its Botswana operations due to its dominance.
One of XX Breweries’ main products is S traditional beer, which will be one of our main competitor products. S is currently mass marketed in the whole of Botswana and is popular amongst the rural and town folk. It is also present in the regional countries, including Zimbabwe, Zambia and Mozambique, with current intentions of going beyond these borders. This is mainly because it is in its maturity stage and these efforts of going international are meant to extend its product life. However a frailty of S is that the product does not maintain freshness for a long period, which is debilitating when its intentions are export. Hence Sedibeng intends to take advantage of this weakness.
| Establishment | Location | Employment Size |
| XX Breweries | Gaborone | 100+ Employees |
| XX Breweries | Lobatse | 50-99 Employees |
| XX Breweries | Francistown | 100+ Employees |
| XX Breweries | Gaborone | 100+ Employees |
XX Breweries In Botswana
Recent financial results from T Brewery Holdings indicate that the organization as a whole has continued to perform exceptionally well on the back of a buoyant Botswana economy. Turnover grew by 42% whilst operating profit is up 60% from $21.5 million to $34.5 million. For the 12 months to 31 March 2000, volume growth exceeded non-mining GDP growth by more than 2%, resulting in turnover growth of 12%. According to the audited results, higher volumes and turnover coupled with greater productivity and stringent cost controls translated into excellent earnings growth. With this in mind we strongly believe that there is an extremely lucrative market we may exploit.
Strategy and Implementation Summary
Our marketing strategy emphasizes focus. This will be the key. We are a relatively new company and hence must focus on certain kinds of products with certain kinds of consumers. Initially Sedibeng Breweries will focus on the local market and in the remote and previously inaccessible areas where there is a large market for our products. Hence the form of growth that shall be initially pursued will be that of organic growth mainly due to limited resources and the need to instill confidence in our products. The target customers will include key decision-makers in the retail and supermarket chains who often order or recommend on behalf of the whole organization, the aim being to obtain an initial order and fully satisfy the customer from then on.
- We are currently building image and awareness through consistency and distinctiveness in our product provision.
- We intend to focus on delivering quality products that in turn produce good referrals, which can then generate revenue. We intend to always have a relatively heavy personal selling component to our marketing strategy as previously discussed. Hence we intend to always be active in personal relationships with clients and strategic allies keeping abreast of their needs and wants.
- We are focusing advertising on several key media.
We intend to achieve growth by creating a more enthusiastic customer culture than that of our competitors. All criteria from price competitiveness to staff attitudes are to be initially measured six-monthly, and then on a more regular basis as time goes on. The results will go down to depot level and be compared with the overall target. This form of consistent measurement of strategic goals will ensure that the organization remains focused on its goals and objectives, making any necessary adjustments where need be.
6.1 Value Proposition
Our value proposition is offering our customers refreshness and enjoyment at reasonable prices ensuring peace of both body and mind. Hence we intend to:
- Market the benefit, not the product.
- Ensure customer satisfaction.
- Develop long relationships.
- Market the company.
This value proposition shall be communicated through advertisements, personal selling, sales literature and catalogues, and referrals that emphasize how the company is able to provide refreshment, enjoyment and fulfillment to the customers.
6.2 Competitive Edge
Our competitive edge will be our dominance of access to previously remote areas, customer orientation and traditional high-quality brew through stringent quality control. Although XX Breweries dominates the local market, it does not penetrate the remote areas as much as we intend to.
Though we shall be serving different market segments we intend to focus on (discussion removed for confidentiality).
6.3 Sales Strategy
We intend to focus on improving our implementation, by working on key objectives and better coordination of marketing efforts. For the short term at least, the selling process will depend on personal selling and advertising to lure and inform potential clients about the products we offer and the benefits of consuming our products. Our marketing does not intend to affect the perception of need as much as knowledge and awareness of the product categories.
6.3.1 Sales Forecast
The sales forecast monthly summary is included below. The annual sales projections are included later in the plan. It should be noted that as we become established and known on the market we project sales to increase at a faster rate than the initial year.

| Sales Forecast | |||
| Year 1 | Year 2 | Year 3 | |
| Sales | |||
| X Beer | $659,712 | $725,683 | $812,765 |
| Y Beer | $527,769 | $580,546 | $650,211 |
| Z Beer | $278,545 | $306,400 | $343,167 |
| Total Sales | $1,466,026 | $1,612,629 | $1,806,144 |
| Direct Cost of Sales | Year 1 | Year 2 | Year 3 |
| X Beer | $369,439 | $406,383 | $455,149 |
| Y Beer | $295,551 | $325,106 | $364,118 |
| Z Beer | $155,985 | $171,584 | $192,174 |
| Subtotal Direct Cost of Sales | $820,975 | $903,072 | $1,011,441 |
6.4 Marketing Strategy
One core element of our marketing strategy will be that of differentiation from our competitors. In terms of promotion, we intend to sell our company as a differentiated strategic ally, not just our products. In price, we intend to offer extremely reasonable prices in comparison to the competition and we need to be able to sustain that. Market penetration through lower prices shall be undertaken where need be, while premium pricing will be the case of the upper-end of the market.
6.4.1 Service Provision
The service aspect of Sedibeng Breweries marketing mix shall constitute an important element in delivering total quality. This is due to the high degree of exposure our competitors already have. As such we intend our customer service to be key to the retention of customers. We shall follow-up with our clients on a regular basis so as to ensure they are satisfied with our products and delivery times. This is mainly because we intend our customers not to be one-time buyers but regular order seekers. The establishment of a rapport and understanding between our customers and ourselves is going to be an ongoing processes.
We intend to implement database marketing whereby we shall be targeting customers based on their previous purchases, in terms of size, frequency and actual products, so as to forecast their demands and establish long beneficial relationships. Customer service shall be enhanced through infrastructure support in the form of merchandising and credit facilities, and alternative distribution facilities where possible and viable.
6.4.2 Pricing Strategy
Initially our prices will not be under our control but dictated by the market conditions prevailing at the particular time. This is particularly so in the case of products which are also produced by our competitors, as they are often representing a scale for consumers. However we realize that we must charge appropriately for the quality and work we shall be providing, in addition to the distribution of the products. Hence we intend the price will accommodate the mark ups prevailing in the industry, as well as our own costs. To be competitive in the market we intend to offer discounts to customers making bulk orders, which are in competition with the industry. This will also assist in the establishment of customer loyalty. Hence our prices shall be as follows: (discussion removed for confidentiality).
We intend our income structure to match our cost structure, so as to ensure that the salaries we pay to assure good workmanship is balanced by the price we charge. We will make sure that we charge for the product, workmanship and delivery with our aim being to achieve a gross profit margin of at least 30% in our initial years of operation. All in all we intend our prices to be extremely competitive on the market.
6.4.3 Promotion Strategy
Our promotion strategy will be based primarily on informing potential customers of our existence and making the right information available to our target customer. Since we shall be targeting different segments, the promotional tools and messages may vary slightly to match the intended market. However in all cases the marketing will convey the sense of quality, refreshness and health in every picture, every promotion and every publication. Promotional campaigns will seek to promote the ‘sharing aspect’ of the beer, customers drinking these products in groups. Our promotional activities shall be focused towards driving the organization’s overall strategy relentlessly, developing internal consistency and prepare it to confront any radical changes that may arise. In such a market we cannot afford to appear in, or produce, second-rate material that make our products look less than they are. We intend to leverage our presence using quality brochures and other sales literature, including promotional material such as pens, complimentary slips and stickers. Due to the fact that our products are in the introductory phase on the market, promotional expenses are high in order to generate customer attention and knowledge of our products existence.
We intend to spread the word about our business through the following:
Advertising
In view of the fact that we are entering a market largely dominated by XX Breweries Limited which has an approximate market share of approximately 95% (as previously discussed) we intend to undertake extensive advertising of our products in addition to our brand name–company name. This is so as to instill awareness and knowledge of our existence in the market place, which hopefully shall convert into market share. Hence the need to ensure that our products are constantly available to our target market, and of consistent high quality. Whilst we are committed to providing products of uncompromising quality to meet the needs and expectations, the company believes its products should be advertised and promoted in an honest and ethical manner that respects the values of our consumers’ societies. Examples include the Boccim Business Directory which will require us being members of Boccim, Botswana–a review of commerce and industry, Contacts Botswana, and other telephone directories. A constant look out will also be made of any special editions in the local newspapers, which may provide an opportunity to advertise.
Events
These are increasingly becoming important as more firms establish in the country and hence the need to be known. The organization aims to participate in trade shows and quality taste tests. Not only will these increase awareness of the products, but if a particular product were to gain recognition, for example through being chosen #1 at a taste test, the organization will be able to take advantage of this in all its promotional campaigns, adding leverage to its reputation and image. Undoubtedly this would add confidence and pride in our staff complement as their hard work would be recognized often at the highest levels. Communicating such achievements often gives customers a feeling that they can rely on the product, and this builds strong customer loyalty. An example of a trade show we intend to participate at is BITEC. The aim of this exhibition is to provide a conducive environment for companies to display their products in a specialized exhibition. The exchange of technologies, ideas, and contacts will serve as a fertile ground for the blooming of healthy trade relationships and partnerships.
We also intend to participate at the Botswana International Trade Fair (BITF) in August so as to expose our business to potential customers and suppliers. Such fairs serve as important eye openers for both potential customers and ourselves. With time it shall be necessary for us to participate in regional trade shows and fairs such as the South African Exhibition Show so as to gain awareness and ultimately orders from outside the country.
Public Relations
Recognizing that we are relatively new on the market there will be a need to organize an event, of grandeur nature, introducing ourselves onto the market. At this we intend to invite potential customers, senior officials, including the Minister of Industry and Commerce, and other stakeholders so as to penetrate the market. In collaboration with this we also intend to place news stories and features in magazines and newspapers to keep stakeholders updated on the latest developments and to increase awareness. We also plan to have a major festival initially in Selebi Phikwe, appropriately named, that maintains and promotes Botswana culture. This will assist in the recognition and appreciation of our company in the surrounding community especially. Our efforts on community service will show that the company has its community at heart, contributing towards the establishment of a good and reputable image. Homes for the under privileged will be also be built in the medium, to long term as we plough back into the society we operate in. In addition we intend to pursue educational sponsorship for the less advantaged but promising young individuals in the community. This will constitute some of our corporate social responsibility details of which are provided in the respective section.
We also intend to experiment with a road show in the various often-neglected remote areas giving out caps, bags, and other such prizes to individuals who answer questions correctly. This will also enable our business name and products to be better known by the respective communities. However we are extremely confident that these road shows if well planned will be a success as they encourage community participation. Brewery tours shall also be arranged with interested stakeholders including school children and college students. This is so as to increase awareness of our facilities and products and also showing confidence in our production process and standards. Hopefully visitors will leave impressed and confident in our products, adding to the possibility of positive referrals. These same tours will also be arranged with prospective clients/order-takers.
Still in the infancy idea stage we have in mind the hosting of a ‘fest’ whereby guzzlers of our brews as well as first-timers are encouraged to drink as much as possible whilst enjoying themselves. This is likely to be held in the hottest month of the year (October) when people are often extremely thirsty. Hence the name ‘October fest’ might be appropriate. Proceeds of such festivities are to be donated to charities.
Personal Selling
This shall be undertaken in the form of sales calls whereby a sales person will go out to potential customers and distributors informing them what products we are able to offer them. In addition the sales person will listen to client’s needs at close hand, so as to ensure that the product is delivered timely and that it is the right product as demanded by the surrounding community. Close analysis shall also be undertaken of the consumption patterns of the respective communities, that is whether they prefer larger or smaller containers. This will ensure that our products are customized as much as possible to the surrounding community’s needs and wants. In cases where there is the opportunity of obtaining a large order it may be necessary for the top management to go out personally, especially considering the fact that we are still a relatively new firm in the market.
Direct Marketing
This will be used, but only to a limited extent, in the form of telemarketing and informing potential customers and obtaining referrals where possible. In the case of telemarketing it will involve our targeting potential customers/distributors of our products and informing them of our existence and the products we offer. We may then arrange for an appointment with the respective decision-maker/order-maker, with the intention being to lure them into ordering one or more of our product lines.
Internet Marketing
The increasing growth of the Internet as an information source provides an opportunity that we may exploit. This is particularly so in view of the increasing investment and global trade amongst countries, as both large and small organizations look at obtaining the best deal possible. More often than not these organizations will seek out potential clients over the Internet due to the cost of transport and accommodation, apart from the obvious time factor, which is increasingly becoming of importance in view of the dynamic environment. However this will require adequate planning and research so as to establish a professionally done website. This will mainly serve foreign customers and other stakeholders including potential investors.
In all the above we intend to communicate our ability to manufacture good quality brews that will satisfy the customers needs. Hence our messages will influence the buying decision of prospective customers and distributors by emphasizing our unique selling proposition, and persuade prospective buyers that we are different from our competitors. All the above promotional tools shall be well integrated and utilized in tandem so as to maximize their effect.
6.4.4 Distribution Strategy
We believe that through our obsession for improvement, and commitment to a leadership position in our respective markets, we can overcome the traditionally binding constraints of resource base, firm size and narrow conceptualization of our business domain. This shall be undertaken through coordination and logical integration of our distribution operations. We aim to reduce cycle time for key processes, eliminate rework and waste, and optimize our human resources utilization. To attain low lead-times we intend to (discussion removed for confidentiality).
Trade Channels:
-
Wholesale Distribution Channels (discussion removed for confidentiality).
-
Retail Distribution Channels (discussion removed for confidentiality).
We intend to ensure that our breweries are located close to our major distribution centers not only to minimize costs but also to enable our products to be easily available, in the best condition, in the different markets nationwide. By engaging and establishing good relationships with shebeen owners we intend our products to be readily available to our target market. In terms of actual delivery for every vehicle the daily fuel used, kilometers driven, repairs and maintenance costs must be recorded and compared with the set standard. (Discussion removed for confidentiality.)
6.4.5 Product Marketing
Our product marketing will emphasize the benefits of consuming our products, including refreshment and enjoyment of top-quality brews. We intend to sell the opportunity to enjoy oneself amongst friends, family and/or colleagues. This will come out in our advertising, delivery and collateral such as sales literature and business cards. Our product marketing’s most important challenge will be the problem of being accepted and appreciated on the market as a provider of quality products. Hence we intend to not only meet customers’ expectations but to exceed them, initially targeting a market share of 6%.
We intend to focus on the individual or group who want to enjoy themselves through the consumption and sharing of refreshing healthy beverages. However, not wanting to limit our horizons in the initial period, we intend to be continually looking out for opportunities that we may exploit. In all cases we intend to provide a thorough understanding and appreciation of the products to the customer and the benefits of consuming them.
6.4.6 Product Packaging
Our product packaging shall be of utmost importance, as it will definitely influence our potential customers on whether to try out our products or not. As such we shall ensure that it is not only attractive to consumers but also hygienic. As time progresses we intend to have packaging that enables the container to be used for other purposes after beer consumption, for example keeping water and being able to be deposited to retailers, the former of which we have identified as already being done. In the medium to long term we intend our product packaging to also be recyclable and hence more environmentally friendly–a continuous improvement process. Continuous improvement on packaging will also be undertaken so as to maintain, if not improve product appeal.
Currently the products are served in X ml and Y ml packs. However depending on the dictates of the market, there might be need to introduce new product packs. Hence we intend to ensure that we are flexible if such changes are to occur. A specific example is the X ml T beer pack, which is not being produced by any of the other breweries at the moment, representing an opportunity to be realized.
6.5 Corporate Social Responsibility
Sedibeng Breweries intends to be involved in a wide range of social responsibility engagement programs to invest back into the community in which we operate. Through our social responsibility program we can assist in improving peoples lives. If we contribute to development in a sustainable way, we need to support projects that communities bring to us, rather than strictly creating our own solutions for our communities. This is because if we impose our solution and drive a project it is an artificial response, and the risk is that the project will then always ‘belong’ to us. Whenever the project comes up against a new challenge, we will be expected to fix it, and will be forced to stay in a situation where we have to look after the same few projects forever. Rather we intend to fund several projects that belong to, and will be driven by, the community and become sustainable. However, before we commit ourselves to projects we intend to ensure that skills will be transferred, communities are involved and the projects will be able to become self-sustaining. We know that we cannot address all the development needs of our society. Where we can, we assist and sometimes may form partnerships so as to increase capacity.
We intend to be involved in the following activities:
- Community (discussion removed for confidentiality).
- Education (discussion removed for confidentiality).
- Health (discussion removed for confidentiality).
- Environment (discussion removed for confidentiality).
-
Arts and Culture (discussion removed for confidentiality).
Production Summary
Our production system shall strive to attain service excellence in addition to manufacturing safe, quality products. This shall be undertaken through the engagement of modern production techniques using up-to-date assembly technology. This will also result in low production costs being attained by the company. We also intend to ensure that the suppliers we engage are committed and reliable so as not to let down the final consumer in terms of the quality of the product and time of delivery.
In order to improve productivity in our plants we intend to reduce waste and duplication in our breweries by streamlining administrative functions and promoting and instilling a business culture that focuses on the teamwork rather than individual productivity. By the undertaking the above we will optimize our productivity given our available resources.
7.1 Suppliers
Currently the company obtains the vast majority of its raw materials from South African suppliers. However as we are committed to fair terms of trade and promotion of local business we intend to engage local suppliers. Hence raw materials, including x and y, may be sourced from local communal and commercial farmers avoiding intermediaries so as to minimize costs, ultimately benefiting the final consumer. The major advantages of doing so being higher margins, faster payments and lower risks of payment default. Through the use of economies of scale we aim to maintain low input and production costs. This may be undertaken through (discussion removed for confidentiality).
Hence we intend to establish good rapport with all our suppliers and hence long mutually beneficial business relationships. This shall be undertaken through working closely with suppliers to ensure uninterrupted deliveries.
7.2 Receiving
Recognizing that the receiving of our raw materials is an essential element in our entire business, we intend to ensure that it is done by responsible persons who will be present during off loading to check the quantity and condition of the consignment. During the actual off loading the receiving bay personnel will mass check on at least X% of the consignment. Non-confirming raw materials in terms of quality will only be approved with the consent of the managing director who would have undertaken further analysis of it.
7.3 Storage
It shall be the policy of the company to ensure that all raw materials are stored in a secure, clean and pest free manner. Stock takes and reconciliations shall be undertaken on a regular basis, initially done at least once a week. The stock principle of First In First Out (FIFO) shall be implemented. Whenever stock is taken out it shall be recorded on a separate stock or bin card, with reconciliations of raw materials issued to the brewery, issued to production, losses, opening and closing stock taken. Should any deviations arise these must be explained.
7.4 By-Products
Sedibeng Breweries intends to utilize every resource it has to the fullest possible extent. We realize that there shall be a lot of by-products that will be produced from our production of the main product lines. However not wanting to pollute the environment, and our community at large, we plan to utilize by-products whenever possible. This will ensure that our resources are fully utilized.
Management Summary
Sedibeng Breweries shall evaluate the jobs it provides, paying competitive remuneration packages against market benchmarks to employees for their agreed and set out tasks. Consonant with its efforts to create added value by employees, Sedibeng Breweries seeks to negotiate the provision of incentive pay delivery mechanisms against achievement of agreed targets relating to accomplishment in the areas of productivity enhancement, savings and other specific successes, that is, the implementation of an effective performance management system.
Hence our human resources strategy will revolve around:
- Communicating openly and transparently; addressing strong and trusted:
- Internal communication.
- External communication.
- Stakeholder inclusivity.
- Responding and promoting human rights issues, such as equity in the workplace and in community relations.
- Adoption of a good remuneration policy aimed at developing our people through employee benefits, training and group initiatives.
- Maintaining preventative health and safety structures for employees and support for surrounding communities.
8.1 Management Team
The management team, mainly comprising of the shareholders, has wide expertise and broad knowledge of the products and markets, which if well planned for, will enable the business to realize its goals and objectives. Daily management will consist of Mr. B in the role of technical and operations, and Mr. G in dealing with government, corporate bodies, and public relations.
Management style will reflect the participation of the shareholders. The company intends to respect its community and treat all employees well. We will develop and nurture the company as community. We do not intend to be overly hierarchical. Management’s ongoing initiatives to drive sales, market share and productivity will provide additional impetus.
8.2 Personnel Plan
We intend to compensate our personnel well, to retain their invaluable expertise and to ensure job satisfaction and enrichment through delegation of authority. Our compensation will include health care, generous profit sharing, plus a minimum of three weeks vacation. As an equal opportunity employer, we respect the diversity and human rights of our people, and strive to achieve optimal productivity, while realizing the full potential of each employee. Awards will be given out to outstanding individuals, groups and plants for hard work and production so as to instill a sense of fun into the work and promote the maintenance of high standards. Sedibeng Breweries recognizes that our employees contribute fundamentally to the company’s long-term prosperity. We intend to enhance our capacity to attract and retain people of quality, through benefits such as housing and family education grants.
Employee health shall be of extreme importance. This is because the health of our people is an integral element of employee well-being at work and at home. Compliance with relevant legislation is a minimum target in our organization. We also intend to minimize if not totally eliminate the number of isolated incidents of intimidation in the workplace, so as to ensure that production and distribution are not materially affected and sound relationships are maintained between employee and employer and between employees as a whole.
| Personnel Plan | |||
| Year 1 | Year 2 | Year 3 | |
| President and CEO | $48,000 | $48,000 | $52,000 |
| Operations Manager | $48,000 | $48,000 | $52,000 |
| Marketing Manager | $36,000 | $36,000 | $42,000 |
| Brewmaster | $36,000 | $36,000 | $40,000 |
| Brewmaster | $36,000 | $36,000 | $40,000 |
| Office Manager | $19,200 | $19,200 | $22,000 |
| Bottler #1 | $12,000 | $12,000 | $15,000 |
| Bottler #2 | $12,000 | $12,000 | $15,000 |
| Bottler #3 | $12,000 | $12,000 | $15,000 |
| Packager #1 | $12,000 | $12,000 | $15,000 |
| Packager #2 | $12,000 | $12,000 | $15,000 |
| Packager #3 | $12,000 | $12,000 | $15,000 |
| Packager #4 | $12,000 | $12,000 | $15,000 |
| Shipper #1 | $12,000 | $12,000 | $15,000 |
| Shipper #2 | $12,000 | $12,000 | $15,000 |
| Total People | 15 | 15 | 15 |
| Total Payroll | $331,200 | $331,200 | $383,000 |
8.3 Training
In-house training shall be continuous with regular external training being undertaken particularly following any new developments in the market. This is so as to ensure that we are continuously able to anticipate our markets needs–a proactive approach, which is so essential if we are to gain and maintain a competitive advantage. Courses on brewing will be undertaken primarily in South Africa, preferably with the established and reputable firms, such as YY Breweries. This will ensure that our personnel are exposed to the latest production techniques and are able to set their standards, or benchmark, using these organizations standards. Internal training will not only include product and technical aspects, but also expand to give much greater knowledge of customers, market trends, products, new technology aids, time management amongst other such variables. We intend to conduct health education sessions for groups and individuals on health risks in the workplace, balanced with lifestyle education and employee assistance programs that incorporate rehabilitation and counseling in a range of illnesses and social or personal problems. This is of particular importance in view of the AIDS epidemic that has grappled the country and continent as a whole to unparalleled levels.
We acknowledge the fact that successful recruiting, motivation and discipline procedures are keys to the growth of the organization. Hence we intend to promote and maintain good labor relations, strong morale and high quality work per employee.
8.4 Feedback and Control
- We intend to use employee satisfaction surveys to shape the business, making sure that the employee understands the goals of the firm, is customer focused, proud of their work and work as a team. This will encourage employees to become entrepreneurial and customer responsible, in addition to unifying staff in customer focus and values.
- Important notices and developments will be continuously communicated to employers so as to keep them abreast of developments and promoting a sense of belonging and oneness in the organization.
- We will encourage our employees to put forward any suggestions they might have regarding the improvement of any of the company’s functions–an open door philosophy. Such a culture will enhance innovativeness and creativity in turn leading to job satisfaction and enrichment.
Financial Plan
We want to finance growth mainly through cash flow and equity. We recognize that this means we will have to grow more slowly than we might like.
The most important factor in our case is collection days, particularly with the bulk order customers. We can’t push our customers hard on collection days, because they are extremely sensitive and will normally judge us on our terms. Hence they tend to have a certain degree of financial authority. Therefore we need to develop a permanent system of receivables financing systems, using a well-coordinated accounting department. In turn we intend to ensure that our investors are compatible with our growth plan, management style and vision.
Compatibility in this regard means:
- Fundamental respect for giving our customers value, and for maintaining a healthy and congenial workplace.
- Respect for realistic forecasts, and conservative cash flow and financial management.
- Cash flow as first priority, growth second, profits third.
- Willingness to follow the company and contribute valuable input to strategy and implementation decisions.
9.1 Important Assumptions
The financial plan depends on important assumptions, most of which are shown in the following table as annual assumptions. The monthly assumptions are included in the appendix. From the beginning, we recognize that collection days are critical, but not a factor we can influence easily. Interest rates, tax rates, and personnel burden are based on conservative assumptions.
Some of the more important underlying assumptions are:
- We assume a strong economy, without major recession.
- We assume, of course, that there are no unforeseen changes in economic policy to make our products immediately obsolete.
| General Assumptions | |||
| Year 1 | Year 2 | Year 3 | |
| Plan Month | 1 | 2 | 3 |
| Current Interest Rate | 10.00% | 10.00% | 10.00% |
| Long-term Interest Rate | 10.00% | 10.00% | 10.00% |
| Tax Rate | 25.42% | 25.00% | 25.42% |
| Other | 0 | 0 | 0 |
9.2 Break-even Analysis
Our break-even analysis will be based on running costs, that is costs we shall incur in keeping the business running, including salaries and wages, rent, water and electricity, insurance amongst others. Hence many fixed costs shall be included in these costs. We will thus aim to ensure that our sales levels are running comfortably above break-even.
The following chart and table summarize our break-even analysis. With fixed costs of approximately $41,040 per month at the outset (a bare minimum), we need to bill approximately $93,000to cover our costs. We don’t really expect to reach break-even until several months into the business operation.

| Break-even Analysis | |
| Monthly Revenue Break-even | $93,273 |
| Assumptions: | |
| Average Percent Variable Cost | 56% |
| Estimated Monthly Fixed Cost | $41,040 |
9.3 Projected Profit and Loss
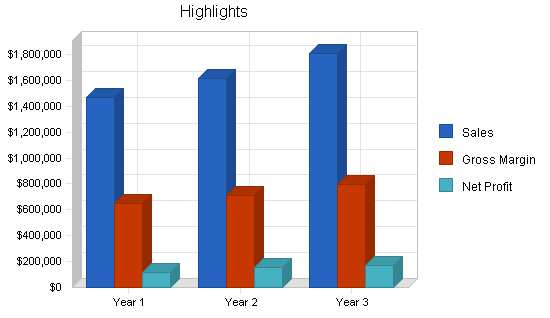
Our projected profit and loss is shown on the following table, with sales increasing from more than $1,466,000 the first year to more than $1,612,000 the second, and approximately $1,806,000 in the third year. Profits are calculated to be around $152,000 before tax the first year during the start-up phase of this business. This will be representative of a net profit margin of approximately 7%, which though may not seem that impressive is relatively good for a start-up firm in our line of business. As with the break-even, we are projecting very conservatively regarding cost of sales and gross margin. Our cost of sales should be much lower, and gross margin higher, than in this projection.
| Pro Forma Profit and Loss | |||
| Year 1 | Year 2 | Year 3 | |
| Sales | $1,466,026 | $1,612,629 | $1,806,144 |
| Direct Cost of Sales | $820,975 | $903,072 | $1,011,441 |
| Other | $0 | $0 | $0 |
| Total Cost of Sales | $820,975 | $903,072 | $1,011,441 |
| Gross Margin | $645,051 | $709,557 | $794,703 |
| Gross Margin % | 44.00% | 44.00% | 44.00% |
| Expenses | |||
| Payroll | $331,200 | $331,200 | $383,000 |
| Sales and Marketing and Other Expenses | $54,000 | $56,700 | $59,535 |
| Depreciation | $10,200 | $10,200 | $10,200 |
| Leased Equipment | $2,400 | $2,520 | $2,646 |
| Utilities | $4,800 | $5,040 | $5,292 |
| Insurance | $4,200 | $4,410 | $4,631 |
| Rent | $36,000 | $37,800 | $39,690 |
| Payroll Taxes | $49,680 | $49,680 | $57,450 |
| Other | $0 | $0 | $0 |
| Total Operating Expenses | $492,480 | $497,550 | $562,444 |
| Profit Before Interest and Taxes | $152,571 | $212,007 | $232,260 |
| EBITDA | $162,771 | $222,207 | $242,460 |
| Interest Expense | $2,000 | $1,000 | $0 |
| Taxes Incurred | $37,020 | $52,752 | $59,033 |
| Net Profit | $113,552 | $158,255 | $173,227 |
| Net Profit/Sales | 7.75% | 9.81% | 9.59% |
9.4 Key Financial Indicators
The following benchmark chart indicates our key financial indicators for the first three years. We foresee major growth in sales and operating expenses, and a bump in our collection days as we spread the business during expansion.
Collection days are very important. We do not want to let our average collection days get above 30 under any circumstances. This could cause a serious problem with cash flow, because our working capital situation is chronically tight. However, we recognize that we cannot control this factor easily, because of the relationship with our clients.

9.5 Expense Forecast
Initial marketing expenses are relatively high as we seek to become known on the market. This will be brought about by the development of sales literature, advertising expenses, and function expenses (including lunches and dinners with interested stakeholders). As our market share increases and capital is generated, further marketing programs and the expansion of those in existence at the time will be undertaken, to ensure market development. Once these programs will start generating revenue for the business, which we shall in turn reinvest.
9.6 Projected Cash Flow
Cash flow projections are critical to our success. Detailed monthly numbers are included in the appendix. However it should be noted that they do not take into account the required capital injection.

| Pro Forma Cash Flow | |||
| Year 1 | Year 2 | Year 3 | |
| Cash Received | |||
| Cash from Operations | |||
| Cash Sales | $366,507 | $403,157 | $451,536 |
| Cash from Receivables | $821,689 | $1,181,688 | $1,317,934 |
| Subtotal Cash from Operations | $1,188,195 | $1,584,846 | $1,769,470 |
| Additional Cash Received | |||
| Sales Tax, VAT, HST/GST Received | $0 | $0 | $0 |
| New Current Borrowing | $0 | $0 | $0 |
| New Other Liabilities (interest-free) | $0 | $0 | $0 |
| New Long-term Liabilities | $0 | $0 | $0 |
| Sales of Other Current Assets | $0 | $0 | $0 |
| Sales of Long-term Assets | $0 | $0 | $0 |
| New Investment Received | $77,000 | $0 | $0 |
| Subtotal Cash Received | $1,265,195 | $1,584,846 | $1,769,470 |
| Expenditures | Year 1 | Year 2 | Year 3 |
| Expenditures from Operations | |||
| Cash Spending | $331,200 | $331,200 | $383,000 |
| Bill Payments | $977,833 | $1,179,479 | $1,245,266 |
| Subtotal Spent on Operations | $1,309,033 | $1,510,679 | $1,628,266 |
| Additional Cash Spent | |||
| Sales Tax, VAT, HST/GST Paid Out | $0 | $0 | $0 |
| Principal Repayment of Current Borrowing | $0 | $20,000 | $0 |
| Other Liabilities Principal Repayment | $0 | $0 | $0 |
| Long-term Liabilities Principal Repayment | $0 | $0 | $0 |
| Purchase Other Current Assets | $0 | $0 | $0 |
| Purchase Long-term Assets | $0 | $0 | $0 |
| Dividends | $0 | $0 | $0 |
| Subtotal Cash Spent | $1,309,033 | $1,530,679 | $1,628,266 |
| Net Cash Flow | ($43,838) | $54,167 | $141,205 |
| Cash Balance | $36,162 | $90,329 | $231,533 |
9.7 Projected Balance Sheet
The balance sheet shows healthy growth of net worth, and strong financial position. The three-year estimates are included in the appendix.
| Pro Forma Balance Sheet | |||
| Year 1 | Year 2 | Year 3 | |
| Assets | |||
| Current Assets | |||
| Cash | $36,162 | $90,329 | $231,533 |
| Accounts Receivable | $277,831 | $305,614 | $342,287 |
| Inventory | $123,414 | $135,756 | $152,047 |
| Other Current Assets | $0 | $0 | $0 |
| Total Current Assets | $437,407 | $531,698 | $725,867 |
| Long-term Assets | |||
| Long-term Assets | $750,000 | $750,000 | $750,000 |
| Accumulated Depreciation | $10,200 | $20,400 | $30,600 |
| Total Long-term Assets | $739,800 | $729,600 | $719,400 |
| Total Assets | $1,177,207 | $1,261,298 | $1,445,267 |
| Liabilities and Capital | Year 1 | Year 2 | Year 3 |
| Current Liabilities | |||
| Accounts Payable | $146,655 | $92,492 | $103,233 |
| Current Borrowing | $20,000 | $0 | $0 |
| Other Current Liabilities | $0 | $0 | $0 |
| Subtotal Current Liabilities | $166,655 | $92,492 | $103,233 |
| Long-term Liabilities | $0 | $0 | $0 |
| Total Liabilities | $166,655 | $92,492 | $103,233 |
| Paid-in Capital | $938,700 | $938,700 | $938,700 |
| Retained Earnings | ($41,700) | $71,852 | $230,107 |
| Earnings | $113,552 | $158,255 | $173,227 |
| Total Capital | $1,010,552 | $1,168,807 | $1,342,034 |
| Total Liabilities and Capital | $1,177,207 | $1,261,298 | $1,445,267 |
| Net Worth | $1,010,552 | $1,168,807 | $1,342,034 |
9.8 Business Ratios
The table below shows our business ratios.
| Ratio Analysis | ||||
| Year 1 | Year 2 | Year 3 | Industry Profile | |
| Sales Growth | 0.00% | 10.00% | 12.00% | 4.60% |
| Percent of Total Assets | ||||
| Accounts Receivable | 23.60% | 24.23% | 23.68% | 5.30% |
| Inventory | 10.48% | 10.76% | 10.52% | 0.70% |
| Other Current Assets | 0.00% | 0.00% | 0.00% | 24.80% |
| Total Current Assets | 37.16% | 42.15% | 50.22% | 30.80% |
| Long-term Assets | 62.84% | 57.85% | 49.78% | 69.20% |
| Total Assets | 100.00% | 100.00% | 100.00% | 100.00% |
| Current Liabilities | 14.16% | 7.33% | 7.14% | 20.20% |
| Long-term Liabilities | 0.00% | 0.00% | 0.00% | 30.70% |
| Total Liabilities | 14.16% | 7.33% | 7.14% | 50.90% |
| Net Worth | 85.84% | 92.67% | 92.86% | 49.10% |
| Percent of Sales | ||||
| Sales | 100.00% | 100.00% | 100.00% | 100.00% |
| Gross Margin | 44.00% | 44.00% | 44.00% | 49.60% |
| Selling, General & Administrative Expenses | 36.30% | 34.19% | 34.36% | 26.10% |
| Advertising Expenses | 1.64% | 1.56% | 1.46% | 2.50% |
| Profit Before Interest and Taxes | 10.41% | 13.15% | 12.86% | 10.60% |
| Main Ratios | ||||
| Current | 2.62 | 5.75 | 7.03 | 1.67 |
| Quick | 1.88 | 4.28 | 5.56 | 1.42 |
| Total Debt to Total Assets | 14.16% | 7.33% | 7.14% | 50.90% |
| Pre-tax Return on Net Worth | 14.90% | 18.05% | 17.31% | 8.20% |
| Pre-tax Return on Assets | 12.79% | 16.73% | 16.07% | 16.70% |
| Additional Ratios | Year 1 | Year 2 | Year 3 | |
| Net Profit Margin | 7.75% | 9.81% | 9.59% | n.a |
| Return on Equity | 11.24% | 13.54% | 12.91% | n.a |
| Activity Ratios | ||||
| Accounts Receivable Turnover | 3.96 | 3.96 | 3.96 | n.a |
| Collection Days | 56 | 88 | 87 | n.a |
| Inventory Turnover | 10.91 | 6.97 | 7.03 | n.a |
| Accounts Payable Turnover | 7.67 | 12.17 | 12.17 | n.a |
| Payment Days | 27 | 39 | 28 | n.a |
| Total Asset Turnover | 1.25 | 1.28 | 1.25 | n.a |
| Debt Ratios | ||||
| Debt to Net Worth | 0.16 | 0.08 | 0.08 | n.a |
| Current Liab. to Liab. | 1.00 | 1.00 | 1.00 | n.a |
| Liquidity Ratios | ||||
| Net Working Capital | $270,752 | $439,207 | $622,634 | n.a |
| Interest Coverage | 76.29 | 212.01 | 0.00 | n.a |
| Additional Ratios | ||||
| Assets to Sales | 0.80 | 0.78 | 0.80 | n.a |
| Current Debt/Total Assets | 14% | 7% | 7% | n.a |
| Acid Test | 0.22 | 0.98 | 2.24 | n.a |
| Sales/Net Worth | 1.45 | 1.38 | 1.35 | n.a |
| Dividend Payout | 0.00 | 0.00 | 0.00 | n.a |
Controls
The local brewing market has been growing steadily over the last few years due to increases in people’s disposable income and opening of the economy. With this in mind we intend our marketing programs to expand accordingly. The introduction of quality catalogues and sales literature will enable Sedibeng Breweries to market to potential customers. We project sales to increase accordingly, though slightly slower as we establish a reputation for ourselves. With time, a presence on the Internet and participation in regional trade shows will be key milestones to expanding sales and marketing potentials through the utilization of new channels and identification of potential customers.
Throughout the year we intend to undertake regular evaluations of our marketing programs so as to ensure that we are in-line with our intended objectives.
In summary we intend to undertake the following:
-
Tracking and follow-up: We intend to have the discipline, as an organization, to track results of the business plan and make sure that we implement.
- Market segment focus: We intend to have the discipline to maintain the market segment focus.
- Saying no: Though difficult initially, we intend to be able to say no to special deals that take us away from the target focus and are unprofitable.
10.1 Contingency Planning
-
We intend to watch our results very carefully. We may need to drop production of certain products if we cannot get the margin up or material becomes difficult to obtain. We might be able to avoid the straight competition with the major companies by focusing more on the previously mentioned products.
- Another possibility is the introduction of a new company(s) in our niche. Hence the need to undertake aggressive marketing and networking.
-
An established beverage manufacturer may begin targeting to our target market niche. Hence the need for commitment in our work and striving of total quality in our organization.
- Though Botswana overall is rather secure on the labor front in terms of strikes we intend to have in place a mechanism that will ensure that were this to occur the negative effects would be minimized. However further research and analysis into the above is still being undertaken.
Appendix
| Sales Forecast | |||||||||||||
| Month 1 | Month 2 | Month 3 | Month 4 | Month 5 | Month 6 | Month 7 | Month 8 | Month 9 | Month 10 | Month 11 | Month 12 | ||
| Sales | |||||||||||||
| X Beer | 0% | $29,399 | $32,143 | $38,415 | $42,334 | $46,254 | $48,214 | $54,878 | $61,542 | $64,286 | $72,909 | $79,181 | $90,157 |
| Y Beer | 0% | $23,519 | $25,714 | $30,732 | $33,868 | $37,003 | $38,571 | $43,902 | $49,233 | $51,429 | $58,328 | $63,345 | $72,125 |
| Z Beer | 0% | $12,413 | $13,571 | $16,219 | $17,875 | $19,530 | $20,357 | $23,171 | $25,984 | $27,143 | $30,784 | $33,432 | $38,066 |
| Total Sales | $65,331 | $71,428 | $85,366 | $94,077 | $102,787 | $107,142 | $121,951 | $136,759 | $142,858 | $162,021 | $175,958 | $200,348 | |
| Direct Cost of Sales | Month 1 | Month 2 | Month 3 | Month 4 | Month 5 | Month 6 | Month 7 | Month 8 | Month 9 | Month 10 | Month 11 | Month 12 | |
| X Beer | $16,463 | $18,000 | $21,512 | $23,707 | $25,902 | $27,000 | $30,732 | $34,464 | $36,000 | $40,829 | $44,341 | $50,488 | |
| Y Beer | $13,171 | $14,400 | $17,210 | $18,966 | $20,722 | $21,600 | $24,585 | $27,570 | $28,800 | $32,664 | $35,473 | $40,390 | |
| Z Beer | $6,951 | $7,600 | $9,083 | $10,010 | $10,937 | $11,400 | $12,976 | $14,551 | $15,200 | $17,239 | $18,722 | $21,317 | |
| Subtotal Direct Cost of Sales | $36,585 | $40,000 | $47,805 | $52,683 | $57,561 | $60,000 | $68,293 | $76,585 | $80,000 | $90,732 | $98,536 | $112,195 | |
| Personnel Plan | |||||||||||||
| Month 1 | Month 2 | Month 3 | Month 4 | Month 5 | Month 6 | Month 7 | Month 8 | Month 9 | Month 10 | Month 11 | Month 12 | ||
| President and CEO | 0% | $4,000 | $4,000 | $4,000 | $4,000 | $4,000 | $4,000 | $4,000 | $4,000 | $4,000 | $4,000 | $4,000 | $4,000 |
| Operations Manager | 0% | $4,000 | $4,000 | $4,000 | $4,000 | $4,000 | $4,000 | $4,000 | $4,000 | $4,000 | $4,000 | $4,000 | $4,000 |
| Marketing Manager | 0% | $3,000 | $3,000 | $3,000 | $3,000 | $3,000 | $3,000 | $3,000 | $3,000 | $3,000 | $3,000 | $3,000 | $3,000 |
| Brewmaster | 0% | $3,000 | $3,000 | $3,000 | $3,000 | $3,000 | $3,000 | $3,000 | $3,000 | $3,000 | $3,000 | $3,000 | $3,000 |
| Brewmaster | 0% | $3,000 | $3,000 | $3,000 | $3,000 | $3,000 | $3,000 | $3,000 | $3,000 | $3,000 | $3,000 | $3,000 | $3,000 |
| Office Manager | 0% | $1,600 | $1,600 | $1,600 | $1,600 | $1,600 | $1,600 | $1,600 | $1,600 | $1,600 | $1,600 | $1,600 | $1,600 |
| Bottler #1 | 0% | $1,000 | $1,000 | $1,000 | $1,000 | $1,000 | $1,000 | $1,000 | $1,000 | $1,000 | $1,000 | $1,000 | $1,000 |
| Bottler #2 | 0% | $1,000 | $1,000 | $1,000 | $1,000 | $1,000 | $1,000 | $1,000 | $1,000 | $1,000 | $1,000 | $1,000 | $1,000 |
| Bottler #3 | 0% | $1,000 | $1,000 | $1,000 | $1,000 | $1,000 | $1,000 | $1,000 | $1,000 | $1,000 | $1,000 | $1,000 | $1,000 |
| Packager #1 | 0% | $1,000 | $1,000 | $1,000 | $1,000 | $1,000 | $1,000 | $1,000 | $1,000 | $1,000 | $1,000 | $1,000 | $1,000 |
| Packager #2 | 0% | $1,000 | $1,000 | $1,000 | $1,000 | $1,000 | $1,000 | $1,000 | $1,000 | $1,000 | $1,000 | $1,000 | $1,000 |
| Packager #3 | 0% | $1,000 | $1,000 | $1,000 | $1,000 | $1,000 | $1,000 | $1,000 | $1,000 | $1,000 | $1,000 | $1,000 | $1,000 |
| Packager #4 | 0% | $1,000 | $1,000 | $1,000 | $1,000 | $1,000 | $1,000 | $1,000 | $1,000 | $1,000 | $1,000 | $1,000 | $1,000 |
| Shipper #1 | 0% | $1,000 | $1,000 | $1,000 | $1,000 | $1,000 | $1,000 | $1,000 | $1,000 | $1,000 | $1,000 | $1,000 | $1,000 |
| Shipper #2 | 0% | $1,000 | $1,000 | $1,000 | $1,000 | $1,000 | $1,000 | $1,000 | $1,000 | $1,000 | $1,000 | $1,000 | $1,000 |
| Total People | 15 | 15 | 15 | 15 | 15 | 15 | 15 | 15 | 15 | 15 | 15 | 15 | |
| Total Payroll | $27,600 | $27,600 | $27,600 | $27,600 | $27,600 | $27,600 | $27,600 | $27,600 | $27,600 | $27,600 | $27,600 | $27,600 | |
| General Assumptions | |||||||||||||
| Month 1 | Month 2 | Month 3 | Month 4 | Month 5 | Month 6 | Month 7 | Month 8 | Month 9 | Month 10 | Month 11 | Month 12 | ||
| Plan Month | 1 | 2 | 3 | 4 | 5 | 6 | 7 | 8 | 9 | 10 | 11 | 12 | |
| Current Interest Rate | 10.00% | 10.00% | 10.00% | 10.00% | 10.00% | 10.00% | 10.00% | 10.00% | 10.00% | 10.00% | 10.00% | 10.00% | |
| Long-term Interest Rate | 10.00% | 10.00% | 10.00% | 10.00% | 10.00% | 10.00% | 10.00% | 10.00% | 10.00% | 10.00% | 10.00% | 10.00% | |
| Tax Rate | 30.00% | 25.00% | 25.00% | 25.00% | 25.00% | 25.00% | 25.00% | 25.00% | 25.00% | 25.00% | 25.00% | 25.00% | |
| Other | 0 | 0 | 0 | 0 | 0 | 0 | 0 | 0 | 0 | 0 | 0 | 0 | |
| Pro Forma Profit and Loss | |||||||||||||
| Month 1 | Month 2 | Month 3 | Month 4 | Month 5 | Month 6 | Month 7 | Month 8 | Month 9 | Month 10 | Month 11 | Month 12 | ||
| Sales | $65,331 | $71,428 | $85,366 | $94,077 | $102,787 | $107,142 | $121,951 | $136,759 | $142,858 | $162,021 | $175,958 | $200,348 | |
| Direct Cost of Sales | $36,585 | $40,000 | $47,805 | $52,683 | $57,561 | $60,000 | $68,293 | $76,585 | $80,000 | $90,732 | $98,536 | $112,195 | |
| Other | $0 | $0 | $0 | $0 | $0 | $0 | $0 | $0 | $0 | $0 | $0 | $0 | |
| Total Cost of Sales | $36,585 | $40,000 | $47,805 | $52,683 | $57,561 | $60,000 | $68,293 | $76,585 | $80,000 | $90,732 | $98,536 | $112,195 | |
| Gross Margin | $28,746 | $31,428 | $37,561 | $41,394 | $45,226 | $47,142 | $53,658 | $60,174 | $62,858 | $71,289 | $77,422 | $88,153 | |
| Gross Margin % | 44.00% | 44.00% | 44.00% | 44.00% | 44.00% | 44.00% | 44.00% | 44.00% | 44.00% | 44.00% | 44.00% | 44.00% | |
| Expenses | |||||||||||||
| Payroll | $27,600 | $27,600 | $27,600 | $27,600 | $27,600 | $27,600 | $27,600 | $27,600 | $27,600 | $27,600 | $27,600 | $27,600 | |
| Sales and Marketing and Other Expenses | $4,500 | $4,500 | $4,500 | $4,500 | $4,500 | $4,500 | $4,500 | $4,500 | $4,500 | $4,500 | $4,500 | $4,500 | |
| Depreciation | $850 | $850 | $850 | $850 | $850 | $850 | $850 | $850 | $850 | $850 | $850 | $850 | |
| Leased Equipment | $200 | $200 | $200 | $200 | $200 | $200 | $200 | $200 | $200 | $200 | $200 | $200 | |
| Utilities | $400 | $400 | $400 | $400 | $400 | $400 | $400 | $400 | $400 | $400 | $400 | $400 | |
| Insurance | $350 | $350 | $350 | $350 | $350 | $350 | $350 | $350 | $350 | $350 | $350 | $350 | |
| Rent | $3,000 | $3,000 | $3,000 | $3,000 | $3,000 | $3,000 | $3,000 | $3,000 | $3,000 | $3,000 | $3,000 | $3,000 | |
| Payroll Taxes | 15% | $4,140 | $4,140 | $4,140 | $4,140 | $4,140 | $4,140 | $4,140 | $4,140 | $4,140 | $4,140 | $4,140 | $4,140 |
| Other | $0 | $0 | $0 | $0 | $0 | $0 | $0 | $0 | $0 | $0 | $0 | $0 | |
| Total Operating Expenses | $41,040 | $41,040 | $41,040 | $41,040 | $41,040 | $41,040 | $41,040 | $41,040 | $41,040 | $41,040 | $41,040 | $41,040 | |
| Profit Before Interest and Taxes | ($12,294) | ($9,612) | ($3,479) | $354 | $4,186 | $6,102 | $12,618 | $19,134 | $21,818 | $30,249 | $36,382 | $47,113 | |
| EBITDA | ($11,444) | ($8,762) | ($2,629) | $1,204 | $5,036 | $6,952 | $13,468 | $19,984 | $22,668 | $31,099 | $37,232 | $47,963 | |
| Interest Expense | $167 | $167 | $167 | $167 | $167 | $167 | $167 | $167 | $167 | $167 | $167 | $167 | |
| Taxes Incurred | ($3,738) | ($2,445) | ($911) | $47 | $1,005 | $1,484 | $3,113 | $4,742 | $5,413 | $7,521 | $9,054 | $11,737 | |
| Net Profit | ($8,723) | ($7,334) | ($2,734) | $140 | $3,015 | $4,452 | $9,339 | $14,225 | $16,238 | $22,562 | $27,161 | $35,210 | |
| Net Profit/Sales | -13.35% | -10.27% | -3.20% | 0.15% | 2.93% | 4.16% | 7.66% | 10.40% | 11.37% | 13.93% | 15.44% | 17.57% | |
| Pro Forma Cash Flow | |||||||||||||
| Month 1 | Month 2 | Month 3 | Month 4 | Month 5 | Month 6 | Month 7 | Month 8 | Month 9 | Month 10 | Month 11 | Month 12 | ||
| Cash Received | |||||||||||||
| Cash from Operations | |||||||||||||
| Cash Sales | $16,333 | $17,857 | $21,342 | $23,519 | $25,697 | $26,786 | $30,488 | $34,190 | $35,715 | $40,505 | $43,990 | $50,087 | |
| Cash from Receivables | $0 | $1,633 | $49,151 | $53,919 | $64,242 | $70,776 | $77,199 | $80,727 | $91,833 | $102,722 | $107,623 | $121,864 | |
| Subtotal Cash from Operations | $16,333 | $19,490 | $70,492 | $77,439 | $89,939 | $97,561 | $107,687 | $114,916 | $127,548 | $143,227 | $151,612 | $171,951 | |
| Additional Cash Received | |||||||||||||
| Sales Tax, VAT, HST/GST Received | 0.00% | $0 | $0 | $0 | $0 | $0 | $0 | $0 | $0 | $0 | $0 | $0 | $0 |
| New Current Borrowing | $0 | $0 | $0 | $0 | $0 | $0 | $0 | $0 | $0 | $0 | $0 | $0 | |
| New Other Liabilities (interest-free) | $0 | $0 | $0 | $0 | $0 | $0 | $0 | $0 | $0 | $0 | $0 | $0 | |
| New Long-term Liabilities | $0 | $0 | $0 | $0 | $0 | $0 | $0 | $0 | $0 | $0 | $0 | $0 | |
| Sales of Other Current Assets | $0 | $0 | $0 | $0 | $0 | $0 | $0 | $0 | $0 | $0 | $0 | $0 | |
| Sales of Long-term Assets | $0 | $0 | $0 | $0 | $0 | $0 | $0 | $0 | $0 | $0 | $0 | $0 | |
| New Investment Received | $0 | $77,000 | $0 | $0 | $0 | $0 | $0 | $0 | $0 | $0 | $0 | $0 | |
| Subtotal Cash Received | $16,333 | $96,490 | $70,492 | $77,439 | $89,939 | $97,561 | $107,687 | $114,916 | $127,548 | $143,227 | $151,612 | $171,951 | |
| Expenditures | Month 1 | Month 2 | Month 3 | Month 4 | Month 5 | Month 6 | Month 7 | Month 8 | Month 9 | Month 10 | Month 11 | Month 12 | |
| Expenditures from Operations | |||||||||||||
| Cash Spending | $27,600 | $27,600 | $27,600 | $27,600 | $27,600 | $27,600 | $27,600 | $27,600 | $27,600 | $27,600 | $27,600 | $27,600 | |
| Bill Payments | $2,528 | $75,122 | $54,540 | $68,323 | $71,047 | $76,695 | $77,468 | $93,615 | $103,163 | $102,623 | $123,017 | $129,691 | |
| Subtotal Spent on Operations | $30,128 | $102,722 | $82,140 | $95,923 | $98,647 | $104,295 | $105,068 | $121,215 | $130,763 | $130,223 | $150,617 | $157,291 | |
| Additional Cash Spent | |||||||||||||
| Sales Tax, VAT, HST/GST Paid Out | $0 | $0 | $0 | $0 | $0 | $0 | $0 | $0 | $0 | $0 | $0 | $0 | |
| Principal Repayment of Current Borrowing | $0 | $0 | $0 | $0 | $0 | $0 | $0 | $0 | $0 | $0 | $0 | $0 | |
| Other Liabilities Principal Repayment | $0 | $0 | $0 | $0 | $0 | $0 | $0 | $0 | $0 | $0 | $0 | $0 | |
| Long-term Liabilities Principal Repayment | $0 | $0 | $0 | $0 | $0 | $0 | $0 | $0 | $0 | $0 | $0 | $0 | |
| Purchase Other Current Assets | $0 | $0 | $0 | $0 | $0 | $0 | $0 | $0 | $0 | $0 | $0 | $0 | |
| Purchase Long-term Assets | $0 | $0 | $0 | $0 | $0 | $0 | $0 | $0 | $0 | $0 | $0 | $0 | |
| Dividends | $0 | $0 | $0 | $0 | $0 | $0 | $0 | $0 | $0 | $0 | $0 | $0 | |
| Subtotal Cash Spent | $30,128 | $102,722 | $82,140 | $95,923 | $98,647 | $104,295 | $105,068 | $121,215 | $130,763 | $130,223 | $150,617 | $157,291 | |
| Net Cash Flow | ($13,796) | ($6,231) | ($11,648) | ($18,485) | ($8,708) | ($6,734) | $2,619 | ($6,299) | ($3,215) | $13,004 | $995 | $14,660 | |
| Cash Balance | $66,204 | $59,973 | $48,326 | $29,841 | $21,133 | $14,398 | $17,017 | $10,718 | $7,504 | $20,508 | $21,502 | $36,162 | |
| Pro Forma Balance Sheet | |||||||||||||
| Month 1 | Month 2 | Month 3 | Month 4 | Month 5 | Month 6 | Month 7 | Month 8 | Month 9 | Month 10 | Month 11 | Month 12 | ||
| Assets | Starting Balances | ||||||||||||
| Current Assets | |||||||||||||
| Cash | $80,000 | $66,204 | $59,973 | $48,326 | $29,841 | $21,133 | $14,398 | $17,017 | $10,718 | $7,504 | $20,508 | $21,502 | $36,162 |
| Accounts Receivable | $0 | $48,998 | $100,936 | $115,810 | $132,448 | $145,296 | $154,877 | $169,141 | $190,984 | $206,294 | $225,088 | $249,434 | $277,831 |
| Inventory | $10,000 | $40,244 | $44,000 | $52,585 | $57,951 | $63,317 | $65,999 | $75,122 | $84,244 | $88,001 | $99,805 | $108,390 | $123,414 |
| Other Current Assets | $0 | $0 | $0 | $0 | $0 | $0 | $0 | $0 | $0 | $0 | $0 | $0 | $0 |
| Total Current Assets | $90,000 | $155,447 | $204,909 | $216,721 | $220,241 | $229,746 | $235,275 | $261,280 | $285,946 | $301,798 | $345,400 | $379,326 | $437,407 |
| Long-term Assets | |||||||||||||
| Long-term Assets | $750,000 | $750,000 | $750,000 | $750,000 | $750,000 | $750,000 | $750,000 | $750,000 | $750,000 | $750,000 | $750,000 | $750,000 | $750,000 |
| Accumulated Depreciation | $0 | $850 | $1,700 | $2,550 | $3,400 | $4,250 | $5,100 | $5,950 | $6,800 | $7,650 | $8,500 | $9,350 | $10,200 |
| Total Long-term Assets | $750,000 | $749,150 | $748,300 | $747,450 | $746,600 | $745,750 | $744,900 | $744,050 | $743,200 | $742,350 | $741,500 | $740,650 | $739,800 |
| Total Assets | $840,000 | $904,597 | $953,209 | $964,171 | $966,841 | $975,496 | $980,175 | $1,005,330 | $1,029,146 | $1,044,148 | $1,086,900 | $1,119,976 | $1,177,207 |
| Liabilities and Capital | Month 1 | Month 2 | Month 3 | Month 4 | Month 5 | Month 6 | Month 7 | Month 8 | Month 9 | Month 10 | Month 11 | Month 12 | |
| Current Liabilities | |||||||||||||
| Accounts Payable | $0 | $73,319 | $52,265 | $65,961 | $68,491 | $74,131 | $74,359 | $90,175 | $99,765 | $98,529 | $118,720 | $124,634 | $146,655 |
| Current Borrowing | $20,000 | $20,000 | $20,000 | $20,000 | $20,000 | $20,000 | $20,000 | $20,000 | $20,000 | $20,000 | $20,000 | $20,000 | $20,000 |
| Other Current Liabilities | $0 | $0 | $0 | $0 | $0 | $0 | $0 | $0 | $0 | $0 | $0 | $0 | $0 |
| Subtotal Current Liabilities | $20,000 | $93,319 | $72,265 | $85,961 | $88,491 | $94,131 | $94,359 | $110,175 | $119,765 | $118,529 | $138,720 | $144,634 | $166,655 |
| Long-term Liabilities | $0 | $0 | $0 | $0 | $0 | $0 | $0 | $0 | $0 | $0 | $0 | $0 | $0 |
| Total Liabilities | $20,000 | $93,319 | $72,265 | $85,961 | $88,491 | $94,131 | $94,359 | $110,175 | $119,765 | $118,529 | $138,720 | $144,634 | $166,655 |
| Paid-in Capital | $861,700 | $861,700 | $938,700 | $938,700 | $938,700 | $938,700 | $938,700 | $938,700 | $938,700 | $938,700 | $938,700 | $938,700 | $938,700 |
| Retained Earnings | ($41,700) | ($41,700) | ($41,700) | ($41,700) | ($41,700) | ($41,700) | ($41,700) | ($41,700) | ($41,700) | ($41,700) | ($41,700) | ($41,700) | ($41,700) |
| Earnings | $0 | ($8,723) | ($16,056) | ($18,791) | ($18,650) | ($15,636) | ($11,184) | ($1,845) | $12,381 | $28,619 | $51,181 | $78,342 | $113,552 |
| Total Capital | $820,000 | $811,277 | $880,944 | $878,209 | $878,350 | $881,364 | $885,816 | $895,155 | $909,381 | $925,619 | $948,181 | $975,342 | $1,010,552 |
| Total Liabilities and Capital | $840,000 | $904,597 | $953,209 | $964,171 | $966,841 | $975,496 | $980,175 | $1,005,330 | $1,029,146 | $1,044,148 | $1,086,900 | $1,119,976 | $1,177,207 |
| Net Worth | $820,000 | $811,277 | $880,944 | $878,209 | $878,350 | $881,364 | $885,816 | $895,155 | $909,381 | $925,619 | $948,181 | $975,342 | $1,010,552 |


