
Bowl Weevil
Executive Summary
Bowling is an entertainment industry in Anytown with a customer base that has diminished over the past few decades. Today’s senior citizens were once yesterday’s avid bowlers. As the Baby-Boomers questioned the actions of their elders, they also turned away from bowling. Eventually, without innovation, bowling lost popularity as America’s favorite athletic events.
However, Anytown needs no replacement for the athletic and social event bowling once offered, it simply needs innovation! Sally Strike, the owner and manager of Bowl Weevil, understands the trend of revitalization in the bowling cultures from her youthful participation in bowling and through her work in the Professional Bowling Association. Sally has experience as a bowler in the local community and as a marketing and business analyst for the Professional Bowling Association. Sally will also be able to access her contacts within the Professional Bowling and Skating Associations to stimulate touring tournaments and competitions.
Sally has done the research necessary to plan and implement designs for a new bowling alley in the historic Miller building, downtown. Bowl Weevil will take advantage of the building’s nostalgic feel to create a truly unique atmosphere, attracting after-school kids looking for entertainment and a snack, families with young children seeking inexpensive entertainment, seniors looking for fun activities, and local bowlers seeking league competition in their own neighborhoods. We will offer family and group rates and theme nights with live music.
Sally is committing $60,000 of her own money to the project, and is requesting a seven-year loan of $163,900 to complete start-up funding for this new venture. The loan will be secured with the owner’s home equity. Based on our market research here in Anytown, we conservatively project sales over $500,000 in year one, with a strong net profit in year three, with a staff of nine.
1.1 Mission
The mission of Bowl Weevil is to provide the highest form of entertainment in the Anytown community. We offer the best bowling and overall entertainment for the entire family!
1.2 Objectives
- Sales of $523,000 in year one and $608,000 by year three.
- Gross margin higher than 65%.
- Net income more than 2.7% of sales by the third year.
1.3 Keys to Success
- Excellence in entertainment.
- Developing a community of regulars.
- Group rates.
- A good value for sport lessons and entertainment.

Company Summary
Bowl Weevil is a classic bowling alley owned by Sally Strike. Bowl Weevil specializes in league bowling and parties – a fun filled environment for the entire family. Bowl Weevil will be located in the old Miller building, where the vintage 1920’s charm will help to create an ambience of nostalgic fun.
2.1 Company Ownership
Bowl Weevil is a C Corporation owned by Sally Strike. It is incorporated in the state of Kentucky, and operates in King County.
2.2 Start-up Summary
Bowl Weevil’s start-up costs will include all equipment needed for the bowling alley, the restaurant, inventory and daily bank to cover the total winnings of all pull-tabs.
The bowling alley lanes and restaurant equipment will be the largest chunk of the start-up expenses. These long-term assets include 16 hardwood bowling lanes, 180 pins, 8 electronic scoring terminals, a commercial range and oven, a walk-in refrigerator, video games, pull tab equipment, a sink and dishwasher.
Start-up expenses will include rent during renovation (one month’s deposit and three month’s rent), construction costs of the renovation, and advertising. During the start-up period, we will use both television ads and fliers. We will also place an ad in the Yellow Pages, but this will not be available to potential clients until June, when the new phone book is delivered.

| Start-up | |
| Requirements | |
| Start-up Expenses | |
| Legal Costs | $500 |
| Consulting | $500 |
| Construction | $20,000 |
| Advertising | $3,000 |
| Rent during renovation | $40,000 |
| Total Start-up Expenses | $64,000 |
| Start-up Assets | |
| Cash Required | $40,000 |
| Start-up Inventory | $7,000 |
| Other Current Assets | $35,000 |
| Long-term Assets | $77,900 |
| Total Assets | $159,900 |
| Total Requirements | $223,900 |
| Start-up Funding | |
| Start-up Expenses to Fund | $64,000 |
| Start-up Assets to Fund | $159,900 |
| Total Funding Required | $223,900 |
| Assets | |
| Non-cash Assets from Start-up | $119,900 |
| Cash Requirements from Start-up | $40,000 |
| Additional Cash Raised | $0 |
| Cash Balance on Starting Date | $40,000 |
| Total Assets | $159,900 |
| Liabilities and Capital | |
| Liabilities | |
| Current Borrowing | $0 |
| Long-term Liabilities | $163,900 |
| Accounts Payable (Outstanding Bills) | $0 |
| Other Current Liabilities (interest-free) | $0 |
| Total Liabilities | $163,900 |
| Capital | |
| Planned Investment | |
| Owner | $60,000 |
| Investor | $0 |
| Additional Investment Requirement | $0 |
| Total Planned Investment | $60,000 |
| Loss at Start-up (Start-up Expenses) | ($64,000) |
| Total Capital | ($4,000) |
| Total Capital and Liabilities | $159,900 |
| Total Funding | $223,900 |
Products and Services
Bowl Weevil will be open Wednesday through Sunday, from 12 noon-11pm.
General Bowling
Customers can rent shoes and buy games. We will keep a full selection of adult and children’s shoes in stock, in a variety of styles – getting your shoes should feel like dressing up, not slumming it. We will offer prizes for the high scorers in each 2-hour period, and children under 12 get a prize for hitting more than 8 pins. Bowl Weevil will also introduce the bowling league experience to youths through its Saturday morning teen leagues. Families can pay a family rate to cover parents and up to 5 children.
Bowling for leagues, with league fees
We will sponsor local leagues, and our league manager will coordinate the league bowling nights. Several local groups currently travel 10 miles to go bowling and to find other teams with whom to compete. They have all expressed an interest in a closer locale that would give them special services. We are currently working with some of these groups to brainstorm league-building activities.
Food and drinks
Our kitchen will be open from 3pm to 10pm, offering retro diner foods like hamburgs and milkshakes, as well as healthier options, from pasta to eggplant parmesan. Our town has a significant vegetarian populace, and we want them to be able to enjoy bowling and snacking as much as any other customer. Starting at 5pm, we will also have a bartender to serve beer and wine and to make a limited selection of mixed drinks. Our combination nostalgic/upscale/modern menu will help make Bowl Weevil a destination spot, and our experienced chef has a number of ideas for seasonal specials using local ingredients.
Videogames
We will also have a rotating stock of Arcade games. We will keep track of which kinds of games (1st person shooters, driving games, strategy games) seem to be the most popular, and adjust our offerings to maximize revenue. These games will be another way for families to entertain all their children, while some family members bowl.
Pull-tabs
Pull-tabs are two-ply laminated paper tickets that contain perforated windows which conceal various game symbols, numbers, etc. These tickets have either three (3) or five (5) windows and various game themes. They are sold only at establishments that hold a Class C liquor license and are licensed by the state lottery to sell pull-tab tickets (we have such a license).
The front of each pull-tab ticket contains the name of the game, the cost of a ticket, the winning symbol combinations, the prize values, and the overall odds of winning a prize. The back of the ticket contains the perforated windows that open to reveal the game symbols. Under each window are winning and losing symbols. The overall odds of winning a prize on a pull-tab ticket are approximately 1 in 6.
Parties and Special Events
Bowl Weevil will be available for birthday parties and special events. On the first Friday of every month, we will have a DJ or live band and a theme night aimed at local teens. We will also offer group rates and special events for local churches, community organizations, and companies.

Market Analysis Summary
Bowling has declined as the family activity of choice over the last 30 years. While the image of bowling has changed during this decline, the sport itself still offers good exercise, fun competition, and a game of skill. If the image and experience of bowling can be updated with a more attractive look and feel, there is no reason it could not rebound.
Bowling is a family activity, and one that people can continue well into their old age. It is a game of skill, which allows players to better their scores with practice, and it can be a team sport. Bowling alleys get their clients from the local area, usually within a 10 mile radius; they are therefore more subject to local trends and events than are bigger entertainment producers, like movies or theme parks. However, this also means that bowling alleys can be more integral to their community, and more involved in community-building, which generates customer loyalty.
In some local families, the appeal of bowling is self-evident – it is a family activity they have always done together, enjoyed, and will continue playing all of their lives. For some, bowling is completely foreign – they have heard of it, but never done it. And for some younger people, bowling is an “old folks” thing, like bell bottomed jeans – they may occasionally indulge in it, and have a good time, but with the same sense of irony and self-mockery that infuses today’s fashion trends.
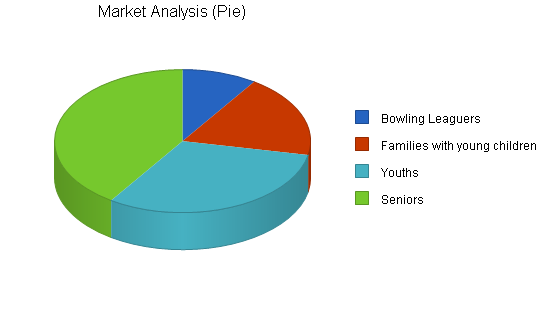
Bowl Weevil customers can be divided into four groups: bowling leaguers, families with young children, youths and seniors.
- Bowling Leaguers. New customers are likely to be introduced to Bowl Weevil by friends or through a community organization which decides to sponsor a team.
- Families with young children. This group is seeking inexpensive fun for the whole family, where age and experience (or lack thereof) are not hurdles to enjoying the outing. Bowling in a safe, clean, family-friendly environment will be infinitely preferable for these families to sitting through yet another Winnie-the-Pooh video or going to an unkempt local park.
- Youths. This segment will be interested in finding a fun place where they can spend time outside of the house with people their age. We are located only four blocks from the local high school, and our kitchen will open at 3pm, to offer these growing kids satisfying after-school snacks in a safe, supervised activity of which their parents will approve.
- Seniors. These clients are on limited income and will come to Bowl Weevil for the prices. Senior discounts will play a large role in our marketing to seniors.
4.1 Market Segmentation
The following table and chart show our market analysis. We have included analysis for each of the four market segments we will target: bowling leaguers, families with children, youths, and seniors.
Bowling leaguers
There are currently 3,000 local residents who have participated in some form of league bowling in the last five years (Anytown newspaper, November, 2004). The 25% growth rate is projected based on the expressed interest of local league bowlers, their claims that their friends would join the league if they didn’t have to travel so far for games, and our aggressive planned marketing campaigns.
Families with young children
There are currently around 6,000 families in Anytown with children under 12; that population is expected to grow at a 5% rate for the next ten years (U.S. Census, 2000). Altogether, these families include roughly 24,000 people, but our special family rates make it more reasonable for us to treat them here as individual family units, rather than independent residents.
Youths
We define youths as customers between the ages of 13 and 20, old enough to have some spending money and to bowl without parental supervision, but not old enough to be admitted to the bar section. This target market segment is growing at the same rate as young families, at 5% per year.
Seniors
We define this group as sixty-two years or older. This group is currently growing faster than the general population, at 6% per year, and their concerns and interests are already modifying what entertainment and education is offered in Anytown. They will contribute a consistent customer base to the the bowling league, as well as coming in on their own to practice.
| Market Analysis | |||||||
| Year 1 | Year 2 | Year 3 | Year 4 | Year 5 | |||
| Potential Customers | Growth | CAGR | |||||
| Bowling Leaguers | 25% | 3,000 | 3,750 | 4,688 | 5,860 | 7,325 | 25.00% |
| Families with young children | 5% | 6,000 | 6,300 | 6,615 | 6,946 | 7,293 | 5.00% |
| Youths | 5% | 10,000 | 10,500 | 11,025 | 11,576 | 12,155 | 5.00% |
| Seniors | 6% | 13,000 | 13,780 | 14,607 | 15,483 | 16,412 | 6.00% |
| Total | 7.78% | 32,000 | 34,330 | 36,935 | 39,865 | 43,185 | 7.78% |
4.2 Target Market Segment Strategy
We will not be successful waiting for the customer to come to us. Instead, we must focus on the specific market segments whose needs match our offerings. Focusing on targeted segments is the key to our future.
Bowling Leaguers:
- Bowling leagues develop a core group of customers. These customers will begin to identify their social and athletic events with Bowl Weevil bowling. Once one group of friends begins congregating together at Bowl Weevil Bowling for league events, they will bring other friends to join them for other occasions.
- Bowling packaged with flavor is Sally’s area of expertise. Bowl Weevil bowling will cater to everyone’s desire for fame, fitness and fortune. Beginning with a nine game bowling league tournament will give participants the flavor of athletic competition and will give the winners a little extra spending cash and fame. Those feelings will stimulate more interest, and more interest will support more tournaments, which will in turn stimulate more reward. The tournaments will culminate in a Bowling for Dollars televised tournament by the end of year two.
Youths:
- Bowling alleys and skating rinks are one of few places that under age customers can go to congregate and find entertainment.
- Catering to youths and teaching them to bowl or skate now will develop a future customer base for years to come.
Seniors:
Bowl Weevil will cater to senior citizens because they are consistent customers. Once they find an affordable, comfortable place, seniors will come back for more. Seniors also tend to congregate together. Therefore, accommodating a small core group will lead to potentially exponential growth as the Baby-Boomers become a majority of the population and they introduce each other to Bowl Weevil’s senior citizen discounts. An added value is that senior citizens, shown the importance of their time, may be encouraged to contribute low-cost labor as volunteers for youth and adult bowling league events.
4.3 Service Business Analysis
Bowl Weevil will be competing for the customers’ dollars with other recreation and leisure establishments such as movie theaters, sports venues, theme parks, night clubs, etc.
4.3.1 Competition and Buying Patterns
The competition for local customers amongst bowling alleys and skating rinks is localized, meaning each urban district can support its own bowling alley or skating rink. Customers will choose the provider they think offers the most comfortable, affordable and convenient location. Due to the decline in the number of bowling alleys and skating rinks, many districts are without bowling or skating facilities. Anytown did not have a combination bowling alley, ice skating and roller skating facility. Bowl Weevil located in Anytown, will enjoy the advantage of having no local competition in a densely populated, mixed-age area with good public transportation making it conveniently accessible for locals.
Bowlers and skaters will contribute to the success and reputation of Bowl Weevil as they consistently choose Bowl Weevil for their social events and athletic activities.
Seniors will provide a consistent customer base.
Youths will come for the group lessons, public sessions, competitions, birthday parties, group parties, hocky and the Saturday morning teenager bowling leagues and they will bring their parents with them.
The competition for tournaments city-wide and nationally depends on the bowling alley and ice skating rink’s reputation and the reputation of the skaters and bowlers. Sally has the advantage of working with the Professional Bowling Association as well as the Professional Ice Skating Association, and playing in local bowling championship tournaments for many years.
Strategy and Implementation Summary
Customer service is paramount in the bowling business. The starting point to accomplish this is to have a trained and motivated staff that enjoys working directly with the public. It is always easier to please your customers when the facility is spotless and all of the equipment is in proper working order. The center will establish community involvement to demonstrate how the business will contribute to a better quality of life. Community projects using the bowling center’s facilities will be developed to help civic groups obtain their financial goals. School, church, and other groups will be welcomed for tours of the bowling center.
5.1 Competitive Edge
Experience and Reputation:
- Sally has experience as a bowler in the local community and as a marketing and business analyst for the Professional Bowling Association. Sally’s experience will give her the ability to contact local and national bowlers for recruiting leaguers. Sally also has contacts within the National Ice Skating Association and Roller Skating organizations organizing competitions throughout the Region.
- Bowl Weevil will have the reputation of being the most affordable, comfortable and convenient place of entertainment in town for the entire family.
5.2 Marketing Strategy
Marketing in a bowling business depends on reputation for quality bowling facilities and entertainment. It starts with Sally’s known contacts in the bowling and ice and roller industries, and continues with long-term efforts to develop reputation in local communities.
Bowl Weevil will develop and maintain a database of people in the bowling leagues. The database starts with the contacts we bring in with our first nine game bowling league tournament. From there we will add inquiries and participants, and bowling league newsletters. Bowl Weevil will use the database to make regular contact with mailings for additional bowling league tournaments, possibly group studies and market research reports.
We will recruit a core league of bowlers from the local and Professional Bowling Association contacts for the first nine game bowling league tournament. After the first tournament, the core league of bowlers will be cultivated for future participants and league organizers.
5.3 Sales Strategy
Bowl Weevil wants to attract local bowlers of all ages. This will require advertising on local radio shows and cable networks as well as reaching out to schools, churches, businesses, organizations and clubs.
The most important factor for closing sales in our case is getting them in the door. Once our customers come in the door they will be personally greeted by Sally Strike and made to feel comfortable so that they keep coming back.
The league manager will be hired part-time to contact local work places, clubs, and bowlers to participate in the nine-game league tournament. Participants in the tournament will be rewarded with trophies for the first three teams and the champion will receive a cash prize equal to half of all the entry fees. The Marketing Coordinator will maintain a database of contact information and sales data about regular bowling leaguers to optimize services to our target customers during league hours. Reduced prices will be offered to senior citizens on a daily basis between certain low-volume hours and on certain food and drink items all day long. Advertisements to teenagers will be placed in local college and weekly papers, highlighting their favorite video games, their favorite tunes on the jukebox, and the Saturday morning teenager tournaments.
The manager will go out in the field calling on churches, schools, clubs, organizations, scouts to sell group outings/lessons. Private party times will be sold for each area as well.
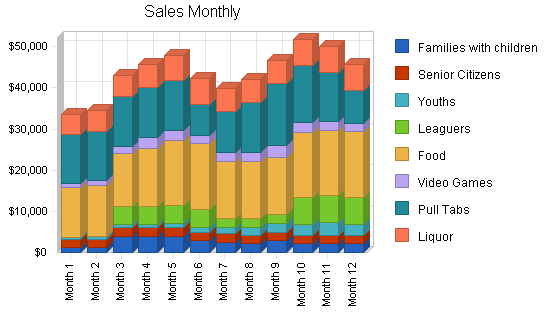
5.3.1 Sales Forecast
The start-up period will be spent setting up the bowling alley, the gaming room, the restaurant and lounge. This will include building the bowling lanes setting up the pins and connecting the scoring terminals. During this time, the manager will recruit bowling leaguers for his first nine game bowling league tournament and begin advertising in local papers for the opening and senior discounts.
In April, Bowl Weevil Bowling Lanes will open for business. We project an increase in business in June, when school lets out, and families need entertainment for their children during daytime hours. We will start league games in July.
The table and charts below show detailed projections of sales and cost of sales for each category. Detailed monthly projections for the first year can be found in the Appendix. Cost of sales for bowling is a projection of direct wear and tear on equipment which will need replacing, cleaning, or repair. Costs for food and liquor are costs of ingredients. There are no anticipated direct costs from the video games.
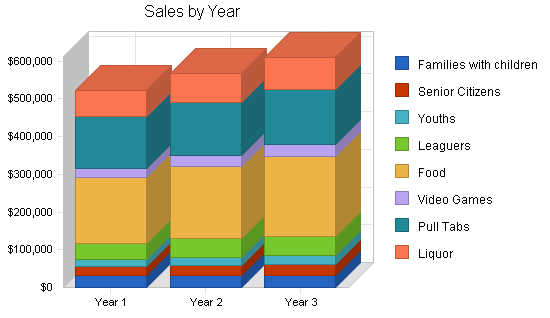
| Sales Forecast | |||
| Year 1 | Year 2 | Year 3 | |
| Sales | |||
| Families with children | $31,300 | $32,000 | $33,000 |
| Senior Citizens | $24,000 | $27,000 | $29,000 |
| Youths | $18,575 | $21,000 | $22,000 |
| Leaguers | $44,000 | $50,000 | $52,000 |
| Food | $172,750 | $192,000 | $211,328 |
| Video Games | $24,850 | $28,875 | $32,094 |
| Pull Tabs | $138,500 | $140,625 | $145,000 |
| Liquor | $69,100 | $76,800 | $84,531 |
| Total Sales | $523,075 | $568,300 | $608,953 |
| Direct Cost of Sales | Year 1 | Year 2 | Year 3 |
| Families with children | $5,165 | $5,280 | $5,445 |
| Senior Citizens | $3,528 | $3,969 | $4,263 |
| Youths | $3,065 | $3,465 | $3,630 |
| Leaguers | $7,260 | $8,250 | $8,580 |
| Food | $114,879 | $124,800 | $137,363 |
| Video Games | $0 | $0 | $0 |
| Pull Tabs | $4,432 | $4,500 | $4,640 |
| Liquor | $13,820 | $15,360 | $16,906 |
| Subtotal Direct Cost of Sales | $152,148 | $165,624 | $180,828 |
5.4 Milestones
The accompanying table lists important program milestones, with dates and managers in charge, and budgets for each. The milestone schedule indicates our emphasis on planning for implementation.
What the table doesn’t show is the commitment behind it. Our business plan includes complete provisions for plan-vs.-actual analysis, and we will hold monthly follow-up meetings to discuss the variance and course corrections.
| Milestones | |||||
| Milestone | Start Date | End Date | Budget | Manager | Department |
| Business Plan Completion | 1/1/2005 | 2/1/2005 | $0 | President Judi | Executive |
| Group Sales | 1/1/2005 | 4/1/2005 | $400 | President Judi | Marketing |
| Completion of First Marketing Campaign | 1/1/2005 | 4/1/2005 | $500 | Marketing Coordinator | Marketing |
| Completion of First Nine Game League | 4/1/2005 | 6/15/2005 | $200 | President Judi | Marketing |
| Profitability | 1/1/2005 | 1/1/2006 | $0 | President Judi | Accounting |
| Totals | $1,100 | ||||
Management Summary
Bowl Weevil is a C Corporation founded and run by Sally Strike. Sally Strike graduated from the University of Anytown with degrees in both Business and Communications. Through the University of Anytown ice skating club Sally gained local notoriety as a champion bowler. Since graduation, Sally joined the Professional Bowling Association and worked as its treasurer for three years. While working for the Professional Bowling Association, Sally developed budgets and marketing campaigns.
One of Sally Strike’s strengths was her ability to draw crowds. Another strength was Sally’s talent for increasing local participation. Sally spent a fair amount of time with bowlers nationwide. After three years however, Sally was feeling spread too thin and wanted to center herself. Sally decided to retire from the Professional Bowling Association and start her own bowling center.
6.1 Personnel Plan
Initially, the staff will consist of the Owner/Manager working full-time. In addition to the owner, a full-time bartender, a full-time kitchen manager, a full-time cashier, a part-time lane maintenance specialist, and a part-time league manager will join her for the opening of the bowling alley, restaurant and lounge.
| Personnel Plan | |||
| Year 1 | Year 2 | Year 3 | |
| Manager | $36,000 | $36,000 | $36,000 |
| Assistant Manager | $0 | $30,000 | $32,000 |
| Chef | $33,000 | $33,500 | $34,000 |
| Sous Chef | $30,000 | $30,000 | $30,500 |
| Bus boy/Dishwasher | $24,000 | $24,000 | $24,000 |
| Lane Maintenance | $7,680 | $7,680 | $7,680 |
| League Manager | $7,680 | $8,000 | $8,500 |
| Cashier/Front Desk | $30,000 | $30,000 | $30,500 |
| Bartender | $13,440 | $13,440 | $13,440 |
| Total People | 8 | 9 | 9 |
| Total Payroll | $181,800 | $212,620 | $216,620 |
Financial Plan
Bowl Weevil’s financial plan is conservative. With sufficient start-up funding, we will be able to not only complete renovations on time for opening, but hire enough staff to provide a full-service, fun, safe, and clean environment for our bowlers. Although we are asking for a very large loan, we should be easily able to repay it within seven years, even after hiring an additional manager in year two.
The first two years will be the slimmest, as we establish our reputation among our target groups and build market share. However, our sales forecasts are based on sound research, and are conservative. We will focus on aggressive marketing and limiting expenses during these early years to achieve our long-term goals.
7.1 Important Assumptions
The financial plan depends on important assumptions, most of which are shown in the following table as annual assumptions. The monthly assumptions are included in the appendix. Bowling league participation rates are based on conservative assumptions.
Two of the more important underlying assumptions are:
- We assume youths, seniors, and adult bowlers will congregate together at Bowl Weevil Bowling Lanes given separate environments to listen to their own preferences in music.
- We assume that there are no unforeseen changes in the local bowling community to increase competition in Anytown.
| General Assumptions | |||
| Year 1 | Year 2 | Year 3 | |
| Plan Month | 1 | 2 | 3 |
| Current Interest Rate | 10.00% | 10.00% | 10.00% |
| Long-term Interest Rate | 10.00% | 10.00% | 10.00% |
| Tax Rate | 30.00% | 30.00% | 30.00% |
| Other | 0 | 0 | 0 |
7.2 Break-even Analysis
The following chart and table summarize our break-even analysis.

| Break-even Analysis | |
| Monthly Revenue Break-even | $37,928 |
| Assumptions: | |
| Average Percent Variable Cost | 29% |
| Estimated Monthly Fixed Cost | $26,896 |
7.3 Projected Profit and Loss
The following table indicates the projected profit and loss. We plan to take a hit in net profit in the second year in order to hire an assistant manager, and to increase personnel payments for our employees. This additional hiring and the raises are subject to cash flow meeting projections.


| Pro Forma Profit and Loss | |||
| Year 1 | Year 2 | Year 3 | |
| Sales | $523,075 | $568,300 | $608,953 |
| Direct Cost of Sales | $152,148 | $165,624 | $180,828 |
| Other | $0 | $0 | $0 |
| Total Cost of Sales | $152,148 | $165,624 | $180,828 |
| Gross Margin | $370,927 | $402,676 | $428,126 |
| Gross Margin % | 70.91% | 70.86% | 70.31% |
| Expenses | |||
| Payroll | $181,800 | $212,620 | $216,620 |
| Marketing/Promotion | $3,000 | $3,000 | $3,000 |
| Depreciation | $7,788 | $7,788 | $7,788 |
| Rent | $110,000 | $112,000 | $112,000 |
| Utilities | $3,360 | $3,600 | $3,900 |
| Insurance | $2,400 | $2,500 | $2,600 |
| Payroll Taxes | $0 | $0 | $0 |
| Shoe Repair and maintenance | $2,400 | $2,500 | $2,500 |
| Pull Tabs | $6,000 | $6,000 | $6,000 |
| Video Game Rentals | $6,000 | $6,000 | $6,000 |
| Total Operating Expenses | $322,748 | $356,008 | $360,408 |
| Profit Before Interest and Taxes | $48,179 | $46,668 | $67,718 |
| EBITDA | $55,967 | $54,456 | $75,506 |
| Interest Expense | $15,123 | $12,850 | $10,450 |
| Taxes Incurred | $9,917 | $10,145 | $17,180 |
| Net Profit | $23,140 | $23,673 | $40,087 |
| Net Profit/Sales | 4.42% | 4.17% | 6.58% |
7.4 Projections
7.5 Projected Cash Flow
Our business is a retail-oriented business with clients who will pay primarily with cash and credit cards. Our cash flow is shown below, including repayment of the requested loan. Hiring a second manager will make an impact on cash flow in the second year, but we anticipate greater sales and efficiency to make up this difference by year three.

| Pro Forma Cash Flow | |||
| Year 1 | Year 2 | Year 3 | |
| Cash Received | |||
| Cash from Operations | |||
| Cash Sales | $523,075 | $568,300 | $608,953 |
| Subtotal Cash from Operations | $523,075 | $568,300 | $608,953 |
| Additional Cash Received | |||
| Sales Tax, VAT, HST/GST Received | $0 | $0 | $0 |
| New Current Borrowing | $0 | $0 | $0 |
| New Other Liabilities (interest-free) | $0 | $0 | $0 |
| New Long-term Liabilities | $0 | $0 | $0 |
| Sales of Other Current Assets | $0 | $0 | $0 |
| Sales of Long-term Assets | $0 | $0 | $0 |
| New Investment Received | $0 | $0 | $0 |
| Subtotal Cash Received | $523,075 | $568,300 | $608,953 |
| Expenditures | Year 1 | Year 2 | Year 3 |
| Expenditures from Operations | |||
| Cash Spending | $181,800 | $212,620 | $216,620 |
| Bill Payments | $292,004 | $325,965 | $344,355 |
| Subtotal Spent on Operations | $473,804 | $538,585 | $560,975 |
| Additional Cash Spent | |||
| Sales Tax, VAT, HST/GST Paid Out | $0 | $0 | $0 |
| Principal Repayment of Current Borrowing | $0 | $0 | $0 |
| Other Liabilities Principal Repayment | $0 | $0 | $0 |
| Long-term Liabilities Principal Repayment | $23,400 | $24,000 | $24,000 |
| Purchase Other Current Assets | $0 | $0 | $0 |
| Purchase Long-term Assets | $0 | $0 | $0 |
| Dividends | $0 | $0 | $0 |
| Subtotal Cash Spent | $497,204 | $562,585 | $584,975 |
| Net Cash Flow | $25,872 | $5,715 | $23,978 |
| Cash Balance | $65,872 | $71,587 | $95,565 |
7.6 Projected Balance Sheet
The balance sheet in the following table shows managed but sufficient growth of net worth, and a sufficiently healthy financial position. The monthly estimates are included in the appendix.
| Pro Forma Balance Sheet | |||
| Year 1 | Year 2 | Year 3 | |
| Assets | |||
| Current Assets | |||
| Cash | $65,872 | $71,587 | $95,565 |
| Inventory | $15,768 | $17,165 | $18,740 |
| Other Current Assets | $35,000 | $35,000 | $35,000 |
| Total Current Assets | $116,640 | $123,751 | $149,305 |
| Long-term Assets | |||
| Long-term Assets | $77,900 | $77,900 | $77,900 |
| Accumulated Depreciation | $7,788 | $15,576 | $23,364 |
| Total Long-term Assets | $70,112 | $62,324 | $54,536 |
| Total Assets | $186,752 | $186,075 | $203,841 |
| Liabilities and Capital | Year 1 | Year 2 | Year 3 |
| Current Liabilities | |||
| Accounts Payable | $27,112 | $26,763 | $28,441 |
| Current Borrowing | $0 | $0 | $0 |
| Other Current Liabilities | $0 | $0 | $0 |
| Subtotal Current Liabilities | $27,112 | $26,763 | $28,441 |
| Long-term Liabilities | $140,500 | $116,500 | $92,500 |
| Total Liabilities | $167,612 | $143,263 | $120,941 |
| Paid-in Capital | $60,000 | $60,000 | $60,000 |
| Retained Earnings | ($64,000) | ($40,860) | ($17,188) |
| Earnings | $23,140 | $23,673 | $40,087 |
| Total Capital | $19,140 | $42,812 | $82,900 |
| Total Liabilities and Capital | $186,752 | $186,075 | $203,841 |
| Net Worth | $19,140 | $42,812 | $82,900 |
7.7 Business Ratios
The following table shows the projected businesses ratios, and standard comparison ratios for our industry, Bowling Centers (SIC Code 7933). We expect to maintain healthy ratios for profitability, risk, and return.
| Ratio Analysis | ||||
| Year 1 | Year 2 | Year 3 | Industry Profile | |
| Sales Growth | 0.00% | 8.65% | 7.15% | 0.22% |
| Percent of Total Assets | ||||
| Inventory | 8.44% | 9.22% | 9.19% | 4.61% |
| Other Current Assets | 18.74% | 18.81% | 17.17% | 35.98% |
| Total Current Assets | 62.46% | 66.51% | 73.25% | 45.58% |
| Long-term Assets | 37.54% | 33.49% | 26.75% | 54.42% |
| Total Assets | 100.00% | 100.00% | 100.00% | 100.00% |
| Current Liabilities | 14.52% | 14.38% | 13.95% | 13.21% |
| Long-term Liabilities | 75.23% | 62.61% | 45.38% | 24.12% |
| Total Liabilities | 89.75% | 76.99% | 59.33% | 37.33% |
| Net Worth | 10.25% | 23.01% | 40.67% | 62.67% |
| Percent of Sales | ||||
| Sales | 100.00% | 100.00% | 100.00% | 100.00% |
| Gross Margin | 70.91% | 70.86% | 70.31% | 100.00% |
| Selling, General & Administrative Expenses | 46.09% | 47.32% | 36.86% | 72.94% |
| Advertising Expenses | 1.49% | 1.37% | 1.28% | 3.33% |
| Profit Before Interest and Taxes | 9.21% | 8.21% | 11.12% | 2.79% |
| Main Ratios | ||||
| Current | 4.30 | 4.62 | 5.25 | 2.20 |
| Quick | 3.72 | 3.98 | 4.59 | 1.43 |
| Total Debt to Total Assets | 89.75% | 76.99% | 59.33% | 56.31% |
| Pre-tax Return on Net Worth | 172.71% | 78.99% | 69.08% | 2.83% |
| Pre-tax Return on Assets | 17.70% | 18.17% | 28.09% | 6.48% |
| Additional Ratios | Year 1 | Year 2 | Year 3 | |
| Net Profit Margin | 4.42% | 4.17% | 6.58% | n.a |
| Return on Equity | 120.90% | 55.29% | 48.36% | n.a |
| Activity Ratios | ||||
| Inventory Turnover | 10.91 | 10.06 | 10.07 | n.a |
| Accounts Payable Turnover | 11.77 | 12.17 | 12.17 | n.a |
| Payment Days | 27 | 30 | 29 | n.a |
| Total Asset Turnover | 2.80 | 3.05 | 2.99 | n.a |
| Debt Ratios | ||||
| Debt to Net Worth | 8.76 | 3.35 | 1.46 | n.a |
| Current Liab. to Liab. | 0.16 | 0.19 | 0.24 | n.a |
| Liquidity Ratios | ||||
| Net Working Capital | $89,528 | $96,988 | $120,864 | n.a |
| Interest Coverage | 3.19 | 3.63 | 6.48 | n.a |
| Additional Ratios | ||||
| Assets to Sales | 0.36 | 0.33 | 0.33 | n.a |
| Current Debt/Total Assets | 15% | 14% | 14% | n.a |
| Acid Test | 3.72 | 3.98 | 4.59 | n.a |
| Sales/Net Worth | 27.33 | 13.27 | 7.35 | n.a |
| Dividend Payout | 0.00 | 0.00 | 0.00 | n.a |
Appendix
| Sales Forecast | |||||||||||||
| Month 1 | Month 2 | Month 3 | Month 4 | Month 5 | Month 6 | Month 7 | Month 8 | Month 9 | Month 10 | Month 11 | Month 12 | ||
| Sales | |||||||||||||
| Families with children | 0% | $1,200 | $1,200 | $4,000 | $4,000 | $4,000 | $2,800 | $2,500 | $2,200 | $2,800 | $2,200 | $2,200 | $2,200 |
| Senior Citizens | 0% | $2,000 | $2,000 | $2,000 | $2,000 | $2,000 | $2,000 | $2,000 | $2,000 | $2,000 | $2,000 | $2,000 | $2,000 |
| Youths | 0% | $500 | $600 | $720 | $864 | $1,037 | $1,244 | $1,493 | $1,792 | $2,150 | $2,580 | $3,096 | $2,500 |
| Leaguers | 0% | $0 | $0 | $4,400 | $4,400 | $4,400 | $4,400 | $2,200 | $2,200 | $2,200 | $6,600 | $6,600 | $6,600 |
| Food | 0% | $12,000 | $12,500 | $13,000 | $14,000 | $15,750 | $16,000 | $14,000 | $14,000 | $14,000 | $15,750 | $15,750 | $16,000 |
| Video Games | 0% | $1,000 | $1,200 | $1,750 | $2,800 | $2,500 | $2,000 | $2,000 | $2,200 | $2,800 | $2,400 | $2,200 | $2,000 |
| Pull Tabs | 0% | $12,000 | $12,000 | $12,000 | $12,000 | $12,000 | $7,500 | $10,000 | $12,000 | $15,000 | $14,000 | $12,000 | $8,000 |
| Liquor | 0% | $4,800 | $5,000 | $5,200 | $5,600 | $6,300 | $6,400 | $5,600 | $5,600 | $5,600 | $6,300 | $6,300 | $6,400 |
| Total Sales | $33,500 | $34,500 | $43,070 | $45,664 | $47,987 | $42,344 | $39,793 | $41,992 | $46,550 | $51,830 | $50,146 | $45,700 | |
| Direct Cost of Sales | Month 1 | Month 2 | Month 3 | Month 4 | Month 5 | Month 6 | Month 7 | Month 8 | Month 9 | Month 10 | Month 11 | Month 12 | |
| Families with children | $198 | $198 | $660 | $660 | $660 | $462 | $413 | $363 | $462 | $363 | $363 | $363 | |
| Senior Citizens | $294 | $294 | $294 | $294 | $294 | $294 | $294 | $294 | $294 | $294 | $294 | $294 | |
| Youths | $83 | $99 | $119 | $143 | $171 | $205 | $246 | $296 | $355 | $426 | $511 | $413 | |
| Leaguers | $0 | $0 | $726 | $726 | $726 | $726 | $363 | $363 | $363 | $1,089 | $1,089 | $1,089 | |
| Food | $7,980 | $8,313 | $8,645 | $9,310 | $10,474 | $10,640 | $9,310 | $9,310 | $9,310 | $10,474 | $10,474 | $10,640 | |
| Video Games | $0 | $0 | $0 | $0 | $0 | $0 | $0 | $0 | $0 | $0 | $0 | $0 | |
| Pull Tabs | $384 | $384 | $384 | $384 | $384 | $240 | $320 | $384 | $480 | $448 | $384 | $256 | |
| Liquor | $960 | $1,000 | $1,040 | $1,120 | $1,260 | $1,280 | $1,120 | $1,120 | $1,120 | $1,260 | $1,260 | $1,280 | |
| Subtotal Direct Cost of Sales | $9,899 | $10,288 | $11,868 | $12,637 | $13,969 | $13,847 | $12,066 | $12,130 | $12,384 | $14,353 | $14,375 | $14,335 | |
| Personnel Plan | |||||||||||||
| Month 1 | Month 2 | Month 3 | Month 4 | Month 5 | Month 6 | Month 7 | Month 8 | Month 9 | Month 10 | Month 11 | Month 12 | ||
| Manager | 0% | $3,000 | $3,000 | $3,000 | $3,000 | $3,000 | $3,000 | $3,000 | $3,000 | $3,000 | $3,000 | $3,000 | $3,000 |
| Assistant Manager | 0% | $0 | $0 | $0 | $0 | $0 | $0 | $0 | $0 | $0 | $0 | $0 | $0 |
| Chef | 0% | $2,750 | $2,750 | $2,750 | $2,750 | $2,750 | $2,750 | $2,750 | $2,750 | $2,750 | $2,750 | $2,750 | $2,750 |
| Sous Chef | 0% | $2,500 | $2,500 | $2,500 | $2,500 | $2,500 | $2,500 | $2,500 | $2,500 | $2,500 | $2,500 | $2,500 | $2,500 |
| Bus boy/Dishwasher | 0% | $2,000 | $2,000 | $2,000 | $2,000 | $2,000 | $2,000 | $2,000 | $2,000 | $2,000 | $2,000 | $2,000 | $2,000 |
| Lane Maintenance | 0% | $640 | $640 | $640 | $640 | $640 | $640 | $640 | $640 | $640 | $640 | $640 | $640 |
| League Manager | 0% | $640 | $640 | $640 | $640 | $640 | $640 | $640 | $640 | $640 | $640 | $640 | $640 |
| Cashier/Front Desk | 0% | $2,500 | $2,500 | $2,500 | $2,500 | $2,500 | $2,500 | $2,500 | $2,500 | $2,500 | $2,500 | $2,500 | $2,500 |
| Bartender | 0% | $1,120 | $1,120 | $1,120 | $1,120 | $1,120 | $1,120 | $1,120 | $1,120 | $1,120 | $1,120 | $1,120 | $1,120 |
| Total People | 8 | 8 | 8 | 8 | 8 | 8 | 8 | 8 | 8 | 8 | 8 | 8 | |
| Total Payroll | $15,150 | $15,150 | $15,150 | $15,150 | $15,150 | $15,150 | $15,150 | $15,150 | $15,150 | $15,150 | $15,150 | $15,150 | |
| Pro Forma Profit and Loss | |||||||||||||
| Month 1 | Month 2 | Month 3 | Month 4 | Month 5 | Month 6 | Month 7 | Month 8 | Month 9 | Month 10 | Month 11 | Month 12 | ||
| Sales | $33,500 | $34,500 | $43,070 | $45,664 | $47,987 | $42,344 | $39,793 | $41,992 | $46,550 | $51,830 | $50,146 | $45,700 | |
| Direct Cost of Sales | $9,899 | $10,288 | $11,868 | $12,637 | $13,969 | $13,847 | $12,066 | $12,130 | $12,384 | $14,353 | $14,375 | $14,335 | |
| Other | $0 | $0 | $0 | $0 | $0 | $0 | $0 | $0 | $0 | $0 | $0 | $0 | |
| Total Cost of Sales | $9,899 | $10,288 | $11,868 | $12,637 | $13,969 | $13,847 | $12,066 | $12,130 | $12,384 | $14,353 | $14,375 | $14,335 | |
| Gross Margin | $23,602 | $24,213 | $31,202 | $33,027 | $34,018 | $28,497 | $27,727 | $29,862 | $34,166 | $37,476 | $35,771 | $31,366 | |
| Gross Margin % | 70.45% | 70.18% | 72.45% | 72.33% | 70.89% | 67.30% | 69.68% | 71.11% | 73.40% | 72.31% | 71.33% | 68.63% | |
| Expenses | |||||||||||||
| Payroll | $15,150 | $15,150 | $15,150 | $15,150 | $15,150 | $15,150 | $15,150 | $15,150 | $15,150 | $15,150 | $15,150 | $15,150 | |
| Marketing/Promotion | $1,500 | $137 | $137 | $137 | $137 | $137 | $137 | $137 | $137 | $137 | $137 | $130 | |
| Depreciation | $649 | $649 | $649 | $649 | $649 | $649 | $649 | $649 | $649 | $649 | $649 | $649 | |
| Rent | $10,000 | $10,000 | $10,000 | $0 | $10,000 | $10,000 | $10,000 | $10,000 | $10,000 | $10,000 | $10,000 | $10,000 | |
| Utilities | $280 | $280 | $280 | $280 | $280 | $280 | $280 | $280 | $280 | $280 | $280 | $280 | |
| Insurance | $200 | $200 | $200 | $200 | $200 | $200 | $200 | $200 | $200 | $200 | $200 | $200 | |
| Payroll Taxes | 15% | $0 | $0 | $0 | $0 | $0 | $0 | $0 | $0 | $0 | $0 | $0 | $0 |
| Shoe Repair and maintenance | 0% | $200 | $200 | $200 | $200 | $200 | $200 | $200 | $200 | $200 | $200 | $200 | $200 |
| Pull Tabs | 15% | $500 | $500 | $500 | $500 | $500 | $500 | $500 | $500 | $500 | $500 | $500 | $500 |
| Video Game Rentals | $500 | $500 | $500 | $500 | $500 | $500 | $500 | $500 | $500 | $500 | $500 | $500 | |
| Total Operating Expenses | $28,979 | $27,616 | $27,616 | $17,616 | $27,616 | $27,616 | $27,616 | $27,616 | $27,616 | $27,616 | $27,616 | $27,609 | |
| Profit Before Interest and Taxes | ($5,378) | ($3,404) | $3,586 | $15,411 | $6,402 | $881 | $111 | $2,246 | $6,550 | $9,860 | $8,155 | $3,757 | |
| EBITDA | ($4,729) | ($2,755) | $4,235 | $16,060 | $7,051 | $1,530 | $760 | $2,895 | $7,199 | $10,509 | $8,804 | $4,406 | |
| Interest Expense | $1,350 | $1,333 | $1,317 | $1,301 | $1,285 | $1,268 | $1,252 | $1,236 | $1,220 | $1,203 | $1,187 | $1,171 | |
| Taxes Incurred | ($2,018) | ($1,421) | $681 | $4,233 | $1,535 | ($116) | ($342) | $303 | $1,599 | $2,597 | $2,090 | $776 | |
| Net Profit | ($4,709) | ($3,316) | $1,588 | $9,877 | $3,582 | ($271) | ($799) | $707 | $3,731 | $6,060 | $4,878 | $1,810 | |
| Net Profit/Sales | -14.06% | -9.61% | 3.69% | 21.63% | 7.46% | -0.64% | -2.01% | 1.68% | 8.02% | 11.69% | 9.73% | 3.96% | |
| Pro Forma Cash Flow | |||||||||||||
| Month 1 | Month 2 | Month 3 | Month 4 | Month 5 | Month 6 | Month 7 | Month 8 | Month 9 | Month 10 | Month 11 | Month 12 | ||
| Cash Received | |||||||||||||
| Cash from Operations | |||||||||||||
| Cash Sales | $33,500 | $34,500 | $43,070 | $45,664 | $47,987 | $42,344 | $39,793 | $41,992 | $46,550 | $51,830 | $50,146 | $45,700 | |
| Subtotal Cash from Operations | $33,500 | $34,500 | $43,070 | $45,664 | $47,987 | $42,344 | $39,793 | $41,992 | $46,550 | $51,830 | $50,146 | $45,700 | |
| Additional Cash Received | |||||||||||||
| Sales Tax, VAT, HST/GST Received | 0.00% | $0 | $0 | $0 | $0 | $0 | $0 | $0 | $0 | $0 | $0 | $0 | $0 |
| New Current Borrowing | $0 | $0 | $0 | $0 | $0 | $0 | $0 | $0 | $0 | $0 | $0 | $0 | |
| New Other Liabilities (interest-free) | $0 | $0 | $0 | $0 | $0 | $0 | $0 | $0 | $0 | $0 | $0 | $0 | |
| New Long-term Liabilities | $0 | $0 | $0 | $0 | $0 | $0 | $0 | $0 | $0 | $0 | $0 | $0 | |
| Sales of Other Current Assets | $0 | $0 | $0 | $0 | $0 | $0 | $0 | $0 | $0 | $0 | $0 | $0 | |
| Sales of Long-term Assets | $0 | $0 | $0 | $0 | $0 | $0 | $0 | $0 | $0 | $0 | $0 | $0 | |
| New Investment Received | $0 | $0 | $0 | $0 | $0 | $0 | $0 | $0 | $0 | $0 | $0 | $0 | |
| Subtotal Cash Received | $33,500 | $34,500 | $43,070 | $45,664 | $47,987 | $42,344 | $39,793 | $41,992 | $46,550 | $51,830 | $50,146 | $45,700 | |
| Expenditures | Month 1 | Month 2 | Month 3 | Month 4 | Month 5 | Month 6 | Month 7 | Month 8 | Month 9 | Month 10 | Month 11 | Month 12 | |
| Expenditures from Operations | |||||||||||||
| Cash Spending | $15,150 | $15,150 | $15,150 | $15,150 | $15,150 | $15,150 | $15,150 | $15,150 | $15,150 | $15,150 | $15,150 | $15,150 | |
| Bill Payments | $877 | $26,170 | $22,611 | $27,201 | $21,141 | $29,958 | $26,554 | $22,924 | $25,614 | $27,460 | $32,049 | $29,444 | |
| Subtotal Spent on Operations | $16,027 | $41,320 | $37,761 | $42,351 | $36,291 | $45,108 | $41,704 | $38,074 | $40,764 | $42,610 | $47,199 | $44,594 | |
| Additional Cash Spent | |||||||||||||
| Sales Tax, VAT, HST/GST Paid Out | $0 | $0 | $0 | $0 | $0 | $0 | $0 | $0 | $0 | $0 | $0 | $0 | |
| Principal Repayment of Current Borrowing | $0 | $0 | $0 | $0 | $0 | $0 | $0 | $0 | $0 | $0 | $0 | $0 | |
| Other Liabilities Principal Repayment | $0 | $0 | $0 | $0 | $0 | $0 | $0 | $0 | $0 | $0 | $0 | $0 | |
| Long-term Liabilities Principal Repayment | $1,950 | $1,950 | $1,950 | $1,950 | $1,950 | $1,950 | $1,950 | $1,950 | $1,950 | $1,950 | $1,950 | $1,950 | |
| Purchase Other Current Assets | $0 | $0 | $0 | $0 | $0 | $0 | $0 | $0 | $0 | $0 | $0 | $0 | |
| Purchase Long-term Assets | $0 | $0 | $0 | $0 | $0 | $0 | $0 | $0 | $0 | $0 | $0 | $0 | |
| Dividends | $0 | $0 | $0 | $0 | $0 | $0 | $0 | $0 | $0 | $0 | $0 | $0 | |
| Subtotal Cash Spent | $17,977 | $43,270 | $39,711 | $44,301 | $38,241 | $47,058 | $43,654 | $40,024 | $42,714 | $44,560 | $49,149 | $46,544 | |
| Net Cash Flow | $15,523 | ($8,770) | $3,359 | $1,363 | $9,746 | ($4,714) | ($3,861) | $1,968 | $3,836 | $7,270 | $996 | ($844) | |
| Cash Balance | $55,523 | $46,754 | $50,113 | $51,476 | $61,221 | $56,507 | $52,646 | $54,614 | $58,450 | $65,719 | $66,716 | $65,872 | |
| Pro Forma Balance Sheet | |||||||||||||
| Month 1 | Month 2 | Month 3 | Month 4 | Month 5 | Month 6 | Month 7 | Month 8 | Month 9 | Month 10 | Month 11 | Month 12 | ||
| Assets | Starting Balances | ||||||||||||
| Current Assets | |||||||||||||
| Cash | $40,000 | $55,523 | $46,754 | $50,113 | $51,476 | $61,221 | $56,507 | $52,646 | $54,614 | $58,450 | $65,719 | $66,716 | $65,872 |
| Inventory | $7,000 | $10,888 | $11,316 | $13,055 | $13,900 | $15,366 | $15,232 | $13,272 | $13,343 | $13,622 | $15,789 | $15,812 | $15,768 |
| Other Current Assets | $35,000 | $35,000 | $35,000 | $35,000 | $35,000 | $35,000 | $35,000 | $35,000 | $35,000 | $35,000 | $35,000 | $35,000 | $35,000 |
| Total Current Assets | $82,000 | $101,412 | $93,070 | $98,168 | $100,376 | $111,587 | $106,739 | $100,918 | $102,956 | $107,072 | $116,508 | $117,528 | $116,640 |
| Long-term Assets | |||||||||||||
| Long-term Assets | $77,900 | $77,900 | $77,900 | $77,900 | $77,900 | $77,900 | $77,900 | $77,900 | $77,900 | $77,900 | $77,900 | $77,900 | $77,900 |
| Accumulated Depreciation | $0 | $649 | $1,298 | $1,947 | $2,596 | $3,245 | $3,894 | $4,543 | $5,192 | $5,841 | $6,490 | $7,139 | $7,788 |
| Total Long-term Assets | $77,900 | $77,251 | $76,602 | $75,953 | $75,304 | $74,655 | $74,006 | $73,357 | $72,708 | $72,059 | $71,410 | $70,761 | $70,112 |
| Total Assets | $159,900 | $178,663 | $169,672 | $174,121 | $175,680 | $186,242 | $180,745 | $174,275 | $175,664 | $179,131 | $187,918 | $188,289 | $186,752 |
| Liabilities and Capital | Month 1 | Month 2 | Month 3 | Month 4 | Month 5 | Month 6 | Month 7 | Month 8 | Month 9 | Month 10 | Month 11 | Month 12 | |
| Current Liabilities | |||||||||||||
| Accounts Payable | $0 | $25,422 | $21,697 | $26,507 | $20,139 | $29,069 | $25,793 | $22,072 | $24,704 | $26,389 | $31,066 | $28,509 | $27,112 |
| Current Borrowing | $0 | $0 | $0 | $0 | $0 | $0 | $0 | $0 | $0 | $0 | $0 | $0 | $0 |
| Other Current Liabilities | $0 | $0 | $0 | $0 | $0 | $0 | $0 | $0 | $0 | $0 | $0 | $0 | $0 |
| Subtotal Current Liabilities | $0 | $25,422 | $21,697 | $26,507 | $20,139 | $29,069 | $25,793 | $22,072 | $24,704 | $26,389 | $31,066 | $28,509 | $27,112 |
| Long-term Liabilities | $163,900 | $161,950 | $160,000 | $158,050 | $156,100 | $154,150 | $152,200 | $150,250 | $148,300 | $146,350 | $144,400 | $142,450 | $140,500 |
| Total Liabilities | $163,900 | $187,372 | $181,697 | $184,557 | $176,239 | $183,219 | $177,993 | $172,322 | $173,004 | $172,739 | $175,466 | $170,959 | $167,612 |
| Paid-in Capital | $60,000 | $60,000 | $60,000 | $60,000 | $60,000 | $60,000 | $60,000 | $60,000 | $60,000 | $60,000 | $60,000 | $60,000 | $60,000 |
| Retained Earnings | ($64,000) | ($64,000) | ($64,000) | ($64,000) | ($64,000) | ($64,000) | ($64,000) | ($64,000) | ($64,000) | ($64,000) | ($64,000) | ($64,000) | ($64,000) |
| Earnings | $0 | ($4,709) | ($8,025) | ($6,436) | $3,441 | $7,023 | $6,752 | $5,953 | $6,660 | $10,392 | $16,452 | $21,330 | $23,140 |
| Total Capital | ($4,000) | ($8,709) | ($12,025) | ($10,436) | ($559) | $3,023 | $2,752 | $1,953 | $2,660 | $6,392 | $12,452 | $17,330 | $19,140 |
| Total Liabilities and Capital | $159,900 | $178,663 | $169,672 | $174,121 | $175,680 | $186,242 | $180,745 | $174,275 | $175,664 | $179,131 | $187,918 | $188,289 | $186,752 |
| Net Worth | ($4,000) | ($8,709) | ($12,025) | ($10,436) | ($559) | $3,023 | $2,752 | $1,953 | $2,660 | $6,392 | $12,452 | $17,330 | $19,140 |

