
Concrete Carbon Parts
Executive Summary
Concrete Carbon Parts (Concrete Carbon) is a California-based company that designs and sells a variety of carbon fiber seatposts for road and mountain bicycles. The company was formed as a California L.L.C. and has operated out of the owner’s home for the last year. The company has sold the seatposts via the Internet to individual customers, and the owner wants to take the company to the next step.
The Products
Concrete Carbon sells high-end carbon fiber seatposts. The shafts will be made out of custom drawn carbon fiber and the head unit will be CNC machined out of 6000 series aluminium. Through extensive torture testing, Josh has developed a design of posts that achieve a barrier of safety that has yet to be reached by any competing product. Concrete Carbon is able to offer a high-end seatpost for both road and mountain cycling applications that are among the lightest available, quite comfortable due to carbon fiber’s natural ability to disperse vibrations, and are completely safe. Concrete Carbon has yet to have a seatpost fail.
Concrete Carbon’s competitive edge is based on its product, it is able to offer a range of posts to properly fit each individual rider. The range of posts are based on rider weight. There are no other manufacturers offering custom fitting. This is quite valuable as the ride, safety margin, and weight are all significantly effected by the way the post is tuned. With the post custom tuned to a rider’s weight range, the weight will only be as much as it needs to be in terms of safety and the ride quality will be optimized by allowing a sufficient amount of flex to occur, dampening road and trail vibrations. The flex associated with the post is so much that it is positively likened to a form of suspension.
Concrete Carbon will employ an outsource model for production to allow Concrete Carbon to concentrate on what it does best, serve the customer. Production will be outsourced to two leaders within their respective industries. Josh provides the subcontractors will all the design details and they will make the parts to specification. The subcontractors were chosen in part on Josh’s networking contacts established with them prior to Concrete Carbon. They were also chosen on their ability to scale production when needed.
The Market
Concrete Carbon currently sells seatposts directly to individual consumers. In order to grow the business, Concrete Carbon needs to begin selling to new customers. It has decided to begin selling to distributors. The annual growth rate for individual customers is 10% with 343,009 potential customers. The growth rate for distributors is 4% with 14 potential customers. While the growth rate of distributors is not that high the sheer volume that distributors will sell and buy relative to the individuals makes the potential market very exciting.
Marketing
Concrete Carbon will employ two somewhat distinct marketing strategies to reach its perspective customer segments. The first strategy uses the website to raise awareness of Concrete Carbon’s parts to individual consumers. The website has been up for a year and there will be continual improvements made to it. Concrete Carbon will be quite active at the various industry trade shows to develop sales relationships with the different distributors. The trade shows are the most effective place to develop close relationships with new and perspective distributors. Since the business relationships are based on trust, participation at the shows will allow Concrete Carbon to invest a lot of trust into many different relationships.
Sales will reach $119,000 in Year 1, rising to $332,000 by Year 3. Over the next three years, Concrete Carbon Parts will steadily increase profitability and gross margins.

1.1 Keys to Success
- Precisely engineered products.
- Follow through on all commitments, both to vendors and customers.
- Strict financial controls.
1.2 Mission
It is Concrete Carbon Parts’ mission to create the finest quality carbon seatposts on the market. It will emphasize lightweight, comfort and a realistic safety margin for all of our products.
1.3 Objectives
- To become the premier carbon seatpost bicycle manufacturer.
- Increase sales to make Concrete Carbon a sustainable business.
- Significantly increase sales by creating a new market segment of customers.
Company Summary
Concrete Carbon is a California-based L.L.C. that was started by Josh Plastic. The company began as a “home based” venture with Josh selling directly to consumers. Josh is ready to take it to the next level by hiring new people and selling to distributors in addition to direct to the consumer.
Concrete Carbon will use an outsource model for production. The product designs have been created and formalized. Concrete Carbon supplies its two subcontractors with the design specifications and the posts will be made to order. The final assembly will be done in-house. Concrete Carbon will employ an outsource model in order to keep capital expenditures down. Additionally, Concrete Carbon is able to leverage valuable industry relationships to confidently have a third party manufacturer the components of the seatpost. The vendor relationships all have delivery terms included in the contracts. Concrete Carbon typically has two weeks of inventory and the vendors have contractual obligations of three – four week delivery times.
2.1 Company History
The company has operated out of Josh’s home for about a year.
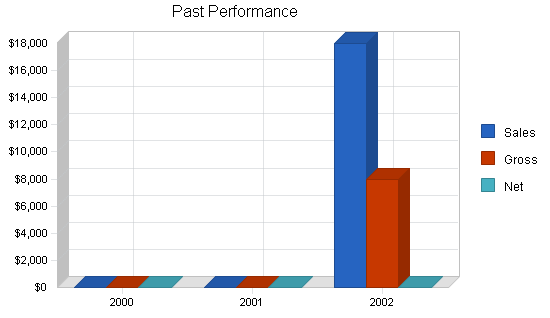
| Past Performance | |||
| 2000 | 2001 | 2002 | |
| Sales | $0 | $0 | $18,000 |
| Gross Margin | $0 | $0 | $8,000 |
| Gross Margin % | 0.00% | 0.00% | 44.44% |
| Operating Expenses | $0 | $0 | $1,500 |
| Collection Period (days) | 0 | 0 | 0 |
| Inventory Turnover | 0.00 | 0.00 | 50.00 |
| Balance Sheet | |||
| 2000 | 2001 | 2002 | |
| Current Assets | |||
| Cash | $0 | $0 | $5,455 |
| Accounts Receivable | $0 | $0 | $0 |
| Inventory | $0 | $0 | $400 |
| Other Current Assets | $0 | $0 | $800 |
| Total Current Assets | $0 | $0 | $6,655 |
| Long-term Assets | |||
| Long-term Assets | $0 | $0 | $1,000 |
| Accumulated Depreciation | $0 | $0 | $0 |
| Total Long-term Assets | $0 | $0 | $1,000 |
| Total Assets | $0 | $0 | $7,655 |
| Current Liabilities | |||
| Accounts Payable | $0 | $0 | $987 |
| Current Borrowing | $0 | $0 | $0 |
| Other Current Liabilities (interest free) | $0 | $0 | $0 |
| Total Current Liabilities | $0 | $0 | $987 |
| Long-term Liabilities | $0 | $0 | $0 |
| Total Liabilities | $0 | $0 | $987 |
| Paid-in Capital | $0 | $0 | $0 |
| Retained Earnings | $0 | $0 | $6,668 |
| Earnings | $0 | $0 | $0 |
| Total Capital | $0 | $0 | $6,668 |
| Total Capital and Liabilities | $0 | $0 | $7,655 |
| Other Inputs | |||
| Payment Days | 0 | 0 | 0 |
| Sales on Credit | $0 | $0 | $0 |
| Receivables Turnover | 0.00 | 0.00 | 0.00 |
2.2 Company Ownership
Josh Plastic is the main owner of Concrete Carbon. Josh does a have a passive investor.
Products
Concrete Carbon sells carbon fiber bicycle seatposts. Carbon fiber is the ideal material for this application because of its lightweight, ability to dampen road vibrations and the ability to structurally engineer the material for the specific application. Concrete Carbon will offer one diameter for the seatposts, 27.2, the most standard size. For bicycles that use odd sizes, Concrete Carbon will offer shims. The post is made in 250 mm and 400 mm lengths for road bikes and mountain bikes respectively. It will also come in three weight classes, a post for rider weights of <150 lbs, 150-190 lbs, and >190 lbs. The unit will come with a five year warranty. The post will utilize a carbon fibre shaft with a CNC (computer numeric controlled) machined head by Paul Components. CNC is the perfect fabrication technique because it allows small production runs, precise manufacturing, and there are plenty of subcontractors that can provide the machining. The head will be bonded to the shaft using a Loctite brand adhesive. The shaft will be made to specifications by Advanced Composite Technologies. Both vendors were chosen based on prior relationships/networking that Josh has developed. Since Josh owns the technical designs and specifications of his products, if necessary he would be able to take his design to different subcontractors.
As mentioned earlier, a CNC machining is the perfect fabrication technique. CNC uses a computer controlled lathe that is able to take a block of aluminium and through 3D machining, turns the chunk of metal into whatever the computer design indicates. Production runs can be as low as a couple and modifications can be made within a production run. Forged aluminum heads are only cost effective when production runs are double digit thousands.
Brought to you by
Create a professional business plan
Using AI and step-by-step instructions
Create Your PlanSecure funding
Validate ideas
Build a strategy
All of the products and designs have undergone rigorous product torture testing. The product testing has served two distinct functions. The first goal is that it aids the design development because it provides invaluable information as to where and how the post will fail under adverse conditions. This information is then taken back to the design board. It also serves as an inexpensive way to significantly minimize the risk of a product liability suit. Engineering the product so it does not fail is key to the survival of this business.
Carbon fiber construction is the ideal manufacturing technique because of the high strength, the ability to design in structural elements as a function of the different resins used, and the orientation of the lay up. Carbon fiber (sometimes called graphite fiber) possesses both high fiber modulus (<33 to 120+ Msi), and high fiber strength (<200 to 1000+ Ksi). Carbon fiber can be made from a variety of organic or petroleum polymer fibers. Most commonly, it is made from either of two precursor materials: pitch or polyacrylonitrile (PAN). Most intermediate modulus fiber is made from PAN, while pitch is used for the production of high modulus fibers. The precursor material is spun into fibers and processed in three steps: oxidation, carbonization, and graphitization. This processing forms a turbostratic graphitic structure in which graphitic crystallites are aligned with the fiber axis and intermingled with each other.
The processing of carbon fibers produces three types of fiber: “High Modulus” fibers with marginal strength and marginal elongation to failure, “Intermediate Modulus, Intermediate Strength” fibers with higher elongation to failure, and “High Strength” fibers with marginal modulus and marginal elongation to failure.
The fibers themselves are manufactured by extruding some precursor or melt material through tiny orifices to form a fiber, and then stretching and heat or chemically processing the fibers to orient the microstructure and produce the desired properties. The fibers are then bundled into rovings, which can consist of many thousands of individual fibers, and the rovings are spooled or woven into. The cloth or roving can be impregnated with the uncured matrix material to form prepreg.
Market Analysis Summary
Concrete Carbon has identified two distinct market segments, individual consumers and distributors. Concrete Carbon has been servicing individual consumers now for the last year and will be adding distributors as customers. It will be quite easy to differentiate between the two groups of customers. Individual sales will be derived via the Internet, and sales to distributors will be accomplished through participation at the industry trade shows.
4.1 Market Segmentation
Concrete Carbon has segmented the market into two customers:
- Individuals consumers: products will be sold direct to the consumer via the website. This is the customer group that Concrete Carbon has been serving now for the last year. The typical customer is someone who rides a couple of thousand of miles a year, either with a team or a club. The retail value of their bicycle is at least $1,800. The average household income is >$40,000. 64% have a college education. This group enjoys cycling and spends a decent amount of their disposable income on their passion.
- Distributors: these are the middle layer of the distribution system. They sell to the independent bicycle retailer. The main distributors are Quality, Seattle Bike Supply, and Riteway.
| Market Analysis | |||||||
| 2003 | 2004 | 2005 | 2006 | 2007 | |||
| Potential Customers | Growth | CAGR | |||||
| Individuals | 10% | 343,009 | 377,310 | 415,041 | 456,545 | 502,200 | 10.00% |
| Distibutors | 4% | 14 | 15 | 16 | 17 | 18 | 6.48% |
| Total | 10.00% | 343,023 | 377,325 | 415,057 | 456,562 | 502,218 | 10.00% |
4.2 Target Market Segment Strategy
Concrete Carbon’s strategy for segmentation is fairly straight forward. Individuals will be targeted through a sales campaign on the website. The individual customers are important because they are the ones served up until now. Additionally, the profit margin is higher (although quantity is less) since there is no distribution layer. In this case Concrete Carbon will service the existing customer group.
Distributor customers will be targeted trough deals and relationships set up through industry trade shows. While the margins are lower for this customer group, distributors are able to purchase far greater quantity of products. They also assist in the selling of the product to the independent bicycle retailers, who then help sell it to the end consumer.
4.3 Industry Analysis
The bicycle part industry is generally a three layered system (manufacturer, distributor, retailer). Some manufacturers sell directly to the consumer, but most do not. Within the last four years the industry has seen more direct marketing manufacturers, to a large degree a function of the operating efficiencies of the Internet.
4.3.1 Competition and Buying Patterns
There are three main competitors and a few smaller manufacturers who are competitors.
- LP Composites (WA): this company manufactures seatposts, handlebars, and bar ends. LP’s products are decent but nothing special. They look cool, but are not super light and are not innovative in terms of manufacturing. This is small company with a regional sales base.
- U.S.E. (England): this company is known primarily for their suspension seatposts, but have just come out with a new ultra light carbon fiber seat post. The unit is quite light but the clamping head, while light, is difficult to adjust.
- Easton (CA): Easton is a huge sport conglomerate that is a manufacturer of aluminium and now carbon fiber tubes for bicycle frames and components. Additionally, they make baseball bats, tent poles, shafts for golf clubs and hockey stick shafts, etc. Relating to the bicycle industry, they have been manufacturing frame materials for a while and only within the last few years have they made bicycle components. They have a good reputation, however, they recently have gotten some bad press due to a catastrophic failure of one of their seatposts in a race being used by a popular athlete.
For many consumers, their buying pattern is the purchase of a carbon fiber seatpost based on the material of the post instead of differentiation between the different brands.
Strategy and Implementation Summary
Concrete Carbon will be leveraging its competitive edge of customization of its product for different riders. This will offer differentiation between the competitors, something that will be emphasized in the marketing materials. The products will be marketed via the Internet for the individual customers and through trade shows for the distributors. The sales strategy will rely communication of the fact that Concrete Carbon’s products are lightweight, safe, high end bicycle seatposts. The sales campaign will also stress the ability of Concrete Carbon to replenish distributor’s stock of the seatposts quickly and as promised.
5.1 Competitive Edge
Concrete Carbon’s competitive edge is its product offering that is customized to the weight and aggressiveness of the rider. Every other manufacturer has only one carbon seatpost with the only variation on length. No body else offers distinct products for different riders. The competitors have only one product that generally has a weight limit.
Concrete Carbon’s three different posts are made for different weight groups. By increasing the amount of material in key areas, Concrete Carbon is able to make a posts for all weight riders with a huge safety margin. Concrete Carbon is keenly aware of the liability risks involved with a product liability suit. Having specific posts for specific riders is a competitive advantage because it provides the rider with the lightest weight post that they can ride safely. It also provides them with the most comfortable riding post. If a light weight rider is using a stout post it will feel quite stiff and all of the road vibrations will be transferred. Conversely, if a heavy rider is using a post that is too light for him, it will not be stiff enough, flexing like a noodle under stress.
Brought to you by
Create a professional business plan
Using AI and step-by-step instructions
Create Your PlanSecure funding
Validate ideas
Build a strategy
5.2 Marketing Strategy
Concrete Carbon will use a different marketing strategy based on the two different market segments that it seeks to reach. Marketing for the individual consumers will be done primarily over the Internet. While Concrete Carbon will use some magazine advertisement space, the main effort will focus on promoting the website through good positioning on search engines as well as pay per click advertising. Pay per click advertising is a system of advertising that is done through search engines where payment is made to a search engine such as Google whenever the search engine refers a person to Concrete Carbon’s site based on the keyword that they entered into the search engine.
Participation in the industry trade shows will be the key marketing effort for the distributors. There are two main shows and 80% of industry business is transacted at the shows, for manufacturers, distributors, and retailers. No one who is seriously participating in the industry misses these shows. The shows provide Concrete Carbon with an opportunity to show off its product to the distributor as well as establish as relationship with them (especially important in light of the fact that most of the distributors are not in the same state as Concrete Carbon). Therefore, the shows will receive a lot of attention by Concrete Carbon based on the recognition that this is where the deals are made and relationships established.
5.3 Sales Strategy
Individual customers
The sales focus for this group will be the conversion of qualified leads through the emphasis of the products being customer designed for the specific customer, combining comfort, lightweight, and a wide safety margin. This will help differentiate Concrete Carbon’s products from the competition. Concerns about durability will be eliminated by the industry’s best warranty of five years.
Distributors
The sales strategy for the distributors will be quite different. It will emphasize a close relationship between the distributor and Concrete Carbon. This is very important because it is of great concern to a distributor for them to carry and feature a manufacturer who has delivery or warranty problems. Distributors are sensitive to the issue of availability of the product from the company. Concrete Carbon will work hard on convincing distributors that it will be able to meet all of the needs of the distributor, that production can be scaled quickly if necessary, and that Concrete Carbon is quick to fill orders, allowing the distributor not to have to keep a large inventory of the product out of fear of not being able to fulfill orders from a bicycle retailer. Lastly, Concrete Carbon will work on impressing the distributors at the shows that they are making a high-quality product with a low failure rate and that if any warranty claims are made they will be addressed quickly and happily. This is in recognition that sales are made based on relationships, as much or more so relative to the actual products.
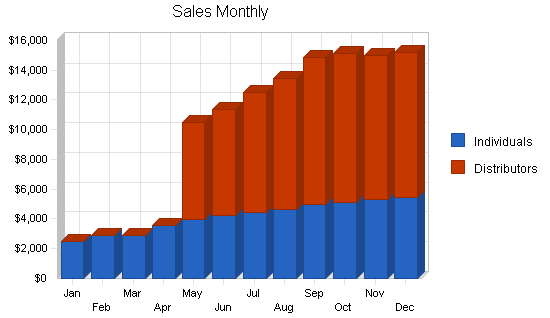
5.3.1 Sales Forecast
Sales have been fairly slow and steady for the last year. With the Bicycle Industry Trade show coming up in March, sales are forecasted to increase from the distributors that month or the following month. With more retailers carrying the seatposts, there will be greater visibility of the products and it is reasonable to believe that individual sales will also increase.
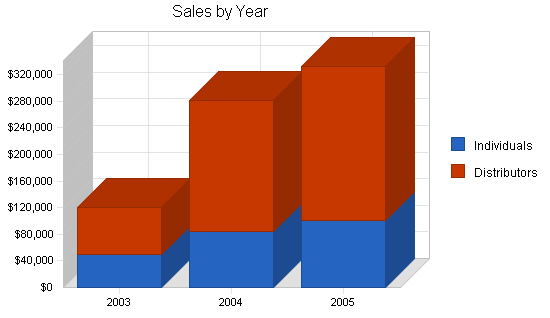
| Sales Forecast | |||
| 2003 | 2004 | 2005 | |
| Sales | |||
| Individuals | $49,984 | $84,343 | $101,212 |
| Distributors | $69,837 | $196,560 | $231,212 |
| Total Sales | $119,821 | $280,903 | $332,424 |
| Direct Cost of Sales | 2003 | 2004 | 2005 |
| Individuals | $22,493 | $37,954 | $45,545 |
| Distributors | $48,188 | $135,626 | $159,536 |
| Subtotal Direct Cost of Sales | $70,680 | $173,581 | $205,082 |
5.4 Milestones
Concrete Carbon has identified several milestones that need to be accomplished. The following chart will indicate the dates for which the work to achieve them will begin, when the milestone is likely to be achieved, and who is responsible for the milestone.
| Milestones | |||||
| Milestone | Start Date | End Date | Budget | Manager | Department |
| Business plan completion | 1/1/2003 | 2/1/2003 | $0 | Josh | Strategic Op |
| First distributor sale | 3/15/2003 | 4/15/2003 | $0 | Josh | Sales |
| Profitability (inc/distributors) | 3/15/2003 | 8/30/2003 | $0 | Josh | Accounting |
| Yearly sales >$250K | 1/1/2002 | 12/30/2004 | $0 | Josh | Sales |
| Totals | $0 | ||||
Web Plan Summary
Concrete Carbon has a fully implemented website that is generally accessed by individual customers. The purpose of the site is to provide sufficient information regarding the products to make sales. The website does not support online commerce, customers must speak to a human in order to place an order.
6.1 Website Marketing Strategy
Concrete Carbon has been employing pay-per-clicks for the last year through the Google Search engine. This puts Concrete Carbon high up on the hits list when an Internet user types specific words into Google in the search for seatposts, bike parts, etc. This strategy will be continued.
6.2 Development Requirements
As indicated earlier, the site has already been developed.
Management Summary
The backbone and leader of Concrete Carbon is Josh Plastic. Josh received a dual degree from UC Berkeley, one in business, the second in mechanical engineering. These degrees were chosen because of Josh’s interest in parts construction and general engineering theories and application. With this in mind, Josh also thought that it would be constructive for him to have a business background for possible future application.
Being an active cyclist, Josh was interested in working within the bicycle industry. Josh found an internship at Paul’s Components. The duration of the internship was for five months with the possibility of turning into a full-time position. The internship, which was based on CNC machining went well. It was clear that Josh’s aptitude exceeded the CNC machining and at the end of the internship he accepted a job offer to work in the product design group. The jump from CNC machining into product design was warranted based on Josh’s knowledge and degree in mechanical engineering. Josh worked at Paul’s for three years. At the end he was the head designer of their brake group. One of his accomplishments was the design of Paul’s Crosstop brake that uses the IRD’s widget design, the precursor to V brakes.
Josh’s experience at Paul’s confirmed his desire to work in the bike industry. It also confirmed his desire to look for work that provided him more autonomy. Josh left Paul’s and started Concrete Carbon based on an outsourcing model where he could have all parts outsourced, made to spec, thereby reducing his start-up costs. As long as he maintained a good relationship with his suppliers, Josh felt that this model could be easily scaled once he was ready to sell to distributors in addition to individual customers.
7.1 Personnel Plan
Currently, the organization is being run by Josh solely. He has already designed the products so he is in charge of product procurement, order taking, customer service, and assorted other activities. As Josh travels to the trade shows as well as ramping up sales to accommodate the distributor sales, Josh will bring on an employee to assist him. The employee will do a wide range of activities from administrative support to order taking, customer service, post assembly, and order fulfillment. By bringing on the employee, it will help free up Josh’s time to really increase sales with the distributors.
| Personnel Plan | |||
| 2003 | 2004 | 2005 | |
| Josh | $24,000 | $33,000 | $45,000 |
| Employee #1 | $17,500 | $26,400 | $28,000 |
| Total People | 2 | 2 | 2 |
| Total Payroll | $41,500 | $59,400 | $73,000 |
Brought to you by
Create a professional business plan
Using AI and step-by-step instructions
Create Your PlanSecure funding
Validate ideas
Build a strategy
Financial Plan
The following sections will outline important Financial Information.
8.1 Important Assumptions
The following table details important Financial Assumptions.
| General Assumptions | |||
| 2003 | 2004 | 2005 | |
| Plan Month | 1 | 2 | 3 |
| Current Interest Rate | 10.00% | 10.00% | 10.00% |
| Long-term Interest Rate | 10.00% | 10.00% | 10.00% |
| Tax Rate | 30.00% | 30.00% | 30.00% |
| Other | 0 | 0 | 0 |
8.2 Break-even Analysis
The Break-even Analysis is shown below.
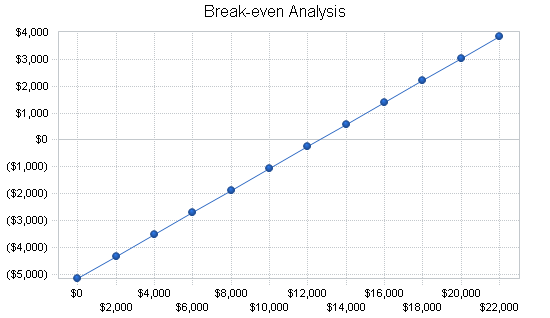
| Break-even Analysis | |
| Monthly Revenue Break-even | $12,582 |
| Assumptions: | |
| Average Percent Variable Cost | 59% |
| Estimated Monthly Fixed Cost | $5,160 |
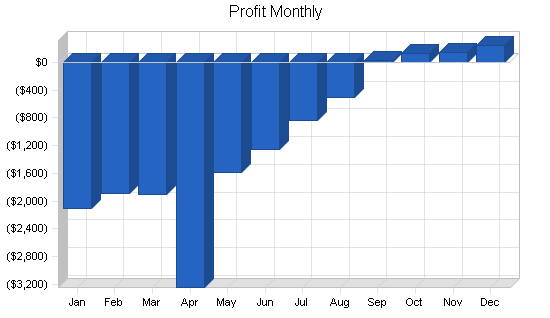
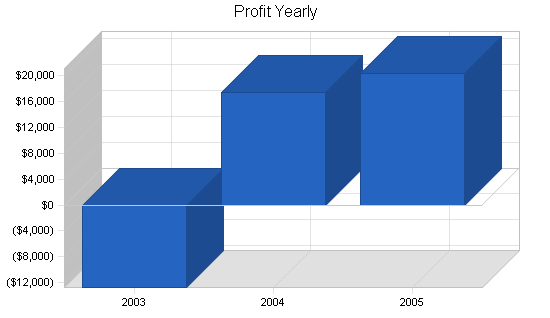
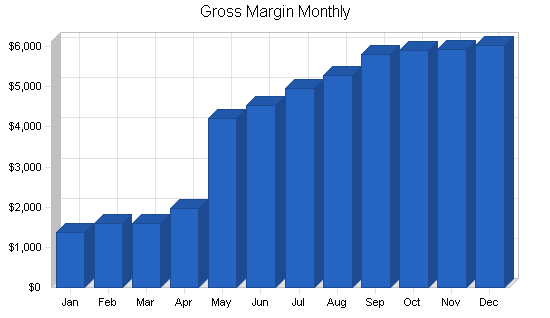
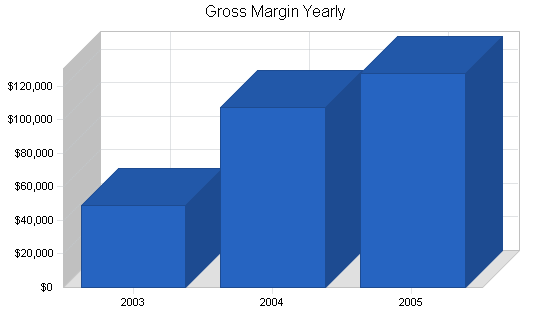
8.3 Projected Profit and Loss
The following table will indicate Projected Profit and Loss.
| Pro Forma Profit and Loss | |||
| 2003 | 2004 | 2005 | |
| Sales | $119,821 | $280,903 | $332,424 |
| Direct Cost of Sales | $70,680 | $173,581 | $205,082 |
| Other Costs of Goods | $0 | $0 | $0 |
| Total Cost of Sales | $70,680 | $173,581 | $205,082 |
| Gross Margin | $49,141 | $107,322 | $127,342 |
| Gross Margin % | 41.01% | 38.21% | 38.31% |
| Expenses | |||
| Payroll | $41,500 | $59,400 | $73,000 |
| Sales and Marketing and Other Expenses | $4,800 | $4,800 | $4,800 |
| Depreciation | $996 | $996 | $996 |
| Rent | $4,200 | $4,200 | $4,200 |
| Utilities | $1,800 | $1,800 | $1,800 |
| Insurance | $2,400 | $2,400 | $2,400 |
| Payroll Taxes | $6,225 | $8,910 | $10,950 |
| Other | $0 | $0 | $0 |
| Total Operating Expenses | $61,921 | $82,506 | $98,146 |
| Profit Before Interest and Taxes | ($12,780) | $24,816 | $29,196 |
| EBITDA | ($11,784) | $25,812 | $30,192 |
| Interest Expense | $0 | $0 | $0 |
| Taxes Incurred | $0 | $7,445 | $8,759 |
| Net Profit | ($12,780) | $17,371 | $20,437 |
| Net Profit/Sales | -10.67% | 6.18% | 6.15% |
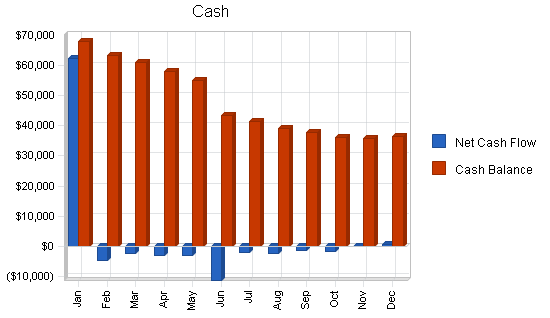
8.4 Projected Cash Flow
The following table and chart will indicate Projected Cash Flow.
| Pro Forma Cash Flow | |||
| 2003 | 2004 | 2005 | |
| Cash Received | |||
| Cash from Operations | |||
| Cash Sales | $29,955 | $70,226 | $83,106 |
| Cash from Receivables | $67,585 | $180,724 | $239,738 |
| Subtotal Cash from Operations | $97,540 | $250,950 | $322,844 |
| Additional Cash Received | |||
| Sales Tax, VAT, HST/GST Received | $0 | $0 | $0 |
| New Current Borrowing | $0 | $0 | $0 |
| New Other Liabilities (interest-free) | $0 | $0 | $0 |
| New Long-term Liabilities | $0 | $0 | $0 |
| Sales of Other Current Assets | $0 | $0 | $0 |
| Sales of Long-term Assets | $0 | $0 | $0 |
| New Investment Received | $70,000 | $0 | $0 |
| Subtotal Cash Received | $167,540 | $250,950 | $322,844 |
| Expenditures | 2003 | 2004 | 2005 |
| Expenditures from Operations | |||
| Cash Spending | $41,500 | $59,400 | $73,000 |
| Bill Payments | $90,136 | $210,618 | $240,472 |
| Subtotal Spent on Operations | $131,636 | $270,018 | $313,472 |
| Additional Cash Spent | |||
| Sales Tax, VAT, HST/GST Paid Out | $0 | $0 | $0 |
| Principal Repayment of Current Borrowing | $0 | $0 | $0 |
| Other Liabilities Principal Repayment | $0 | $0 | $0 |
| Long-term Liabilities Principal Repayment | $0 | $0 | $0 |
| Purchase Other Current Assets | $0 | $0 | $0 |
| Purchase Long-term Assets | $5,000 | $0 | $0 |
| Dividends | $0 | $0 | $0 |
| Subtotal Cash Spent | $136,636 | $270,018 | $313,472 |
| Net Cash Flow | $30,904 | ($19,068) | $9,372 |
| Cash Balance | $36,359 | $17,291 | $26,663 |
8.5 Projected Balance Sheet
The following table will indicate the projected Balance Sheet.
| Pro Forma Balance Sheet | |||
| 2003 | 2004 | 2005 | |
| Assets | |||
| Current Assets | |||
| Cash | $36,359 | $17,291 | $26,663 |
| Accounts Receivable | $22,281 | $52,234 | $61,814 |
| Inventory | $10,111 | $24,832 | $29,339 |
| Other Current Assets | $800 | $800 | $800 |
| Total Current Assets | $69,551 | $95,157 | $118,616 |
| Long-term Assets | |||
| Long-term Assets | $6,000 | $6,000 | $6,000 |
| Accumulated Depreciation | $996 | $1,992 | $2,988 |
| Total Long-term Assets | $5,004 | $4,008 | $3,012 |
| Total Assets | $74,555 | $99,165 | $121,628 |
| Liabilities and Capital | 2003 | 2004 | 2005 |
| Current Liabilities | |||
| Accounts Payable | $10,667 | $17,906 | $19,931 |
| Current Borrowing | $0 | $0 | $0 |
| Other Current Liabilities | $0 | $0 | $0 |
| Subtotal Current Liabilities | $10,667 | $17,906 | $19,931 |
| Long-term Liabilities | $0 | $0 | $0 |
| Total Liabilities | $10,667 | $17,906 | $19,931 |
| Paid-in Capital | $70,000 | $70,000 | $70,000 |
| Retained Earnings | $6,668 | ($6,112) | $11,259 |
| Earnings | ($12,780) | $17,371 | $20,437 |
| Total Capital | $63,888 | $81,259 | $101,696 |
| Total Liabilities and Capital | $74,555 | $99,165 | $121,628 |
| Net Worth | $63,888 | $81,259 | $101,696 |
8.6 Business Ratios
The following table will display the common Business Ratios associated with this company as well as industry averages.
| Ratio Analysis | ||||
| 2003 | 2004 | 2005 | Industry Profile | |
| Sales Growth | 565.67% | 134.44% | 18.34% | 4.01% |
| Percent of Total Assets | ||||
| Accounts Receivable | 29.88% | 52.67% | 50.82% | 15.71% |
| Inventory | 13.56% | 25.04% | 24.12% | 39.55% |
| Other Current Assets | 1.07% | 0.81% | 0.66% | 24.92% |
| Total Current Assets | 93.29% | 95.96% | 97.52% | 80.18% |
| Long-term Assets | 6.71% | 4.04% | 2.48% | 19.82% |
| Total Assets | 100.00% | 100.00% | 100.00% | 100.00% |
| Current Liabilities | 14.31% | 18.06% | 16.39% | 40.00% |
| Long-term Liabilities | 0.00% | 0.00% | 0.00% | 14.33% |
| Total Liabilities | 14.31% | 18.06% | 16.39% | 54.33% |
| Net Worth | 85.69% | 81.94% | 83.61% | 45.67% |
| Percent of Sales | ||||
| Sales | 100.00% | 100.00% | 100.00% | 100.00% |
| Gross Margin | 41.01% | 38.21% | 38.31% | 31.56% |
| Selling, General & Administrative Expenses | 51.68% | 32.02% | 32.16% | 19.76% |
| Advertising Expenses | 0.00% | 0.00% | 0.00% | 1.49% |
| Profit Before Interest and Taxes | -10.67% | 8.83% | 8.78% | 1.66% |
| Main Ratios | ||||
| Current | 6.52 | 5.31 | 5.95 | 1.80 |
| Quick | 5.57 | 3.93 | 4.48 | 0.69 |
| Total Debt to Total Assets | 14.31% | 18.06% | 16.39% | 59.54% |
| Pre-tax Return on Net Worth | -20.00% | 30.54% | 28.71% | 3.82% |
| Pre-tax Return on Assets | -17.14% | 25.03% | 24.00% | 9.44% |
| Additional Ratios | 2003 | 2004 | 2005 | |
| Net Profit Margin | -10.67% | 6.18% | 6.15% | n.a |
| Return on Equity | -20.00% | 21.38% | 20.10% | n.a |
| Activity Ratios | ||||
| Accounts Receivable Turnover | 4.03 | 4.03 | 4.03 | n.a |
| Collection Days | 56 | 65 | 83 | n.a |
| Inventory Turnover | 10.91 | 9.93 | 7.57 | n.a |
| Accounts Payable Turnover | 9.36 | 12.17 | 12.17 | n.a |
| Payment Days | 27 | 24 | 28 | n.a |
| Total Asset Turnover | 1.61 | 2.83 | 2.73 | n.a |
| Debt Ratios | ||||
| Debt to Net Worth | 0.17 | 0.22 | 0.20 | n.a |
| Current Liab. to Liab. | 1.00 | 1.00 | 1.00 | n.a |
| Liquidity Ratios | ||||
| Net Working Capital | $58,884 | $77,251 | $98,684 | n.a |
| Interest Coverage | 0.00 | 0.00 | 0.00 | n.a |
| Additional Ratios | ||||
| Assets to Sales | 0.62 | 0.35 | 0.37 | n.a |
| Current Debt/Total Assets | 14% | 18% | 16% | n.a |
| Acid Test | 3.48 | 1.01 | 1.38 | n.a |
| Sales/Net Worth | 1.88 | 3.46 | 3.27 | n.a |
| Dividend Payout | 0.00 | 0.00 | 0.00 | n.a |
Appendix
| Sales Forecast | |||||||||||||
| Jan | Feb | Mar | Apr | May | Jun | Jul | Aug | Sep | Oct | Nov | Dec | ||
| Sales | |||||||||||||
| Individuals | 0% | $2,500 | $2,900 | $2,876 | $3,565 | $3,938 | $4,223 | $4,432 | $4,654 | $4,998 | $5,112 | $5,332 | $5,454 |
| Distributors | 0% | $0 | $0 | $0 | $0 | $6,565 | $7,121 | $8,098 | $8,767 | $9,878 | $9,987 | $9,656 | $9,765 |
| Total Sales | $2,500 | $2,900 | $2,876 | $3,565 | $10,503 | $11,344 | $12,530 | $13,421 | $14,876 | $15,099 | $14,988 | $15,219 | |
| Direct Cost of Sales | Jan | Feb | Mar | Apr | May | Jun | Jul | Aug | Sep | Oct | Nov | Dec | |
| Individuals | $1,125 | $1,305 | $1,294 | $1,604 | $1,772 | $1,900 | $1,994 | $2,094 | $2,249 | $2,300 | $2,399 | $2,454 | |
| Distributors | $0 | $0 | $0 | $0 | $4,530 | $4,913 | $5,588 | $6,049 | $6,816 | $6,891 | $6,663 | $6,738 | |
| Subtotal Direct Cost of Sales | $1,125 | $1,305 | $1,294 | $1,604 | $6,302 | $6,814 | $7,582 | $8,144 | $9,065 | $9,191 | $9,062 | $9,192 | |
| Personnel Plan | |||||||||||||
| Jan | Feb | Mar | Apr | May | Jun | Jul | Aug | Sep | Oct | Nov | Dec | ||
| Josh | 0% | $2,000 | $2,000 | $2,000 | $2,000 | $2,000 | $2,000 | $2,000 | $2,000 | $2,000 | $2,000 | $2,000 | $2,000 |
| Employee #1 | 0% | $0 | $0 | $0 | $1,500 | $2,000 | $2,000 | $2,000 | $2,000 | $2,000 | $2,000 | $2,000 | $2,000 |
| Total People | 0 | 1 | 1 | 2 | 2 | 2 | 2 | 2 | 2 | 2 | 2 | 2 | |
| Total Payroll | $2,000 | $2,000 | $2,000 | $3,500 | $4,000 | $4,000 | $4,000 | $4,000 | $4,000 | $4,000 | $4,000 | $4,000 | |
| General Assumptions | |||||||||||||
| Jan | Feb | Mar | Apr | May | Jun | Jul | Aug | Sep | Oct | Nov | Dec | ||
| Plan Month | 1 | 2 | 3 | 4 | 5 | 6 | 7 | 8 | 9 | 10 | 11 | 12 | |
| Current Interest Rate | 10.00% | 10.00% | 10.00% | 10.00% | 10.00% | 10.00% | 10.00% | 10.00% | 10.00% | 10.00% | 10.00% | 10.00% | |
| Long-term Interest Rate | 10.00% | 10.00% | 10.00% | 10.00% | 10.00% | 10.00% | 10.00% | 10.00% | 10.00% | 10.00% | 10.00% | 10.00% | |
| Tax Rate | 30.00% | 30.00% | 30.00% | 30.00% | 30.00% | 30.00% | 30.00% | 30.00% | 30.00% | 30.00% | 30.00% | 30.00% | |
| Other | 0 | 0 | 0 | 0 | 0 | 0 | 0 | 0 | 0 | 0 | 0 | 0 | |
| Pro Forma Profit and Loss | |||||||||||||
| Jan | Feb | Mar | Apr | May | Jun | Jul | Aug | Sep | Oct | Nov | Dec | ||
| Sales | $2,500 | $2,900 | $2,876 | $3,565 | $10,503 | $11,344 | $12,530 | $13,421 | $14,876 | $15,099 | $14,988 | $15,219 | |
| Direct Cost of Sales | $1,125 | $1,305 | $1,294 | $1,604 | $6,302 | $6,814 | $7,582 | $8,144 | $9,065 | $9,191 | $9,062 | $9,192 | |
| Other Costs of Goods | $0 | $0 | $0 | $0 | $0 | $0 | $0 | $0 | $0 | $0 | $0 | $0 | |
| Total Cost of Sales | $1,125 | $1,305 | $1,294 | $1,604 | $6,302 | $6,814 | $7,582 | $8,144 | $9,065 | $9,191 | $9,062 | $9,192 | |
| Gross Margin | $1,375 | $1,595 | $1,582 | $1,961 | $4,201 | $4,530 | $4,948 | $5,277 | $5,811 | $5,908 | $5,926 | $6,027 | |
| Gross Margin % | 55.00% | 55.00% | 55.00% | 55.00% | 40.00% | 39.93% | 39.49% | 39.32% | 39.06% | 39.13% | 39.54% | 39.60% | |
| Expenses | |||||||||||||
| Payroll | $2,000 | $2,000 | $2,000 | $3,500 | $4,000 | $4,000 | $4,000 | $4,000 | $4,000 | $4,000 | $4,000 | $4,000 | |
| Sales and Marketing and Other Expenses | $400 | $400 | $400 | $400 | $400 | $400 | $400 | $400 | $400 | $400 | $400 | $400 | |
| Depreciation | $83 | $83 | $83 | $83 | $83 | $83 | $83 | $83 | $83 | $83 | $83 | $83 | |
| Rent | $350 | $350 | $350 | $350 | $350 | $350 | $350 | $350 | $350 | $350 | $350 | $350 | |
| Utilities | $150 | $150 | $150 | $150 | $150 | $150 | $150 | $150 | $150 | $150 | $150 | $150 | |
| Insurance | $200 | $200 | $200 | $200 | $200 | $200 | $200 | $200 | $200 | $200 | $200 | $200 | |
| Payroll Taxes | 15% | $300 | $300 | $300 | $525 | $600 | $600 | $600 | $600 | $600 | $600 | $600 | $600 |
| Other | $0 | $0 | $0 | $0 | $0 | $0 | $0 | $0 | $0 | $0 | $0 | $0 | |
| Total Operating Expenses | $3,483 | $3,483 | $3,483 | $5,208 | $5,783 | $5,783 | $5,783 | $5,783 | $5,783 | $5,783 | $5,783 | $5,783 | |
| Profit Before Interest and Taxes | ($2,108) | ($1,888) | ($1,901) | ($3,247) | ($1,582) | ($1,253) | ($835) | ($506) | $28 | $125 | $143 | $244 | |
| EBITDA | ($2,025) | ($1,805) | ($1,818) | ($3,164) | ($1,499) | ($1,170) | ($752) | ($423) | $111 | $208 | $226 | $327 | |
| Interest Expense | $0 | $0 | $0 | $0 | $0 | $0 | $0 | $0 | $0 | $0 | $0 | $0 | |
| Taxes Incurred | $0 | $0 | $0 | $0 | $0 | $0 | $0 | $0 | $0 | $0 | $0 | $0 | |
| Net Profit | ($2,108) | ($1,888) | ($1,901) | ($3,247) | ($1,582) | ($1,253) | ($835) | ($506) | $28 | $125 | $143 | $244 | |
| Net Profit/Sales | -84.32% | -65.10% | -66.11% | -91.09% | -15.06% | -11.04% | -6.66% | -3.77% | 0.19% | 0.83% | 0.95% | 1.60% | |
| Pro Forma Cash Flow | |||||||||||||
| Jan | Feb | Mar | Apr | May | Jun | Jul | Aug | Sep | Oct | Nov | Dec | ||
| Cash Received | |||||||||||||
| Cash from Operations | |||||||||||||
| Cash Sales | $625 | $725 | $719 | $891 | $2,626 | $2,836 | $3,133 | $3,355 | $3,719 | $3,775 | $3,747 | $3,805 | |
| Cash from Receivables | $0 | $63 | $1,885 | $2,174 | $2,174 | $2,847 | $7,898 | $8,538 | $9,420 | $10,102 | $11,163 | $11,321 | |
| Subtotal Cash from Operations | $625 | $788 | $2,604 | $3,066 | $4,800 | $5,683 | $11,031 | $11,893 | $13,139 | $13,877 | $14,910 | $15,126 | |
| Additional Cash Received | |||||||||||||
| Sales Tax, VAT, HST/GST Received | 0.00% | $0 | $0 | $0 | $0 | $0 | $0 | $0 | $0 | $0 | $0 | $0 | $0 |
| New Current Borrowing | $0 | $0 | $0 | $0 | $0 | $0 | $0 | $0 | $0 | $0 | $0 | $0 | |
| New Other Liabilities (interest-free) | $0 | $0 | $0 | $0 | $0 | $0 | $0 | $0 | $0 | $0 | $0 | $0 | |
| New Long-term Liabilities | $0 | $0 | $0 | $0 | $0 | $0 | $0 | $0 | $0 | $0 | $0 | $0 | |
| Sales of Other Current Assets | $0 | $0 | $0 | $0 | $0 | $0 | $0 | $0 | $0 | $0 | $0 | $0 | |
| Sales of Long-term Assets | $0 | $0 | $0 | $0 | $0 | $0 | $0 | $0 | $0 | $0 | $0 | $0 | |
| New Investment Received | $70,000 | $0 | $0 | $0 | $0 | $0 | $0 | $0 | $0 | $0 | $0 | $0 | |
| Subtotal Cash Received | $70,625 | $788 | $2,604 | $3,066 | $4,800 | $5,683 | $11,031 | $11,893 | $13,139 | $13,877 | $14,910 | $15,126 | |
| Expenditures | Jan | Feb | Mar | Apr | May | Jun | Jul | Aug | Sep | Oct | Nov | Dec | |
| Expenditures from Operations | |||||||||||||
| Cash Spending | $2,000 | $2,000 | $2,000 | $3,500 | $4,000 | $4,000 | $4,000 | $4,000 | $4,000 | $4,000 | $4,000 | $4,000 | |
| Bill Payments | $1,099 | $3,347 | $2,896 | $2,712 | $3,890 | $13,033 | $9,112 | $10,138 | $10,505 | $11,754 | $11,017 | $10,634 | |
| Subtotal Spent on Operations | $3,099 | $5,347 | $4,896 | $6,212 | $7,890 | $17,033 | $13,112 | $14,138 | $14,505 | $15,754 | $15,017 | $14,634 | |
| Additional Cash Spent | |||||||||||||
| Sales Tax, VAT, HST/GST Paid Out | $0 | $0 | $0 | $0 | $0 | $0 | $0 | $0 | $0 | $0 | $0 | $0 | |
| Principal Repayment of Current Borrowing | $0 | $0 | $0 | $0 | $0 | $0 | $0 | $0 | $0 | $0 | $0 | $0 | |
| Other Liabilities Principal Repayment | $0 | $0 | $0 | $0 | $0 | $0 | $0 | $0 | $0 | $0 | $0 | $0 | |
| Long-term Liabilities Principal Repayment | $0 | $0 | $0 | $0 | $0 | $0 | $0 | $0 | $0 | $0 | $0 | $0 | |
| Purchase Other Current Assets | $0 | $0 | $0 | $0 | $0 | $0 | $0 | $0 | $0 | $0 | $0 | $0 | |
| Purchase Long-term Assets | $5,000 | $0 | $0 | $0 | $0 | $0 | $0 | $0 | $0 | $0 | $0 | $0 | |
| Dividends | $0 | $0 | $0 | $0 | $0 | $0 | $0 | $0 | $0 | $0 | $0 | $0 | |
| Subtotal Cash Spent | $8,099 | $5,347 | $4,896 | $6,212 | $7,890 | $17,033 | $13,112 | $14,138 | $14,505 | $15,754 | $15,017 | $14,634 | |
| Net Cash Flow | $62,526 | ($4,560) | ($2,292) | ($3,146) | ($3,090) | ($11,350) | ($2,081) | ($2,245) | ($1,366) | ($1,877) | ($107) | $493 | |
| Cash Balance | $67,981 | $63,421 | $61,130 | $57,983 | $54,893 | $43,543 | $41,462 | $39,217 | $37,850 | $35,974 | $35,867 | $36,359 | |
| Pro Forma Balance Sheet | |||||||||||||
| Jan | Feb | Mar | Apr | May | Jun | Jul | Aug | Sep | Oct | Nov | Dec | ||
| Assets | Starting Balances | ||||||||||||
| Current Assets | |||||||||||||
| Cash | $5,455 | $67,981 | $63,421 | $61,130 | $57,983 | $54,893 | $43,543 | $41,462 | $39,217 | $37,850 | $35,974 | $35,867 | $36,359 |
| Accounts Receivable | $0 | $1,875 | $3,988 | $4,260 | $4,759 | $10,462 | $16,123 | $17,622 | $19,150 | $20,887 | $22,109 | $22,188 | $22,281 |
| Inventory | $400 | $1,238 | $1,436 | $1,424 | $1,765 | $6,932 | $7,495 | $8,340 | $8,958 | $9,971 | $10,111 | $9,968 | $10,111 |
| Other Current Assets | $800 | $800 | $800 | $800 | $800 | $800 | $800 | $800 | $800 | $800 | $800 | $800 | $800 |
| Total Current Assets | $6,655 | $71,893 | $69,644 | $67,613 | $65,307 | $73,087 | $67,961 | $68,224 | $68,125 | $69,509 | $68,994 | $68,823 | $69,551 |
| Long-term Assets | |||||||||||||
| Long-term Assets | $1,000 | $6,000 | $6,000 | $6,000 | $6,000 | $6,000 | $6,000 | $6,000 | $6,000 | $6,000 | $6,000 | $6,000 | $6,000 |
| Accumulated Depreciation | $0 | $83 | $166 | $249 | $332 | $415 | $498 | $581 | $664 | $747 | $830 | $913 | $996 |
| Total Long-term Assets | $1,000 | $5,917 | $5,834 | $5,751 | $5,668 | $5,585 | $5,502 | $5,419 | $5,336 | $5,253 | $5,170 | $5,087 | $5,004 |
| Total Assets | $7,655 | $77,810 | $75,478 | $73,364 | $70,975 | $78,672 | $73,463 | $73,643 | $73,461 | $74,762 | $74,164 | $73,910 | $74,555 |
| Liabilities and Capital | Jan | Feb | Mar | Apr | May | Jun | Jul | Aug | Sep | Oct | Nov | Dec | |
| Current Liabilities | |||||||||||||
| Accounts Payable | $987 | $3,250 | $2,806 | $2,593 | $3,451 | $12,730 | $8,774 | $9,789 | $10,112 | $11,386 | $10,663 | $10,266 | $10,667 |
| Current Borrowing | $0 | $0 | $0 | $0 | $0 | $0 | $0 | $0 | $0 | $0 | $0 | $0 | $0 |
| Other Current Liabilities | $0 | $0 | $0 | $0 | $0 | $0 | $0 | $0 | $0 | $0 | $0 | $0 | $0 |
| Subtotal Current Liabilities | $987 | $3,250 | $2,806 | $2,593 | $3,451 | $12,730 | $8,774 | $9,789 | $10,112 | $11,386 | $10,663 | $10,266 | $10,667 |
| Long-term Liabilities | $0 | $0 | $0 | $0 | $0 | $0 | $0 | $0 | $0 | $0 | $0 | $0 | $0 |
| Total Liabilities | $987 | $3,250 | $2,806 | $2,593 | $3,451 | $12,730 | $8,774 | $9,789 | $10,112 | $11,386 | $10,663 | $10,266 | $10,667 |
| Paid-in Capital | $0 | $70,000 | $70,000 | $70,000 | $70,000 | $70,000 | $70,000 | $70,000 | $70,000 | $70,000 | $70,000 | $70,000 | $70,000 |
| Retained Earnings | $6,668 | $6,668 | $6,668 | $6,668 | $6,668 | $6,668 | $6,668 | $6,668 | $6,668 | $6,668 | $6,668 | $6,668 | $6,668 |
| Earnings | $0 | ($2,108) | ($3,996) | ($5,897) | ($9,144) | ($10,726) | ($11,979) | ($12,814) | ($13,320) | ($13,292) | ($13,167) | ($13,024) | ($12,780) |
| Total Capital | $6,668 | $74,560 | $72,672 | $70,771 | $67,524 | $65,942 | $64,689 | $63,854 | $63,348 | $63,376 | $63,501 | $63,644 | $63,888 |
| Total Liabilities and Capital | $7,655 | $77,810 | $75,478 | $73,364 | $70,975 | $78,672 | $73,463 | $73,643 | $73,461 | $74,762 | $74,164 | $73,910 | $74,555 |
| Net Worth | $6,668 | $74,560 | $72,672 | $70,771 | $67,524 | $65,942 | $64,689 | $63,854 | $63,348 | $63,376 | $63,501 | $63,644 | $63,888 |


