
The Two Wheeled Oracle
Executive Summary
Two Wheeled Oracle is a bicycle based courier service in Portland, Oregon, catering to law firms. The Oracle can transport documents as well as small parcels to clients, other law firms, as well as transport and file documents with the clerk of courts. Law firms will be the primary group of customers and the only one targeted, non law firm customers will be served as well, but will not be targeted.
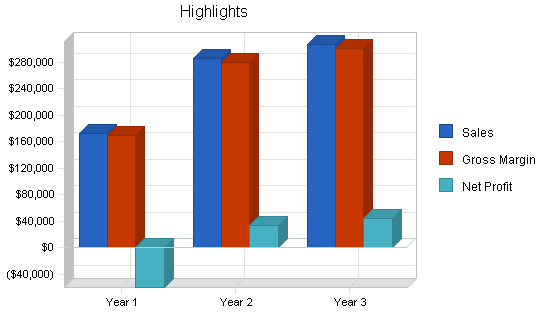
The Oracle will offer reliability and industry insight to law firms, enabling it to provide superior service relative to the current service providers. This will allow the company to rapidly gain market share. Profitability will be reached by month nine, and revenue for year three will be very comfortable.
1.1 Objectives
The objectives for the first three years of operation include:
- To create a service-based company whose primary goal is to exceed customer’s expectations.
- The utilization of The Oracle by at least 30 different law firms.
- To increase the number of clients served by 20% per year through superior service.
- To develop a profitable start-up business within the first year of operation.
1.2 Mission
Two Wheeled Oracle’s mission is to provide law firms with an environmentally friendly, expedient delivery service. We exist to attract and maintain customers. When we adhere to this maxim, everything else will fall in to place. Our services will exceed the expectations of our customers.
Company Summary
The Oracle is a bicycle courier service that serves the downtown law firms of Portland, Oregon. The company offers a document delivery service for law firms; documents can be delivered to other law firms, to clients, or filed with the court. The company can offer a scheduled pick up as well as a spontaneous run. Within nine months the business will be profitable.
2.1 Company Ownership
The company will be an Oregon Corporation, owned entirely by Alwy Laate.
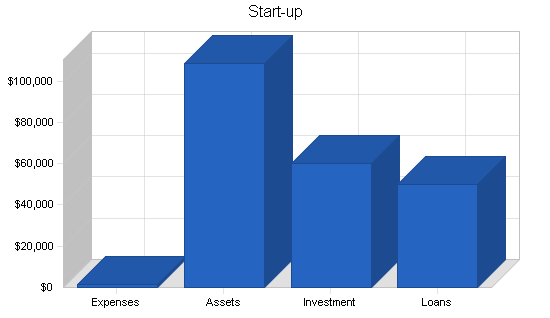
2.2 Start-up Summary
Two Wheeled Oracle will incur the following start-up costs:
- Office furniture including: two desks, two chairs, and two file cabinets.
- Two computer systems including a printer, CD-RW, and a broadband Internet connection.
- Three phone lines.
- Fax machine and copier.
- Development of a website that allows delivery orders to be placed online and received every five minutes.
- Legal fees for the incorporation of the business.
- Brochures.
- Nextel cellular phones to be used for communication between mobile units and the base. Nextel is used because it offers a two-way communication function, similar to a two-way radio, over cellular frequencies, but at a significantly reduced rate compared to standard cellular service. Nine handsets will be needed initially.
- Messenger bags with company logo.
| Start-up Funding | |
| Start-up Expenses to Fund | $1,300 |
| Start-up Assets to Fund | $108,700 |
| Total Funding Required | $110,000 |
| Assets | |
| Non-cash Assets from Start-up | $7,500 |
| Cash Requirements from Start-up | $101,200 |
| Additional Cash Raised | $0 |
| Cash Balance on Starting Date | $101,200 |
| Total Assets | $108,700 |
| Liabilities and Capital | |
| Liabilities | |
| Current Borrowing | $0 |
| Long-term Liabilities | $50,000 |
| Accounts Payable (Outstanding Bills) | $0 |
| Other Current Liabilities (interest-free) | $0 |
| Total Liabilities | $50,000 |
| Capital | |
| Planned Investment | |
| Alwy | $60,000 |
| Investor 2 | $0 |
| Other | $0 |
| Additional Investment Requirement | $0 |
| Total Planned Investment | $60,000 |
| Loss at Start-up (Start-up Expenses) | ($1,300) |
| Total Capital | $58,700 |
| Total Capital and Liabilities | $108,700 |
| Total Funding | $110,000 |
| Start-up | |
| Requirements | |
| Start-up Expenses | |
| Legal | $1,000 |
| Stationery etc. | $150 |
| Brochures | $150 |
| Consultants | $0 |
| Insurance | $0 |
| Rent | $0 |
| Research and development | $0 |
| Expensed equipment | $0 |
| Other | $0 |
| Total Start-up Expenses | $1,300 |
| Start-up Assets | |
| Cash Required | $101,200 |
| Other Current Assets | $0 |
| Long-term Assets | $7,500 |
| Total Assets | $108,700 |
| Total Requirements | $110,000 |
Services
Two Wheeled Oracle will provide a bicycle messenger service that targets law firms. The service can be used to serve notice on a lawsuit, transport documents to a client or opposing counsel, or file a document with the court clerk. In addition to responding to immediate calls for delivery, The Oracle will set up a subscription basis with law firms for daily pick-up to file documents with the court clerk.
Although The Oracle will target law firms, the company will accept jobs from other companies/individuals that require a messenger service in downtown Portland, these jobs will be accepted but not solicited. The messenger service offers delivery times ranging from one to three hours.
In addition to document delivery, small packages can be delivered. It is rare that a law firm needs to deliver packages, so this will generally apply to the ancillary business. The maximum dimensions for package delivery are 12x8x8.
Market Analysis Summary
The Oracle will primarily be serving Portland-based law firms. This is a particularly attractive segment because law firms have a constant need for delivery services. Most firms are sending things consistently during the day. The Oracle will be able to set up contracts with firms to provide multiple scheduled pick-ups each day.
The Oracle will also serve non law firm customers who are in need of a courier service. In addition to documents, the company can transport small parcels.
As a former practicing attorney, Alwy will be able to leverage his vast industry knowledge as well as his network of colleagues to gain market share.
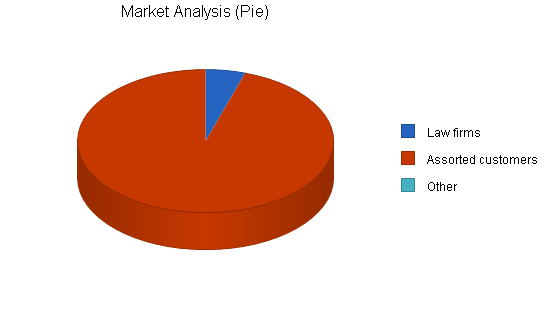
4.1 Market Segmentation
Two Wheeled Oracle will service two distinct groups. The first group is the main group of customers: law firms. This will be the group that is targeted primarily. Law firms are constantly in need of document delivery, whether it is to clients, other law firms, or to the court. This regularity of needed delivery is the reason that law firms are targeted. Once a law firm has become a satisfied customer, it is likely that they will begin to increase their delivery needs. This then becomes a steady, high frequency, long-term customer. Law firms have constant delivery activity, many firms require pick-ups throughout the day and require dependability, which is one of The Oracle’s competitive advantages.
The second customer group is assorted deliveries needed in the city. This could come from a wide variety of businesses that require delivery within the city.
| Market Analysis | |||||||
| Year 1 | Year 2 | Year 3 | Year 4 | Year 5 | |||
| Potential Customers | Growth | CAGR | |||||
| Law firms | 9% | 287 | 313 | 341 | 372 | 405 | 8.99% |
| Assorted customers | 6% | 5,487 | 5,816 | 6,165 | 6,535 | 6,927 | 6.00% |
| Other | 0% | 0 | 0 | 0 | 0 | 0 | 0.00% |
| Total | 6.15% | 5,774 | 6,129 | 6,506 | 6,907 | 7,332 | 6.15% |
4.2 Target Market Segment Strategy
The Oracle will target it’s market through channels that all law firms typically see. The first is the Oregon Bar Journal. This is the newsletter that all practicing or bar accredited attorneys get. Advertisements will be placed in the journal to increase visibility of The Oracle. Additionally, there will be a yellow pages advertisement and brochures passed out.
This market will also be targeted through a networking scheme based on Alwy’s contacts that he made as a practicing attorney. Although Alwy no longer practices, he is still a member of the bar and maintains membership on several bar committees. Through his activity on the bar, as well as contact made during his practice, Alwy will leverage his network to create initial clients. This will not be difficult because a trust bond has already been formed with many different attorneys, and these attorneys will recognize that Alwy is keenly aware of the needs of attorneys in regards to delivery services. Because Alwy is aware of the attorney’s perspective, it will be easy for him to gain the trust of his former colleagues and sign them up as clients.
4.3 Service Business Analysis
There are approximately 20 different delivery services in the Portland area, a quarter of these are taxi services that also makes deliveries. The rest are courier or messenger services. Some use cars and a few use bicycles as the means of transportation. In general, the bicycle messengers are less expensive because they have lower overhead. In the heart of downtown, the bicycle messengers can be as fast or faster than the car-based courier services because of all the automobile traffic.

There are five different companies that target law firms by catering to their special needs. All of these are car-based services.
The buying habits of law firms are based on price, convenience, and reliability.
Strategy and Implementation Summary
The Oracle’s strategy for gaining market share will be based on it’s competitive advantages: reliability and industry knowledge. Reliability is very important to law firms and will make The Oracle very attractive. Additionally, Alwy’s industry knowledge will be helpful in convincing firms to try this company because it understands and caters to law firm’s needs.
Portland has been chosen as the headquarters for this service because it is an environmentally-friendly city. The citizens are interested in environmental health, and are welcoming to new businesses with the same doctrine. The Oracle is proud to be a messenger service on bikes, it is proud to help keep the environment safe and healthy in Oregon.
5.1 Competitive Edge
The Oracle has two competitive edges: reliability and industry insight. Reliability is a characteristic that is very important to law firms. The firms require reliability of delivery. Often the delivery of legal documents is critical. The Oracle achieves reliability through a redundant back-up system that always provides an alternative method of delivery if the specific bicycle messenger encounters difficulty. By having a back-up system, the company ensures that even if the primary messenger fails, there is a back-up ready to complete the delivery.
The second competitive advantage is industry insight. It is a true advantage for Alwy to have worked as an attorney for several years. This work gave him industry insight that is not replicable without actually doing the work. The insight is valuable because Alwy knows intimately what attorneys need in regards to document delivery. While other companies will gain some insight by serving the attorney market over time, it will not compare in breadth to Alwy’s.
5.2 Sales Strategy
Two Wheeled Oracle recognizes that it is difficult to break into many law firms and displace their current service provider and will offer a 20% discount for a months worth of services. While this is a bit of a hit in terms of profitability, it is only a short-term concern. The long-term gain is securing a repeat customer.
In addition to this economic incentive, The Oracle will employ Alwy’s powers of persuasion when he is speaking with prospective clients and firms. He will directly target the company’s reliability and fool-proof back-up systems, as well as impress his recognition of the needs of his clients based on his own years of practicing law. He will use these two features to attract new clientele.
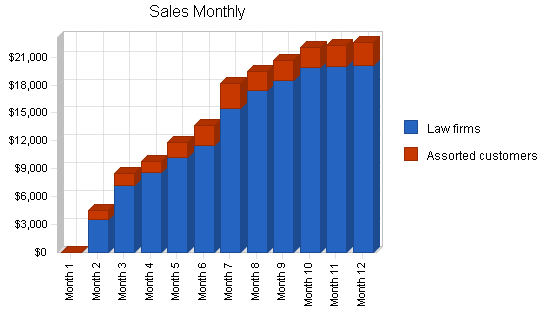
5.2.1 Sales Forecast
The first month will be used to set up the office and hire and train messengers. The second month will begin to see some sales activity. Sales will ramp up from month three on. There will be an incremental increase each month as more and more firms become aware of the services of the company.

| Sales Forecast | |||
| Year 1 | Year 2 | Year 3 | |
| Sales | |||
| Law firms | $152,459 | $255,458 | $271,554 |
| Assorted customers | $20,841 | $30,254 | $35,125 |
| Total Sales | $173,300 | $285,712 | $306,679 |
| Direct Cost of Sales | Year 1 | Year 2 | Year 3 |
| Law firms | $3,049 | $5,109 | $5,431 |
| Assorted customers | $417 | $605 | $703 |
| Subtotal Direct Cost of Sales | $3,466 | $5,714 | $6,134 |
5.3 Milestones
The Oracle will have several milestones early on:
- Business plan completion. This will be done as a roadmap for the organization. While we do not need a business plan to raise capital, it will be an indispensable tool for the ongoing performance and improvement of the company.
- Set up office.
- Hire and train staff.
| Milestones | |||||
| Milestone | Start Date | End Date | Budget | Manager | Department |
| Business plan completion | 1/1/2001 | 2/1/2001 | $0 | Laate | Owner |
| Set up office | 1/1/2001 | 2/1/2001 | $0 | Laate | Owner |
| Hire and train staff | 1/1/2001 | 2/1/2001 | $0 | Laate | Owner |
| Totals | $0 | ||||
Management Summary
Alwy Laate, the founder and owner received his bachelor degree in philosophy from Washington & Jefferson College. During the summers, Alwy worked for a bicycle messenger service in Pittsburgh. Upon graduation, Alwy managed a bicycle shop, pursuing his interest in the bicycling industry. After two years of work in the bicycle industry Alwy was no longer challenged. In addition to a lack of challenge, Alwy was pressured by his parents, implicitly but forcefully, to achieve a graduate education. Alwy took the LSAT’s and moved to Oregon for Law School.
During his first year of law school, Alwy was interested in law, however, was unsure about practicing law. He heard about the joint degree program that coupled with the law program, added an extra year (four total) to school, but also added an MBA. Intrigued by this, Alwy took the GMAT’s and entered the joint degree program. Alwy graduated with a JD/MBA and had to figure out what to do next. Alwy was intrigued by public interest law, so he worked for a large form in Portland that allowed associates to bill 20% of their required hours out to pro bono causes. Alwy chose environmental organizations.
After three years of practicing law, enough was enough. There was no longer enjoyment in it and Alwy had to find a job that was enjoyable. He brainstormed a way to combine the business skills from his MBA, his networking contacts from his law practice, and his love of cycling. One day the business model of the Two Wheeled Oracle hit him and the rest, as they say, is history.
6.1 Personnel Plan
The Oracle will consist of Alwy completing HR functions, marketing functions, and general business management. The company will hire a full-time dispatcher and eight bicycle messengers. While bicycle messengers seem to be transient, the training of a new one is relatively quick and cheap, so if one leaves, he/she can be replaced quickly.
| Personnel Plan | |||
| Year 1 | Year 2 | Year 3 | |
| Alwy Laate | $36,000 | $42,000 | $48,000 |
| Dispatcher | $20,400 | $20,400 | $20,400 |
| Messenger | $17,280 | $17,280 | $17,280 |
| Messenger | $17,280 | $17,280 | $17,280 |
| Messenger | $17,280 | $17,280 | $17,280 |
| Messenger | $17,280 | $17,280 | $17,280 |
| Messenger | $17,280 | $17,280 | $17,280 |
| Messenger | $17,280 | $17,280 | $17,280 |
| Messenger | $17,280 | $17,280 | $17,280 |
| Total People | 0 | 0 | 0 |
| Total Payroll | $177,360 | $183,360 | $189,360 |
Financial Plan
The following sections will outline the important financial data.
7.1 Important Assumptions
The following table details important financial assumptions for The Oracle.
| General Assumptions | |||
| Year 1 | Year 2 | Year 3 | |
| Plan Month | 1 | 2 | 3 |
| Current Interest Rate | 10.00% | 10.00% | 10.00% |
| Long-term Interest Rate | 10.00% | 10.00% | 10.00% |
| Tax Rate | 25.42% | 25.00% | 25.42% |
| Other | 0 | 0 | 0 |
7.2 Break-even Analysis
The Break-even Analysis indicates what The Oracle will need to achieve in monthly revenue to reach their break-even point.

| Break-even Analysis | |
| Monthly Revenue Break-even | $19,155 |
| Assumptions: | |
| Average Percent Variable Cost | 2% |
| Estimated Monthly Fixed Cost | $18,772 |
7.3 Projected Profit and Loss
The following table will indicate projected profit and loss.


| Pro Forma Profit and Loss | |||
| Year 1 | Year 2 | Year 3 | |
| Sales | $173,300 | $285,712 | $306,679 |
| Direct Cost of Sales | $3,466 | $5,714 | $6,134 |
| Other | $0 | $0 | $0 |
| Total Cost of Sales | $3,466 | $5,714 | $6,134 |
| Gross Margin | $169,834 | $279,998 | $300,545 |
| Gross Margin % | 98.00% | 98.00% | 98.00% |
| Expenses | |||
| Payroll | $177,360 | $183,360 | $189,360 |
| Sales and Marketing and Other Expenses | $3,000 | $3,000 | $3,000 |
| Depreciation | $1,500 | $1,500 | $1,500 |
| Cellular service | $4,200 | $4,200 | $4,200 |
| Utilities | $1,200 | $1,200 | $1,200 |
| Insurance | $1,800 | $1,800 | $1,800 |
| Rent | $9,600 | $9,000 | $9,000 |
| Payroll Taxes | $26,604 | $27,504 | $28,404 |
| Other | $0 | $0 | $0 |
| Total Operating Expenses | $225,264 | $231,564 | $238,464 |
| Profit Before Interest and Taxes | ($55,430) | $48,434 | $62,081 |
| EBITDA | ($53,930) | $49,934 | $63,581 |
| Interest Expense | $4,517 | $3,596 | $2,546 |
| Taxes Incurred | $0 | $11,210 | $15,132 |
| Net Profit | ($59,947) | $33,629 | $44,404 |
| Net Profit/Sales | -34.59% | 11.77% | 14.48% |
7.4 Projected Cash Flow
The following chart and table will indicate projected cash flow.

| Pro Forma Cash Flow | |||
| Year 1 | Year 2 | Year 3 | |
| Cash Received | |||
| Cash from Operations | |||
| Cash Sales | $43,325 | $71,428 | $76,670 |
| Cash from Receivables | $96,883 | $192,819 | $226,006 |
| Subtotal Cash from Operations | $140,208 | $264,247 | $302,675 |
| Additional Cash Received | |||
| Sales Tax, VAT, HST/GST Received | $0 | $0 | $0 |
| New Current Borrowing | $0 | $0 | $0 |
| New Other Liabilities (interest-free) | $0 | $0 | $0 |
| New Long-term Liabilities | $0 | $0 | $0 |
| Sales of Other Current Assets | $0 | $0 | $0 |
| Sales of Long-term Assets | $0 | $0 | $0 |
| New Investment Received | $0 | $0 | $0 |
| Subtotal Cash Received | $140,208 | $264,247 | $302,675 |
| Expenditures | Year 1 | Year 2 | Year 3 |
| Expenditures from Operations | |||
| Cash Spending | $177,360 | $183,360 | $189,360 |
| Bill Payments | $49,882 | $66,203 | $71,071 |
| Subtotal Spent on Operations | $227,242 | $249,563 | $260,431 |
| Additional Cash Spent | |||
| Sales Tax, VAT, HST/GST Paid Out | $0 | $0 | $0 |
| Principal Repayment of Current Borrowing | $0 | $0 | $0 |
| Other Liabilities Principal Repayment | $0 | $0 | $0 |
| Long-term Liabilities Principal Repayment | $9,055 | $9,976 | $11,026 |
| Purchase Other Current Assets | $0 | $0 | $0 |
| Purchase Long-term Assets | $0 | $0 | $0 |
| Dividends | $0 | $0 | $0 |
| Subtotal Cash Spent | $236,297 | $259,539 | $271,457 |
| Net Cash Flow | ($96,089) | $4,707 | $31,218 |
| Cash Balance | $5,111 | $9,818 | $41,036 |
7.5 Projected Balance Sheet
The following table will indicate the projected balance sheet.
| Pro Forma Balance Sheet | |||
| Year 1 | Year 2 | Year 3 | |
| Assets | |||
| Current Assets | |||
| Cash | $5,111 | $9,818 | $41,036 |
| Accounts Receivable | $33,092 | $54,557 | $58,561 |
| Other Current Assets | $0 | $0 | $0 |
| Total Current Assets | $38,203 | $64,375 | $99,597 |
| Long-term Assets | |||
| Long-term Assets | $7,500 | $7,500 | $7,500 |
| Accumulated Depreciation | $1,500 | $3,000 | $4,500 |
| Total Long-term Assets | $6,000 | $4,500 | $3,000 |
| Total Assets | $44,203 | $68,875 | $102,597 |
| Liabilities and Capital | Year 1 | Year 2 | Year 3 |
| Current Liabilities | |||
| Accounts Payable | $4,505 | $5,525 | $5,870 |
| Current Borrowing | $0 | $0 | $0 |
| Other Current Liabilities | $0 | $0 | $0 |
| Subtotal Current Liabilities | $4,505 | $5,525 | $5,870 |
| Long-term Liabilities | $40,945 | $30,969 | $19,942 |
| Total Liabilities | $45,450 | $36,494 | $25,812 |
| Paid-in Capital | $60,000 | $60,000 | $60,000 |
| Retained Earnings | ($1,300) | ($61,247) | ($27,618) |
| Earnings | ($59,947) | $33,629 | $44,404 |
| Total Capital | ($1,247) | $32,382 | $76,785 |
| Total Liabilities and Capital | $44,203 | $68,875 | $102,597 |
| Net Worth | ($1,247) | $32,382 | $76,785 |
7.6 Business Ratios
The following table contains important business ratios from the courier services industry, SIC 4513, as determined by the Standard Industry Classification (SIC) Index.
| Ratio Analysis | ||||
| Year 1 | Year 2 | Year 3 | Industry Profile | |
| Sales Growth | 0.00% | 64.87% | 7.34% | 4.50% |
| Percent of Total Assets | ||||
| Accounts Receivable | 74.86% | 79.21% | 57.08% | 27.40% |
| Other Current Assets | 0.00% | 0.00% | 0.00% | 21.80% |
| Total Current Assets | 86.43% | 93.47% | 97.08% | 50.30% |
| Long-term Assets | 13.57% | 6.53% | 2.92% | 49.70% |
| Total Assets | 100.00% | 100.00% | 100.00% | 100.00% |
| Current Liabilities | 10.19% | 8.02% | 5.72% | 29.80% |
| Long-term Liabilities | 92.63% | 44.96% | 19.44% | 27.90% |
| Total Liabilities | 102.82% | 52.99% | 25.16% | 57.70% |
| Net Worth | -2.82% | 47.01% | 74.84% | 42.30% |
| Percent of Sales | ||||
| Sales | 100.00% | 100.00% | 100.00% | 100.00% |
| Gross Margin | 98.00% | 98.00% | 98.00% | 100.00% |
| Selling, General & Administrative Expenses | 132.59% | 86.23% | 83.44% | 79.50% |
| Advertising Expenses | 0.69% | 0.42% | 0.39% | 0.20% |
| Profit Before Interest and Taxes | -31.98% | 16.95% | 20.24% | 1.30% |
| Main Ratios | ||||
| Current | 8.48 | 11.65 | 16.97 | 1.64 |
| Quick | 8.48 | 11.65 | 16.97 | 1.43 |
| Total Debt to Total Assets | 102.82% | 52.99% | 25.16% | 57.70% |
| Pre-tax Return on Net Worth | 4807.12% | 138.47% | 77.54% | 2.50% |
| Pre-tax Return on Assets | -135.62% | 65.10% | 58.03% | 5.90% |
| Additional Ratios | Year 1 | Year 2 | Year 3 | |
| Net Profit Margin | -34.59% | 11.77% | 14.48% | n.a |
| Return on Equity | 0.00% | 103.85% | 57.83% | n.a |
| Activity Ratios | ||||
| Accounts Receivable Turnover | 3.93 | 3.93 | 3.93 | n.a |
| Collection Days | 56 | 75 | 90 | n.a |
| Accounts Payable Turnover | 12.07 | 12.17 | 12.17 | n.a |
| Payment Days | 27 | 27 | 29 | n.a |
| Total Asset Turnover | 3.92 | 4.15 | 2.99 | n.a |
| Debt Ratios | ||||
| Debt to Net Worth | 0.00 | 1.13 | 0.34 | n.a |
| Current Liab. to Liab. | 0.10 | 0.15 | 0.23 | n.a |
| Liquidity Ratios | ||||
| Net Working Capital | $33,698 | $58,850 | $93,728 | n.a |
| Interest Coverage | -12.27 | 13.47 | 24.39 | n.a |
| Additional Ratios | ||||
| Assets to Sales | 0.26 | 0.24 | 0.33 | n.a |
| Current Debt/Total Assets | 10% | 8% | 6% | n.a |
| Acid Test | 1.13 | 1.78 | 6.99 | n.a |
| Sales/Net Worth | 0.00 | 8.82 | 3.99 | n.a |
| Dividend Payout | 0.00 | 0.00 | 0.00 | n.a |
Appendix
| Sales Forecast | |||||||||||||
| Month 1 | Month 2 | Month 3 | Month 4 | Month 5 | Month 6 | Month 7 | Month 8 | Month 9 | Month 10 | Month 11 | Month 12 | ||
| Sales | |||||||||||||
| Law firms | 0% | $0 | $3,525 | $7,214 | $8,600 | $10,254 | $11,458 | $15,455 | $17,458 | $18,524 | $19,874 | $19,952 | $20,145 |
| Assorted customers | 0% | $0 | $954 | $1,245 | $1,154 | $1,547 | $2,154 | $2,658 | $2,014 | $2,147 | $2,200 | $2,314 | $2,454 |
| Total Sales | $0 | $4,479 | $8,459 | $9,754 | $11,801 | $13,612 | $18,113 | $19,472 | $20,671 | $22,074 | $22,266 | $22,599 | |
| Direct Cost of Sales | Month 1 | Month 2 | Month 3 | Month 4 | Month 5 | Month 6 | Month 7 | Month 8 | Month 9 | Month 10 | Month 11 | Month 12 | |
| Law firms | $0 | $71 | $144 | $172 | $205 | $229 | $309 | $349 | $370 | $397 | $399 | $403 | |
| Assorted customers | $0 | $19 | $25 | $23 | $31 | $43 | $53 | $40 | $43 | $44 | $46 | $49 | |
| Subtotal Direct Cost of Sales | $0 | $90 | $169 | $195 | $236 | $272 | $362 | $389 | $413 | $441 | $445 | $452 | |
| Personnel Plan | |||||||||||||
| Month 1 | Month 2 | Month 3 | Month 4 | Month 5 | Month 6 | Month 7 | Month 8 | Month 9 | Month 10 | Month 11 | Month 12 | ||
| Alwy Laate | 0% | $3,000 | $3,000 | $3,000 | $3,000 | $3,000 | $3,000 | $3,000 | $3,000 | $3,000 | $3,000 | $3,000 | $3,000 |
| Dispatcher | 0% | $1,700 | $1,700 | $1,700 | $1,700 | $1,700 | $1,700 | $1,700 | $1,700 | $1,700 | $1,700 | $1,700 | $1,700 |
| Messenger | 0% | $1,440 | $1,440 | $1,440 | $1,440 | $1,440 | $1,440 | $1,440 | $1,440 | $1,440 | $1,440 | $1,440 | $1,440 |
| Messenger | 0% | $1,440 | $1,440 | $1,440 | $1,440 | $1,440 | $1,440 | $1,440 | $1,440 | $1,440 | $1,440 | $1,440 | $1,440 |
| Messenger | 0% | $1,440 | $1,440 | $1,440 | $1,440 | $1,440 | $1,440 | $1,440 | $1,440 | $1,440 | $1,440 | $1,440 | $1,440 |
| Messenger | 0% | $1,440 | $1,440 | $1,440 | $1,440 | $1,440 | $1,440 | $1,440 | $1,440 | $1,440 | $1,440 | $1,440 | $1,440 |
| Messenger | 0% | $1,440 | $1,440 | $1,440 | $1,440 | $1,440 | $1,440 | $1,440 | $1,440 | $1,440 | $1,440 | $1,440 | $1,440 |
| Messenger | 0% | $1,440 | $1,440 | $1,440 | $1,440 | $1,440 | $1,440 | $1,440 | $1,440 | $1,440 | $1,440 | $1,440 | $1,440 |
| Messenger | 0% | $1,440 | $1,440 | $1,440 | $1,440 | $1,440 | $1,440 | $1,440 | $1,440 | $1,440 | $1,440 | $1,440 | $1,440 |
| Total People | 0 | 0 | 0 | 0 | 0 | 0 | 0 | 0 | 0 | 0 | 0 | 0 | |
| Total Payroll | $14,780 | $14,780 | $14,780 | $14,780 | $14,780 | $14,780 | $14,780 | $14,780 | $14,780 | $14,780 | $14,780 | $14,780 | |
| General Assumptions | |||||||||||||
| Month 1 | Month 2 | Month 3 | Month 4 | Month 5 | Month 6 | Month 7 | Month 8 | Month 9 | Month 10 | Month 11 | Month 12 | ||
| Plan Month | 1 | 2 | 3 | 4 | 5 | 6 | 7 | 8 | 9 | 10 | 11 | 12 | |
| Current Interest Rate | 10.00% | 10.00% | 10.00% | 10.00% | 10.00% | 10.00% | 10.00% | 10.00% | 10.00% | 10.00% | 10.00% | 10.00% | |
| Long-term Interest Rate | 10.00% | 10.00% | 10.00% | 10.00% | 10.00% | 10.00% | 10.00% | 10.00% | 10.00% | 10.00% | 10.00% | 10.00% | |
| Tax Rate | 30.00% | 25.00% | 25.00% | 25.00% | 25.00% | 25.00% | 25.00% | 25.00% | 25.00% | 25.00% | 25.00% | 25.00% | |
| Other | 0 | 0 | 0 | 0 | 0 | 0 | 0 | 0 | 0 | 0 | 0 | 0 | |
| Pro Forma Profit and Loss | |||||||||||||
| Month 1 | Month 2 | Month 3 | Month 4 | Month 5 | Month 6 | Month 7 | Month 8 | Month 9 | Month 10 | Month 11 | Month 12 | ||
| Sales | $0 | $4,479 | $8,459 | $9,754 | $11,801 | $13,612 | $18,113 | $19,472 | $20,671 | $22,074 | $22,266 | $22,599 | |
| Direct Cost of Sales | $0 | $90 | $169 | $195 | $236 | $272 | $362 | $389 | $413 | $441 | $445 | $452 | |
| Other | $0 | $0 | $0 | $0 | $0 | $0 | $0 | $0 | $0 | $0 | $0 | $0 | |
| Total Cost of Sales | $0 | $90 | $169 | $195 | $236 | $272 | $362 | $389 | $413 | $441 | $445 | $452 | |
| Gross Margin | $0 | $4,389 | $8,290 | $9,559 | $11,565 | $13,340 | $17,751 | $19,083 | $20,258 | $21,633 | $21,821 | $22,147 | |
| Gross Margin % | 0.00% | 98.00% | 98.00% | 98.00% | 98.00% | 98.00% | 98.00% | 98.00% | 98.00% | 98.00% | 98.00% | 98.00% | |
| Expenses | |||||||||||||
| Payroll | $14,780 | $14,780 | $14,780 | $14,780 | $14,780 | $14,780 | $14,780 | $14,780 | $14,780 | $14,780 | $14,780 | $14,780 | |
| Sales and Marketing and Other Expenses | $250 | $250 | $250 | $250 | $250 | $250 | $250 | $250 | $250 | $250 | $250 | $250 | |
| Depreciation | $125 | $125 | $125 | $125 | $125 | $125 | $125 | $125 | $125 | $125 | $125 | $125 | |
| Cellular service | $350 | $350 | $350 | $350 | $350 | $350 | $350 | $350 | $350 | $350 | $350 | $350 | |
| Utilities | $100 | $100 | $100 | $100 | $100 | $100 | $100 | $100 | $100 | $100 | $100 | $100 | |
| Insurance | $150 | $150 | $150 | $150 | $150 | $150 | $150 | $150 | $150 | $150 | $150 | $150 | |
| Rent | $800 | $800 | $800 | $800 | $800 | $800 | $800 | $800 | $800 | $800 | $800 | $800 | |
| Payroll Taxes | 15% | $2,217 | $2,217 | $2,217 | $2,217 | $2,217 | $2,217 | $2,217 | $2,217 | $2,217 | $2,217 | $2,217 | $2,217 |
| Other | $0 | $0 | $0 | $0 | $0 | $0 | $0 | $0 | $0 | $0 | $0 | $0 | |
| Total Operating Expenses | $18,772 | $18,772 | $18,772 | $18,772 | $18,772 | $18,772 | $18,772 | $18,772 | $18,772 | $18,772 | $18,772 | $18,772 | |
| Profit Before Interest and Taxes | ($18,772) | ($14,383) | ($10,482) | ($9,213) | ($7,207) | ($5,432) | ($1,021) | $311 | $1,486 | $2,861 | $3,049 | $3,375 | |
| EBITDA | ($18,647) | ($14,258) | ($10,357) | ($9,088) | ($7,082) | ($5,307) | ($896) | $436 | $1,611 | $2,986 | $3,174 | $3,500 | |
| Interest Expense | $411 | $405 | $399 | $392 | $386 | $380 | $374 | $367 | $361 | $354 | $348 | $341 | |
| Taxes Incurred | $0 | $0 | $0 | $0 | $0 | $0 | $0 | $0 | $0 | $0 | $0 | $0 | |
| Net Profit | ($19,183) | ($14,787) | ($10,881) | ($9,605) | ($7,593) | ($5,812) | ($1,395) | ($57) | $1,125 | $2,506 | $2,701 | $3,034 | |
| Net Profit/Sales | 0.00% | -330.14% | -128.63% | -98.48% | -64.34% | -42.70% | -7.70% | -0.29% | 5.44% | 11.35% | 12.13% | 13.42% | |
| Pro Forma Cash Flow | |||||||||||||
| Month 1 | Month 2 | Month 3 | Month 4 | Month 5 | Month 6 | Month 7 | Month 8 | Month 9 | Month 10 | Month 11 | Month 12 | ||
| Cash Received | |||||||||||||
| Cash from Operations | |||||||||||||
| Cash Sales | $0 | $1,120 | $2,115 | $2,439 | $2,950 | $3,403 | $4,528 | $4,868 | $5,168 | $5,519 | $5,567 | $5,650 | |
| Cash from Receivables | $0 | $0 | $112 | $3,459 | $6,377 | $7,367 | $8,896 | $10,322 | $13,619 | $14,634 | $15,538 | $16,560 | |
| Subtotal Cash from Operations | $0 | $1,120 | $2,227 | $5,897 | $9,327 | $10,770 | $13,424 | $15,190 | $18,786 | $20,152 | $21,105 | $22,210 | |
| Additional Cash Received | |||||||||||||
| Sales Tax, VAT, HST/GST Received | 0.00% | $0 | $0 | $0 | $0 | $0 | $0 | $0 | $0 | $0 | $0 | $0 | $0 |
| New Current Borrowing | $0 | $0 | $0 | $0 | $0 | $0 | $0 | $0 | $0 | $0 | $0 | $0 | |
| New Other Liabilities (interest-free) | $0 | $0 | $0 | $0 | $0 | $0 | $0 | $0 | $0 | $0 | $0 | $0 | |
| New Long-term Liabilities | $0 | $0 | $0 | $0 | $0 | $0 | $0 | $0 | $0 | $0 | $0 | $0 | |
| Sales of Other Current Assets | $0 | $0 | $0 | $0 | $0 | $0 | $0 | $0 | $0 | $0 | $0 | $0 | |
| Sales of Long-term Assets | $0 | $0 | $0 | $0 | $0 | $0 | $0 | $0 | $0 | $0 | $0 | $0 | |
| New Investment Received | $0 | $0 | $0 | $0 | $0 | $0 | $0 | $0 | $0 | $0 | $0 | $0 | |
| Subtotal Cash Received | $0 | $1,120 | $2,227 | $5,897 | $9,327 | $10,770 | $13,424 | $15,190 | $18,786 | $20,152 | $21,105 | $22,210 | |
| Expenditures | Month 1 | Month 2 | Month 3 | Month 4 | Month 5 | Month 6 | Month 7 | Month 8 | Month 9 | Month 10 | Month 11 | Month 12 | |
| Expenditures from Operations | |||||||||||||
| Cash Spending | $14,780 | $14,780 | $14,780 | $14,780 | $14,780 | $14,780 | $14,780 | $14,780 | $14,780 | $14,780 | $14,780 | $14,780 | |
| Bill Payments | $143 | $4,280 | $4,364 | $4,435 | $4,456 | $4,490 | $4,522 | $4,604 | $4,624 | $4,642 | $4,663 | $4,660 | |
| Subtotal Spent on Operations | $14,923 | $19,060 | $19,144 | $19,215 | $19,236 | $19,270 | $19,302 | $19,384 | $19,404 | $19,422 | $19,443 | $19,440 | |
| Additional Cash Spent | |||||||||||||
| Sales Tax, VAT, HST/GST Paid Out | $0 | $0 | $0 | $0 | $0 | $0 | $0 | $0 | $0 | $0 | $0 | $0 | |
| Principal Repayment of Current Borrowing | $0 | $0 | $0 | $0 | $0 | $0 | $0 | $0 | $0 | $0 | $0 | $0 | |
| Other Liabilities Principal Repayment | $0 | $0 | $0 | $0 | $0 | $0 | $0 | $0 | $0 | $0 | $0 | $0 | |
| Long-term Liabilities Principal Repayment | $720 | $726 | $732 | $739 | $745 | $751 | $757 | $764 | $770 | $777 | $783 | $790 | |
| Purchase Other Current Assets | $0 | $0 | $0 | $0 | $0 | $0 | $0 | $0 | $0 | $0 | $0 | $0 | |
| Purchase Long-term Assets | $0 | $0 | $0 | $0 | $0 | $0 | $0 | $0 | $0 | $0 | $0 | $0 | |
| Dividends | $0 | $0 | $0 | $0 | $0 | $0 | $0 | $0 | $0 | $0 | $0 | $0 | |
| Subtotal Cash Spent | $15,643 | $19,787 | $19,876 | $19,954 | $19,980 | $20,021 | $20,059 | $20,147 | $20,174 | $20,199 | $20,226 | $20,230 | |
| Net Cash Flow | ($15,643) | ($18,667) | ($17,649) | ($14,057) | ($10,654) | ($9,252) | ($6,635) | ($4,958) | ($1,388) | ($46) | $879 | $1,980 | |
| Cash Balance | $85,557 | $66,890 | $49,241 | $35,184 | $24,530 | $15,279 | $8,644 | $3,686 | $2,298 | $2,252 | $3,131 | $5,111 | |
| Pro Forma Balance Sheet | |||||||||||||
| Month 1 | Month 2 | Month 3 | Month 4 | Month 5 | Month 6 | Month 7 | Month 8 | Month 9 | Month 10 | Month 11 | Month 12 | ||
| Assets | Starting Balances | ||||||||||||
| Current Assets | |||||||||||||
| Cash | $101,200 | $85,557 | $66,890 | $49,241 | $35,184 | $24,530 | $15,279 | $8,644 | $3,686 | $2,298 | $2,252 | $3,131 | $5,111 |
| Accounts Receivable | $0 | $0 | $3,359 | $9,592 | $13,448 | $15,922 | $18,765 | $23,453 | $27,736 | $29,620 | $31,542 | $32,703 | $33,092 |
| Other Current Assets | $0 | $0 | $0 | $0 | $0 | $0 | $0 | $0 | $0 | $0 | $0 | $0 | $0 |
| Total Current Assets | $101,200 | $85,557 | $70,249 | $58,832 | $48,632 | $40,453 | $34,043 | $32,097 | $31,422 | $31,918 | $33,794 | $35,834 | $38,203 |
| Long-term Assets | |||||||||||||
| Long-term Assets | $7,500 | $7,500 | $7,500 | $7,500 | $7,500 | $7,500 | $7,500 | $7,500 | $7,500 | $7,500 | $7,500 | $7,500 | $7,500 |
| Accumulated Depreciation | $0 | $125 | $250 | $375 | $500 | $625 | $750 | $875 | $1,000 | $1,125 | $1,250 | $1,375 | $1,500 |
| Total Long-term Assets | $7,500 | $7,375 | $7,250 | $7,125 | $7,000 | $6,875 | $6,750 | $6,625 | $6,500 | $6,375 | $6,250 | $6,125 | $6,000 |
| Total Assets | $108,700 | $92,932 | $77,499 | $65,957 | $55,632 | $47,328 | $40,793 | $38,722 | $37,922 | $38,293 | $40,044 | $41,959 | $44,203 |
| Liabilities and Capital | Month 1 | Month 2 | Month 3 | Month 4 | Month 5 | Month 6 | Month 7 | Month 8 | Month 9 | Month 10 | Month 11 | Month 12 | |
| Current Liabilities | |||||||||||||
| Accounts Payable | $0 | $4,135 | $4,216 | $4,287 | $4,306 | $4,340 | $4,368 | $4,449 | $4,470 | $4,487 | $4,507 | $4,505 | $4,505 |
| Current Borrowing | $0 | $0 | $0 | $0 | $0 | $0 | $0 | $0 | $0 | $0 | $0 | $0 | $0 |
| Other Current Liabilities | $0 | $0 | $0 | $0 | $0 | $0 | $0 | $0 | $0 | $0 | $0 | $0 | $0 |
| Subtotal Current Liabilities | $0 | $4,135 | $4,216 | $4,287 | $4,306 | $4,340 | $4,368 | $4,449 | $4,470 | $4,487 | $4,507 | $4,505 | $4,505 |
| Long-term Liabilities | $50,000 | $49,280 | $48,553 | $47,821 | $47,082 | $46,337 | $45,586 | $44,829 | $44,065 | $43,295 | $42,518 | $41,735 | $40,945 |
| Total Liabilities | $50,000 | $53,415 | $52,769 | $52,108 | $51,388 | $50,677 | $49,955 | $49,278 | $48,534 | $47,781 | $47,025 | $46,240 | $45,450 |
| Paid-in Capital | $60,000 | $60,000 | $60,000 | $60,000 | $60,000 | $60,000 | $60,000 | $60,000 | $60,000 | $60,000 | $60,000 | $60,000 | $60,000 |
| Retained Earnings | ($1,300) | ($1,300) | ($1,300) | ($1,300) | ($1,300) | ($1,300) | ($1,300) | ($1,300) | ($1,300) | ($1,300) | ($1,300) | ($1,300) | ($1,300) |
| Earnings | $0 | ($19,183) | ($33,970) | ($44,851) | ($54,456) | ($62,049) | ($67,861) | ($69,256) | ($69,313) | ($68,188) | ($65,682) | ($62,981) | ($59,947) |
| Total Capital | $58,700 | $39,517 | $24,730 | $13,849 | $4,244 | ($3,349) | ($9,161) | ($10,556) | ($10,613) | ($9,488) | ($6,982) | ($4,281) | ($1,247) |
| Total Liabilities and Capital | $108,700 | $92,932 | $77,499 | $65,957 | $55,632 | $47,328 | $40,793 | $38,722 | $37,922 | $38,293 | $40,044 | $41,959 | $44,203 |
| Net Worth | $58,700 | $39,517 | $24,730 | $13,849 | $4,244 | ($3,349) | ($9,161) | ($10,556) | ($10,613) | ($9,488) | ($6,982) | ($4,281) | ($1,247) |


