
BikeArt
Executive Summary
The Concept
BikeArt’s mission is to provide the customer with functional items and art work made out of recycled bicycle parts. The art work will be made by three local artists, one of which is Steve’s wife Shoodnt. Some of the featured products are: wall clocks, picture frames, chairs, tables, mobiles, wind chimes, book ends, kitchen utensil holders, and many other products.
BikeArt will be a stand-alone kiosk located in the busy Valley River Mall. Through the outstanding terms and conditions of its lease, BikeArt will be able to display its larger items on the surrounding floor space. This should significantly increase sales as walk through traffic in the mall is very high.
BikeArt is forecasted to reach profitability by month nine and will have profits of almost $40,000 by year three.
Beginnings
The first month will be used to set up the kiosk and get things underway. During this month the part-time employees will be hired and trained. Sales will begin slowly during this first month. From the second month on, sales will steadily increase from the flow of customers that pass by the kiosk.
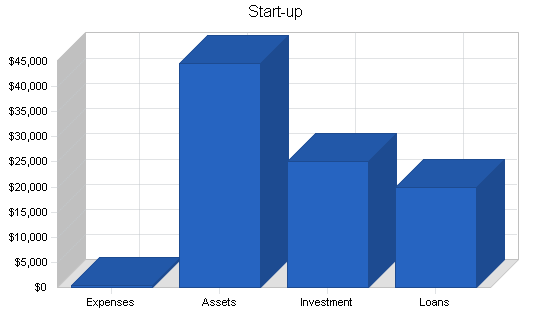
Total startup costs are $45,000. This will be financed through $25,000 put forward by Steve Useitagyen as equity and another $20,000 in a long-term small business loan.
The Company
The company will be a sole proprietorship owned and operated by Steve Useitagyen.
Steve Useitagyen is well qualified to work in this niche market. He received a joint degree in business administration and art design from the University of Portland. Throughout college Steve worked at a bicycle shop, initially as a mechanic, then moved up to sales, and then after college managed the shop for two years.
BikeArt will use three part-time employees to man the kiosk, in addition to Steve who will take care of the hiring, payroll, and purchasing.
The Market
BikeArt will target two market segments, industrial art aficionados and bicycle enthusiasts. Both of these groups are populous in Eugene. BikeArt is focusing on these two groups because they are the most likely consumers of this type of art work.
BikeArt has several competitors:
- Other retailers in the mall.
- Art galleries.
- Bicycle retailers.
BikeArt will leverage its competitive advantage of existing in a niche market by being the only retailer that exclusively deals with bicycle artwork. Since the mall gets lots of foot traffic all day, it is like having your own show room in the middle of the hallway of a crowded mall.
Success
The company plans to grow slowly and establish a sustainable level of sales and cash flow before seeking to expand. Once this is done, BikeArt will seek to set up other kiosks in Salem, Corvallis, and Portland. This expansion is estimated to occur sometime after year three.
The Break-even Analysis indicates $15,212 is needed in monthly revenue to reach the break-even point. Pricing of BikeArt’s products will be based on a desired net margin of 12%. Because BikeArt’s products will be locally created works of art, prices are estimated to range from $40 to $500 per piece.
The business is forecasted to reach profitability by month nine and will have revenues of $147,000 and profits of $35,500 by the end of year two.
1.1 Mission
BikeArt’s mission is to provide the customer with functional items and art work made out of recycled bicycle parts. We exist to attract and maintain customers. When we adhere to this maxim, everything else will fall into place. Our services will exceed the expectations of our customers.
1.2 Objectives
The objectives for the first three years of operation include:
- To create a product-based kiosk whose primary goal is to exceed customer’s expectations.
- The increase in the number of products sold by 20% each year.
- To develop a sustainable retail outlet that sells artwork and functional items made out of recycled parts.
-

Company Summary
BikeArt is a stand alone kiosk located in the Valley River Mall that sells pieces of art, furniture, and other items manufactured out of recycled bicycle parts. While some of the items are functional, they all can be considered art as they are aesthetically pleasing. In addition to the kiosk, BikeArt will warehouse their purchased products as well as do the back end accounting in Steve Useitagyen’s home. Steve is the founder and operator of BikeArt.
BikeArt will use three part-time employees to man the kiosk, in addition to Steve who will take care of the hiring, payroll, and purchasing.
The business is forecasted to reach profitability by month nine and will have revenues of $147,000 by the end of year two.
2.1 Company Ownership
BikeArt is a sole proprietorship founded and owned by Steve Useitagyen.
2.2 Start-up Summary
BikeArt will incur the following start-up costs:
- Wheeled kiosk.
- Cash register.
- Computer system with printer and Internet connection.
- Desk, chair, and file cabinet.
- Legal fees associated with business formation and contract review.
| Start-up | |
| Requirements | |
| Start-up Expenses | |
| Legal | $300 |
| Insurance | $0 |
| Rent | $0 |
| Other | $0 |
| Total Start-up Expenses | $300 |
| Start-up Assets | |
| Cash Required | $41,600 |
| Start-up Inventory | $0 |
| Other Current Assets | $0 |
| Long-term Assets | $3,100 |
| Total Assets | $44,700 |
| Total Requirements | $45,000 |
| Start-up Funding | |
| Start-up Expenses to Fund | $300 |
| Start-up Assets to Fund | $44,700 |
| Total Funding Required | $45,000 |
| Assets | |
| Non-cash Assets from Start-up | $3,100 |
| Cash Requirements from Start-up | $41,600 |
| Additional Cash Raised | $0 |
| Cash Balance on Starting Date | $41,600 |
| Total Assets | $44,700 |
| Liabilities and Capital | |
| Liabilities | |
| Current Borrowing | $0 |
| Long-term Liabilities | $20,000 |
| Accounts Payable (Outstanding Bills) | $0 |
| Other Current Liabilities (interest-free) | $0 |
| Total Liabilities | $20,000 |
| Capital | |
| Planned Investment | |
| Steve | $25,000 |
| Other | $0 |
| Additional Investment Requirement | $0 |
| Total Planned Investment | $25,000 |
| Loss at Start-up (Start-up Expenses) | ($300) |
| Total Capital | $24,700 |
| Total Capital and Liabilities | $44,700 |
| Total Funding | $45,000 |
Products
BikeArt will sell artwork manufactured from recycled bicycle parts. The art work will be made by three local artists, one of which is Steve’s wife Shoodnt. Some of the featured products are: wall clocks, picture frames, chairs, tables, mobiles, wind chimes, book ends, kitchen utensil holders, and many other products.
Market Analysis Summary
BikeArt’s customers can be broadly classified from coming from two different groups, those that appreciate industrial design artwork, and those who are bicycle enthusiasts and value anything having to do with cycling.
Being based in Eugene is very fortuitous for BikeArt. Eugene is a progressive city which tends to favor more industrial tastes compared with more conservative towns. Eugene is also a bicycling mecca, known nationwide for its affinity for cycling. Having such a high concentration of cycling enthusiasts provides a large population base of prospective customers.
4.1 Market Segmentation
BikeArt’s market can be divided into two groups, industrial art collectors and bicycle enthusiasts. The industrial art collectors are characterized by people who collect art with an industrial edge. Industrial art is typically characterized through the use of either technical looking structures or using parts that existed for another function for the basis of the art work. Industrial art is the opposite of organic art. Industrial is typically sharp angles, straight lines.
The other market is of bicyclist enthusiasts. Eugene is a bicyclist town, one of the hottest in the country. In a town of 130,000, there are three bicycle manufacturers, miles upon miles of bike lanes and independent bike paths. If you drive around town you will see just about everyone on bicycles, from small children to grandmothers. This culture will lend itself to BikeArt. The bicycle enthusiasts are people that ride a lot and appreciate anything related to bicycles, including bicycle art pieces.


| Market Analysis | |||||||
| Year 1 | Year 2 | Year 3 | Year 4 | Year 5 | |||
| Potential Customers | Growth | CAGR | |||||
| Industrial art collectors | 8% | 5,644 | 6,096 | 6,584 | 7,111 | 7,680 | 8.00% |
| Bicycling enthusiasts | 10% | 12,545 | 13,800 | 15,180 | 16,698 | 18,368 | 10.00% |
| Total | 9.39% | 18,189 | 19,896 | 21,764 | 23,809 | 26,048 | 9.39% |
4.2 Target Market Segment Strategy
BikeArt’s market can be divided into two groups, industrial art collectors and bicycle enthusiasts. The industrial art collectors are characterized by people who collect art with an industrial edge. Industrial art is typically characterized through the use of either technical looking structures or using parts that existed for another function for the basis of the art work. Industrial art is the opposite of organic art. Industrial is typically sharp angles, straight lines.
The other market is of bicyclist enthusiasts. Eugene is a bicyclist town, one of the hottest in the country. In a town of 130,000, there are three bicycle manufacturers, miles upon miles of bike lanes and independent bike paths. If you drive around town you will see just about everyone on bicycles, from small children to grandmothers. This culture will lend itself to BikeArt. The bicycle enthusiasts are people that ride a lot and appreciate anything related to bicycles, including bicycle art pieces.
4.3 Industry Analysis
BikeArt has several different competitors:
- Other retailers in the mall. For people that are shopping at BikeArt for gifts for other people, they are also likely to visit other retailers in the mall. While the other retailers are not direct competitors, their products will act as a substitute product.
- Art galleries. These retailers specifically sell different types of artwork. While some might specialize or carry a theme of industrial art, none of them sell bicycle-specific art. People that are looking for a wide range of art work are more likely to go to these retailers.
- Bicycle retailers. Some bicycle shops do carry gifts for cycling enthusiasts. Sometimes this gift section will be art work based on bicycles. Some of BikeArt’s artists also sell to bicycle shops so they might have identical pieces. The bicycle retailers do not however, have the same selection as BikeArt. As BikeArt grows, they will be able to leverage their vendors to make BikeArt the exclusive dealer for their bicycle art.
Strategy and Implementation Summary
BikeArt will leverage its competitive advantage of being the only retailer that exclusively deals with bicycle artwork. This is significant as Eugene is truly a bicycling town. BikeArt will also be able to use its outstanding terms and conditions of their lease with Valley River Center that allows them to display their products not only on the kiosk itself but also on the surrounding floor space. Since the mall gets lots of foot traffic all day, it is like having your own show room in the middle of the hallway of a crowded mall. Most retailers could only dream of this arrangement.
5.1 Competitive Edge
BikeArt’s competitive edge is its specialization in bicycle art. No one else concentrates on this specific type of art. This is truly a competitive edge since BikeArt is based in Eugene, Biketown USA. By only concentrating on this niche, prospective customers will correctly assume that BikeArt has the largest selection and are more likely to come to BikeArt as opposed to going to a bicycle shop looking for some art.
5.2 Sales Strategy
BikeArt’s sales strategy will be based on display and local/environmental support. BikeArt will be able to leverage the outstanding terms of their lease with the mall that allows them to occupy seven feet of floor space in all directions around the kiosk. This space will provide BikeArt with ample area to display larger pieces that they sell. Because they are located in the mall, there will be sufficient walk-through traffic to notice all of BikeArt’s wares on display. This will be the first step in the sale process.
The second step is emphasizing all of the work that is done by local artists and all of the art pieces are made out of recycled bicycle parts. Eugene in general seems to be a very close knit supportive town of local residents, and Eugene shows their support of their own through the purchase of local products. Additionally, all of the artwork is made out of recycled bicycle parts which will be emphasized as an environmentally sound practice, something that will be warmly received by Eugenians.
5.2.1 Sales Forecast
The first month will be used to set up the kiosk and get things underway. During this month the part-time employees will be hired and trained. Sales will begin slowly during this first month. From the second month on, sales will steadily increase because there will be a steady flow of customers that pass by the kiosk.

| Sales Forecast | |||
| Year 1 | Year 2 | Year 3 | |
| Sales | |||
| Industrial art collectors | $58,229 | $115,475 | $126,547 |
| Bicycling enthusiasts | $87,531 | $178,745 | $189,785 |
| Total Sales | $145,760 | $294,220 | $316,332 |
| Direct Cost of Sales | Year 1 | Year 2 | Year 3 |
| Industrial art collectors | $29,115 | $57,738 | $63,274 |
| Bicycling enthusiasts | $43,766 | $89,373 | $94,893 |
| Subtotal Direct Cost of Sales | $72,880 | $147,110 | $158,166 |
5.3 Milestones
BikeArt will have several milestones early on:
- Business plan completion. This will be done as a road map for the organization. While we do not need a business plan to raise capital, it will be an indispensable tool for the ongoing performance and improvement of the company.
- Set up the kiosk.
- First turnover of inventory.
- Revenue exceeding $25,000.
| Milestones | |||||
| Milestone | Start Date | End Date | Budget | Manager | Department |
| Business plan completion | 1/1/2001 | 2/1/2001 | $0 | ABC | Marketing |
| Set up the kiosk | 1/1/2001 | 2/1/2001 | $0 | ABC | Department |
| First turnover of inventory | 1/1/2001 | ****** | $0 | ABC | Department |
| Totals | $0 | ||||
Management Summary
Steve Useitagyen received a joint degree in business administration and art design from the University of Portland. Throughout college Steve worked at a bicycle shop, initially as a mechanic, then moved up to sales, and then after college managed the shop for two years.
Steve knew at some point in his life that he needed to have his own business as he preferred to work for himself as opposed to someone else. It took his experience as manager of the bike shop to gain the confidence that he could operate his own business. With assurances of his wife’s support and her contribution of art work to sell, Steve undertook the task of writing a business plan for his dream.
6.1 Personnel Plan
Steve will begin the first two weeks setting up the kiosk and interviewing people. During the second half of the first month Steve will hire and train three part-time people to operate the kiosk during the day.
From month two on, there will always be one of the part-time employees running the kiosk. Steve will be taking care of all the financials, setting up vendor relations, and correcting any problems that BikeArt encounters.
| Personnel Plan | |||
| Year 1 | Year 2 | Year 3 | |
| Steve | $36,000 | $40,000 | $44,000 |
| Part-time employee | $10,100 | $10,800 | $10,800 |
| Part-time employee | $10,100 | $10,800 | $10,800 |
| Part-time employee | $10,100 | $10,800 | $10,800 |
| Total People | 4 | 4 | 4 |
| Total Payroll | $66,300 | $72,400 | $76,400 |
Financial Plan
The following sections will outline the important financial assumptions, key financial indicators, Break-even Analysis, profit and loss, cash flow, and balance sheet.
7.1 Important Assumptions
The following table highlights some of the important financial assumptions for BikeArt.
| General Assumptions | |||
| Year 1 | Year 2 | Year 3 | |
| Plan Month | 1 | 2 | 3 |
| Current Interest Rate | 10.00% | 10.00% | 10.00% |
| Long-term Interest Rate | 10.00% | 10.00% | 10.00% |
| Tax Rate | 25.42% | 25.00% | 25.42% |
| Other | 0 | 0 | 0 |
7.2 Break-even Analysis
The Break-even Analysis indicates $15,212 is needed in monthly revenue to reach the break-even point.

| Break-even Analysis | |
| Monthly Revenue Break-even | $15,212 |
| Assumptions: | |
| Average Percent Variable Cost | 50% |
| Estimated Monthly Fixed Cost | $7,606 |
7.3 Projected Profit and Loss
The following table will indicate projected profit and loss.
| Pro Forma Profit and Loss | |||
| Year 1 | Year 2 | Year 3 | |
| Sales | $145,760 | $294,220 | $316,332 |
| Direct Cost of Sales | $72,880 | $147,110 | $158,166 |
| Other | $0 | $0 | $0 |
| Total Cost of Sales | $72,880 | $147,110 | $158,166 |
| Gross Margin | $72,880 | $147,110 | $158,166 |
| Gross Margin % | 50.00% | 50.00% | 50.00% |
| Expenses | |||
| Payroll | $66,300 | $72,400 | $76,400 |
| Sales and Marketing and Other Expenses | $0 | $0 | $0 |
| Depreciation | $624 | $624 | $624 |
| Leased Equipment | $0 | $0 | $0 |
| Utilities | $1,200 | $1,200 | $1,200 |
| Insurance | $1,200 | $1,200 | $1,200 |
| Rent | $12,000 | $12,000 | $12,000 |
| Payroll Taxes | $9,945 | $10,860 | $11,460 |
| Other | $0 | $0 | $0 |
| Total Operating Expenses | $91,269 | $98,284 | $102,884 |
| Profit Before Interest and Taxes | ($18,389) | $48,826 | $55,282 |
| EBITDA | ($17,765) | $49,450 | $55,906 |
| Interest Expense | $1,745 | $1,258 | $703 |
| Taxes Incurred | $0 | $11,892 | $13,872 |
| Net Profit | ($20,134) | $35,676 | $40,706 |
| Net Profit/Sales | -13.81% | 12.13% | 12.87% |
7.4 Projected Cash Flow
The following chart and table will indicate projected cash flow.

| Pro Forma Cash Flow | |||
| Year 1 | Year 2 | Year 3 | |
| Cash Received | |||
| Cash from Operations | |||
| Cash Sales | $145,760 | $294,220 | $316,332 |
| Subtotal Cash from Operations | $145,760 | $294,220 | $316,332 |
| Additional Cash Received | |||
| Sales Tax, VAT, HST/GST Received | $0 | $0 | $0 |
| New Current Borrowing | $0 | $0 | $0 |
| New Other Liabilities (interest-free) | $0 | $0 | $0 |
| New Long-term Liabilities | $0 | $0 | $0 |
| Sales of Other Current Assets | $0 | $0 | $0 |
| Sales of Long-term Assets | $0 | $0 | $0 |
| New Investment Received | $0 | $0 | $0 |
| Subtotal Cash Received | $145,760 | $294,220 | $316,332 |
| Expenditures | Year 1 | Year 2 | Year 3 |
| Expenditures from Operations | |||
| Cash Spending | $66,300 | $72,400 | $76,400 |
| Bill Payments | $97,938 | $194,917 | $200,247 |
| Subtotal Spent on Operations | $164,238 | $267,317 | $276,647 |
| Additional Cash Spent | |||
| Sales Tax, VAT, HST/GST Paid Out | $0 | $0 | $0 |
| Principal Repayment of Current Borrowing | $0 | $0 | $0 |
| Other Liabilities Principal Repayment | $0 | $0 | $0 |
| Long-term Liabilities Principal Repayment | $4,783 | $5,270 | $5,825 |
| Purchase Other Current Assets | $0 | $0 | $0 |
| Purchase Long-term Assets | $0 | $0 | $0 |
| Dividends | $0 | $0 | $0 |
| Subtotal Cash Spent | $169,021 | $272,586 | $282,472 |
| Net Cash Flow | ($23,261) | $21,634 | $33,860 |
| Cash Balance | $18,339 | $39,973 | $73,833 |
7.5 Projected Balance Sheet
The following table will indicate the projected balance sheet.
| Pro Forma Balance Sheet | |||
| Year 1 | Year 2 | Year 3 | |
| Assets | |||
| Current Assets | |||
| Cash | $18,339 | $39,973 | $73,833 |
| Inventory | $12,204 | $24,634 | $26,485 |
| Other Current Assets | $0 | $0 | $0 |
| Total Current Assets | $30,543 | $64,607 | $100,319 |
| Long-term Assets | |||
| Long-term Assets | $3,100 | $3,100 | $3,100 |
| Accumulated Depreciation | $624 | $1,248 | $1,872 |
| Total Long-term Assets | $2,476 | $1,852 | $1,228 |
| Total Assets | $33,019 | $66,459 | $101,547 |
| Liabilities and Capital | Year 1 | Year 2 | Year 3 |
| Current Liabilities | |||
| Accounts Payable | $13,236 | $16,270 | $16,476 |
| Current Borrowing | $0 | $0 | $0 |
| Other Current Liabilities | $0 | $0 | $0 |
| Subtotal Current Liabilities | $13,236 | $16,270 | $16,476 |
| Long-term Liabilities | $15,217 | $9,947 | $4,123 |
| Total Liabilities | $28,453 | $26,217 | $20,598 |
| Paid-in Capital | $25,000 | $25,000 | $25,000 |
| Retained Earnings | ($300) | ($20,434) | $15,242 |
| Earnings | ($20,134) | $35,676 | $40,706 |
| Total Capital | $4,566 | $40,242 | $80,948 |
| Total Liabilities and Capital | $33,019 | $66,459 | $101,547 |
| Net Worth | $4,566 | $40,242 | $80,948 |
Appendix
| Sales Forecast | |||||||||||||
| Month 1 | Month 2 | Month 3 | Month 4 | Month 5 | Month 6 | Month 7 | Month 8 | Month 9 | Month 10 | Month 11 | Month 12 | ||
| Sales | |||||||||||||
| Industrial art collectors | 0% | $0 | $1,245 | $1,854 | $2,354 | $2,987 | $4,254 | $5,385 | $6,458 | $7,548 | $8,254 | $8,745 | $9,145 |
| Bicycling enthusiasts | 0% | $0 | $2,245 | $3,258 | $4,214 | $5,214 | $7,245 | $8,457 | $9,365 | $10,255 | $11,547 | $12,687 | $13,044 |
| Total Sales | $0 | $3,490 | $5,112 | $6,568 | $8,201 | $11,499 | $13,842 | $15,823 | $17,803 | $19,801 | $21,432 | $22,189 | |
| Direct Cost of Sales | Month 1 | Month 2 | Month 3 | Month 4 | Month 5 | Month 6 | Month 7 | Month 8 | Month 9 | Month 10 | Month 11 | Month 12 | |
| Industrial art collectors | $0 | $623 | $927 | $1,177 | $1,494 | $2,127 | $2,693 | $3,229 | $3,774 | $4,127 | $4,373 | $4,573 | |
| Bicycling enthusiasts | $0 | $1,123 | $1,629 | $2,107 | $2,607 | $3,623 | $4,229 | $4,683 | $5,128 | $5,774 | $6,344 | $6,522 | |
| Subtotal Direct Cost of Sales | $0 | $1,745 | $2,556 | $3,284 | $4,101 | $5,750 | $6,921 | $7,912 | $8,902 | $9,901 | $10,716 | $11,095 | |
| Personnel Plan | |||||||||||||
| Month 1 | Month 2 | Month 3 | Month 4 | Month 5 | Month 6 | Month 7 | Month 8 | Month 9 | Month 10 | Month 11 | Month 12 | ||
| Steve | 0% | $3,000 | $3,000 | $3,000 | $3,000 | $3,000 | $3,000 | $3,000 | $3,000 | $3,000 | $3,000 | $3,000 | $3,000 |
| Part-time employee | 0% | $200 | $900 | $900 | $900 | $900 | $900 | $900 | $900 | $900 | $900 | $900 | $900 |
| Part-time employee | 0% | $200 | $900 | $900 | $900 | $900 | $900 | $900 | $900 | $900 | $900 | $900 | $900 |
| Part-time employee | 0% | $200 | $900 | $900 | $900 | $900 | $900 | $900 | $900 | $900 | $900 | $900 | $900 |
| Total People | 4 | 4 | 4 | 4 | 4 | 4 | 4 | 4 | 4 | 4 | 4 | 4 | |
| Total Payroll | $3,600 | $5,700 | $5,700 | $5,700 | $5,700 | $5,700 | $5,700 | $5,700 | $5,700 | $5,700 | $5,700 | $5,700 | |
| General Assumptions | |||||||||||||
| Month 1 | Month 2 | Month 3 | Month 4 | Month 5 | Month 6 | Month 7 | Month 8 | Month 9 | Month 10 | Month 11 | Month 12 | ||
| Plan Month | 1 | 2 | 3 | 4 | 5 | 6 | 7 | 8 | 9 | 10 | 11 | 12 | |
| Current Interest Rate | 10.00% | 10.00% | 10.00% | 10.00% | 10.00% | 10.00% | 10.00% | 10.00% | 10.00% | 10.00% | 10.00% | 10.00% | |
| Long-term Interest Rate | 10.00% | 10.00% | 10.00% | 10.00% | 10.00% | 10.00% | 10.00% | 10.00% | 10.00% | 10.00% | 10.00% | 10.00% | |
| Tax Rate | 30.00% | 25.00% | 25.00% | 25.00% | 25.00% | 25.00% | 25.00% | 25.00% | 25.00% | 25.00% | 25.00% | 25.00% | |
| Other | 0 | 0 | 0 | 0 | 0 | 0 | 0 | 0 | 0 | 0 | 0 | 0 | |
| Pro Forma Profit and Loss | |||||||||||||
| Month 1 | Month 2 | Month 3 | Month 4 | Month 5 | Month 6 | Month 7 | Month 8 | Month 9 | Month 10 | Month 11 | Month 12 | ||
| Sales | $0 | $3,490 | $5,112 | $6,568 | $8,201 | $11,499 | $13,842 | $15,823 | $17,803 | $19,801 | $21,432 | $22,189 | |
| Direct Cost of Sales | $0 | $1,745 | $2,556 | $3,284 | $4,101 | $5,750 | $6,921 | $7,912 | $8,902 | $9,901 | $10,716 | $11,095 | |
| Other | $0 | $0 | $0 | $0 | $0 | $0 | $0 | $0 | $0 | $0 | $0 | $0 | |
| Total Cost of Sales | $0 | $1,745 | $2,556 | $3,284 | $4,101 | $5,750 | $6,921 | $7,912 | $8,902 | $9,901 | $10,716 | $11,095 | |
| Gross Margin | $0 | $1,745 | $2,556 | $3,284 | $4,101 | $5,750 | $6,921 | $7,912 | $8,902 | $9,901 | $10,716 | $11,095 | |
| Gross Margin % | 0.00% | 50.00% | 50.00% | 50.00% | 50.00% | 50.00% | 50.00% | 50.00% | 50.00% | 50.00% | 50.00% | 50.00% | |
| Expenses | |||||||||||||
| Payroll | $3,600 | $5,700 | $5,700 | $5,700 | $5,700 | $5,700 | $5,700 | $5,700 | $5,700 | $5,700 | $5,700 | $5,700 | |
| Sales and Marketing and Other Expenses | $0 | $0 | $0 | $0 | $0 | $0 | $0 | $0 | $0 | $0 | $0 | $0 | |
| Depreciation | $52 | $52 | $52 | $52 | $52 | $52 | $52 | $52 | $52 | $52 | $52 | $52 | |
| Leased Equipment | $0 | $0 | $0 | $0 | $0 | $0 | $0 | $0 | $0 | $0 | $0 | $0 | |
| Utilities | $100 | $100 | $100 | $100 | $100 | $100 | $100 | $100 | $100 | $100 | $100 | $100 | |
| Insurance | $100 | $100 | $100 | $100 | $100 | $100 | $100 | $100 | $100 | $100 | $100 | $100 | |
| Rent | $1,000 | $1,000 | $1,000 | $1,000 | $1,000 | $1,000 | $1,000 | $1,000 | $1,000 | $1,000 | $1,000 | $1,000 | |
| Payroll Taxes | 15% | $540 | $855 | $855 | $855 | $855 | $855 | $855 | $855 | $855 | $855 | $855 | $855 |
| Other | $0 | $0 | $0 | $0 | $0 | $0 | $0 | $0 | $0 | $0 | $0 | $0 | |
| Total Operating Expenses | $5,392 | $7,807 | $7,807 | $7,807 | $7,807 | $7,807 | $7,807 | $7,807 | $7,807 | $7,807 | $7,807 | $7,807 | |
| Profit Before Interest and Taxes | ($5,392) | ($6,062) | ($5,251) | ($4,523) | ($3,707) | ($2,058) | ($886) | $105 | $1,095 | $2,094 | $2,909 | $3,288 | |
| EBITDA | ($5,340) | ($6,010) | ($5,199) | ($4,471) | ($3,655) | ($2,006) | ($834) | $157 | $1,147 | $2,146 | $2,961 | $3,340 | |
| Interest Expense | $163 | $160 | $157 | $154 | $151 | $147 | $144 | $141 | $137 | $134 | $130 | $127 | |
| Taxes Incurred | $0 | $0 | $0 | $0 | $0 | $0 | $0 | $0 | $0 | $0 | $0 | $0 | |
| Net Profit | ($5,555) | ($6,222) | ($5,408) | ($4,677) | ($3,857) | ($2,205) | ($1,030) | ($36) | $957 | $1,960 | $2,779 | $3,161 | |
| Net Profit/Sales | 0.00% | -178.29% | -105.79% | -71.21% | -47.03% | -19.17% | -7.44% | -0.23% | 5.38% | 9.90% | 12.97% | 14.24% | |
| Pro Forma Cash Flow | |||||||||||||
| Month 1 | Month 2 | Month 3 | Month 4 | Month 5 | Month 6 | Month 7 | Month 8 | Month 9 | Month 10 | Month 11 | Month 12 | ||
| Cash Received | |||||||||||||
| Cash from Operations | |||||||||||||
| Cash Sales | $0 | $3,490 | $5,112 | $6,568 | $8,201 | $11,499 | $13,842 | $15,823 | $17,803 | $19,801 | $21,432 | $22,189 | |
| Subtotal Cash from Operations | $0 | $3,490 | $5,112 | $6,568 | $8,201 | $11,499 | $13,842 | $15,823 | $17,803 | $19,801 | $21,432 | $22,189 | |
| Additional Cash Received | |||||||||||||
| Sales Tax, VAT, HST/GST Received | 0.00% | $0 | $0 | $0 | $0 | $0 | $0 | $0 | $0 | $0 | $0 | $0 | $0 |
| New Current Borrowing | $0 | $0 | $0 | $0 | $0 | $0 | $0 | $0 | $0 | $0 | $0 | $0 | |
| New Other Liabilities (interest-free) | $0 | $0 | $0 | $0 | $0 | $0 | $0 | $0 | $0 | $0 | $0 | $0 | |
| New Long-term Liabilities | $0 | $0 | $0 | $0 | $0 | $0 | $0 | $0 | $0 | $0 | $0 | $0 | |
| Sales of Other Current Assets | $0 | $0 | $0 | $0 | $0 | $0 | $0 | $0 | $0 | $0 | $0 | $0 | |
| Sales of Long-term Assets | $0 | $0 | $0 | $0 | $0 | $0 | $0 | $0 | $0 | $0 | $0 | $0 | |
| New Investment Received | $0 | $0 | $0 | $0 | $0 | $0 | $0 | $0 | $0 | $0 | $0 | $0 | |
| Subtotal Cash Received | $0 | $3,490 | $5,112 | $6,568 | $8,201 | $11,499 | $13,842 | $15,823 | $17,803 | $19,801 | $21,432 | $22,189 | |
| Expenditures | Month 1 | Month 2 | Month 3 | Month 4 | Month 5 | Month 6 | Month 7 | Month 8 | Month 9 | Month 10 | Month 11 | Month 12 | |
| Expenditures from Operations | |||||||||||||
| Cash Spending | $3,600 | $5,700 | $5,700 | $5,700 | $5,700 | $5,700 | $5,700 | $5,700 | $5,700 | $5,700 | $5,700 | $5,700 | |
| Bill Payments | $63 | $2,036 | $5,872 | $5,681 | $6,324 | $7,290 | $9,787 | $10,435 | $11,229 | $12,216 | $13,208 | $13,795 | |
| Subtotal Spent on Operations | $3,663 | $7,736 | $11,572 | $11,381 | $12,024 | $12,990 | $15,487 | $16,135 | $16,929 | $17,916 | $18,908 | $19,495 | |
| Additional Cash Spent | |||||||||||||
| Sales Tax, VAT, HST/GST Paid Out | $0 | $0 | $0 | $0 | $0 | $0 | $0 | $0 | $0 | $0 | $0 | $0 | |
| Principal Repayment of Current Borrowing | $0 | $0 | $0 | $0 | $0 | $0 | $0 | $0 | $0 | $0 | $0 | $0 | |
| Other Liabilities Principal Repayment | $0 | $0 | $0 | $0 | $0 | $0 | $0 | $0 | $0 | $0 | $0 | $0 | |
| Long-term Liabilities Principal Repayment | $381 | $384 | $387 | $390 | $393 | $397 | $400 | $403 | $407 | $410 | $414 | $417 | |
| Purchase Other Current Assets | $0 | $0 | $0 | $0 | $0 | $0 | $0 | $0 | $0 | $0 | $0 | $0 | |
| Purchase Long-term Assets | $0 | $0 | $0 | $0 | $0 | $0 | $0 | $0 | $0 | $0 | $0 | $0 | |
| Dividends | $0 | $0 | $0 | $0 | $0 | $0 | $0 | $0 | $0 | $0 | $0 | $0 | |
| Subtotal Cash Spent | $4,044 | $8,120 | $11,959 | $11,771 | $12,417 | $13,386 | $15,887 | $16,538 | $17,336 | $18,326 | $19,322 | $19,912 | |
| Net Cash Flow | ($4,044) | ($4,630) | ($6,847) | ($5,203) | ($4,216) | ($1,887) | ($2,045) | ($715) | $467 | $1,475 | $2,110 | $2,277 | |
| Cash Balance | $37,556 | $32,926 | $26,079 | $20,875 | $16,659 | $14,772 | $12,727 | $12,011 | $12,478 | $13,952 | $16,062 | $18,339 | |
| Pro Forma Balance Sheet | |||||||||||||
| Month 1 | Month 2 | Month 3 | Month 4 | Month 5 | Month 6 | Month 7 | Month 8 | Month 9 | Month 10 | Month 11 | Month 12 | ||
| Assets | Starting Balances | ||||||||||||
| Current Assets | |||||||||||||
| Cash | $41,600 | $37,556 | $32,926 | $26,079 | $20,875 | $16,659 | $14,772 | $12,727 | $12,011 | $12,478 | $13,952 | $16,062 | $18,339 |
| Inventory | $0 | $0 | $1,920 | $2,812 | $3,612 | $4,511 | $6,324 | $7,613 | $8,703 | $9,792 | $10,891 | $11,788 | $12,204 |
| Other Current Assets | $0 | $0 | $0 | $0 | $0 | $0 | $0 | $0 | $0 | $0 | $0 | $0 | $0 |
| Total Current Assets | $41,600 | $37,556 | $34,846 | $28,891 | $24,488 | $21,170 | $21,096 | $20,340 | $20,714 | $22,270 | $24,843 | $27,850 | $30,543 |
| Long-term Assets | |||||||||||||
| Long-term Assets | $3,100 | $3,100 | $3,100 | $3,100 | $3,100 | $3,100 | $3,100 | $3,100 | $3,100 | $3,100 | $3,100 | $3,100 | $3,100 |
| Accumulated Depreciation | $0 | $52 | $104 | $156 | $208 | $260 | $312 | $364 | $416 | $468 | $520 | $572 | $624 |
| Total Long-term Assets | $3,100 | $3,048 | $2,996 | $2,944 | $2,892 | $2,840 | $2,788 | $2,736 | $2,684 | $2,632 | $2,580 | $2,528 | $2,476 |
| Total Assets | $44,700 | $40,604 | $37,842 | $31,835 | $27,380 | $24,010 | $23,884 | $23,076 | $23,398 | $24,902 | $27,423 | $30,378 | $33,019 |
| Liabilities and Capital | Month 1 | Month 2 | Month 3 | Month 4 | Month 5 | Month 6 | Month 7 | Month 8 | Month 9 | Month 10 | Month 11 | Month 12 | |
| Current Liabilities | |||||||||||||
| Accounts Payable | $0 | $1,840 | $5,684 | $5,472 | $6,084 | $6,964 | $9,440 | $10,062 | $10,823 | $11,777 | $12,749 | $13,338 | $13,236 |
| Current Borrowing | $0 | $0 | $0 | $0 | $0 | $0 | $0 | $0 | $0 | $0 | $0 | $0 | $0 |
| Other Current Liabilities | $0 | $0 | $0 | $0 | $0 | $0 | $0 | $0 | $0 | $0 | $0 | $0 | $0 |
| Subtotal Current Liabilities | $0 | $1,840 | $5,684 | $5,472 | $6,084 | $6,964 | $9,440 | $10,062 | $10,823 | $11,777 | $12,749 | $13,338 | $13,236 |
| Long-term Liabilities | $20,000 | $19,619 | $19,236 | $18,849 | $18,459 | $18,065 | $17,668 | $17,268 | $16,865 | $16,458 | $16,048 | $15,634 | $15,217 |
| Total Liabilities | $20,000 | $21,460 | $24,920 | $24,320 | $24,543 | $25,029 | $27,109 | $27,330 | $27,688 | $28,235 | $28,796 | $28,972 | $28,453 |
| Paid-in Capital | $25,000 | $25,000 | $25,000 | $25,000 | $25,000 | $25,000 | $25,000 | $25,000 | $25,000 | $25,000 | $25,000 | $25,000 | $25,000 |
| Retained Earnings | ($300) | ($300) | ($300) | ($300) | ($300) | ($300) | ($300) | ($300) | ($300) | ($300) | ($300) | ($300) | ($300) |
| Earnings | $0 | ($5,555) | ($11,778) | ($17,186) | ($21,863) | ($25,720) | ($27,924) | ($28,954) | ($28,990) | ($28,033) | ($26,073) | ($23,295) | ($20,134) |
| Total Capital | $24,700 | $19,145 | $12,922 | $7,514 | $2,837 | ($1,020) | ($3,224) | ($4,254) | ($4,290) | ($3,333) | ($1,373) | $1,405 | $4,566 |
| Total Liabilities and Capital | $44,700 | $40,604 | $37,842 | $31,835 | $27,380 | $24,010 | $23,884 | $23,076 | $23,398 | $24,902 | $27,423 | $30,378 | $33,019 |
| Net Worth | $24,700 | $19,145 | $12,922 | $7,514 | $2,837 | ($1,020) | ($3,224) | ($4,254) | ($4,290) | ($3,333) | ($1,373) | $1,405 | $4,566 |


