
Margarita Momma
Executive Summary
Margarita Momma is a frozen drink machine rental service. We will specialize in church functions, children and adult birthday parties, weddings, and barbecues. We plan to set up concession services at local and fund-raising events within the Copperas Cove, Ft. Hood, and Killeen areas. The frozen beverage can have alcohol, but is enjoyable without as well. However, if the customers choose to have alcohol in the drinks, they must purchase it, and add it, themselves. This is a unique service for the area; however, frozen drink machine rentals have been growing throughout the nation.
The chosen beverage concentrate has natural flavorings, and few preservatives. This makes the concentrate far superior, both in quality and in taste, to the other brands on the market. We provide a quality far beyond that found at convenience stores which offer frozen drinks.
Margarita Momma will deliver the machine with everything necessary for making the gathering a success. The cart delivery includes: 50 nine-ounce cups, straws, and salt (if needed for margaritas). The only thing the customer must provide is fun! Delivery also includes the mix, and the mixing of the first batch. This is where the customer would provide and add any alcohol to the drinks. The cart is provided by Margarita Momma so there will be easy delivery, as well as to minimize the chance of any furniture damage. The cart has a deep tray which will help contain spills, and to further reduce furniture/carpet damage. Next morning’s pick-up is provided for in the rental cost, and will be performed at a time convenient for the customer.
In order to begin renting, Margarita Momma requires $11,960 to purchase three Frosty Factory machines, ten cases of concentrate, two cases of cups, and two cases of straws.

1.1 Objectives
The objectives for this business plan are specific goals which are achievable by Margarita Momma in the first few years of operation. These objectives are outlined below:
- Sales of $2,000 for each of the first two months, and steady growth continuing for all of Year 1.
- To increase from three to six machines in Year 1.
- To go full time within nine months.
1.2 Mission
Margarita Momma will provide the community with an alternative beverage to be served at any event for any age group. We will provide delivery, and complete setup, making the first batch of mix for the customer. Machines will be delivered well in advance of party time so that the mix will be ready. The cost of the rental includes: cups, one mix, salt, straws, and written instructions. Extra mixes can be purchased for an additional charge, at the time of rental; but one mix is sufficient for most events. Pick up the day after will also be provided for the convenience of the customers.
1.3 Keys to Success
The following facets of Margarita Momma ensure its financial success:
- Unique services, unmatched in both quality and presentation.
- Low operating overhead.
- Beneficial word-of-mouth advertising.
- A healthy, versatile drink which is suitable for all ages.
Company Summary
Margarita Momma is a new company to this area that provides frozen beverage machine rentals to the individual, whether it’s a nonprofit organization or a child’s birthday party. The frozen beverage is versatile; it can be either a slurpee or a frozen cocktail.
2.1 Company Ownership
Margarita Momma will be created as a Sole Proprietorship, owned by its founder, Greta Guidry. The company will be operated from the owner’s home.
2.2 Company Locations and Facilities
This business will be operated out of my residence at (address withheld for sample plan purposes).
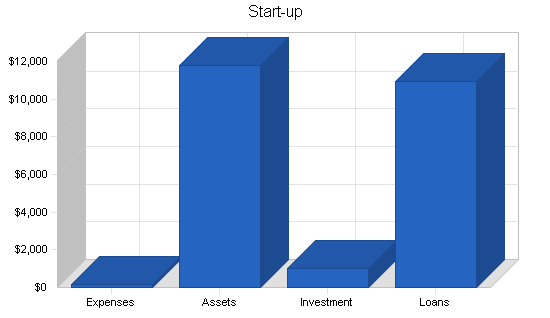
2.3 Start-up Summary
Our start-up costs come to $11,960. This number includes three machines, three carts, mix, cups, straws, magnetic sign for delivery vehicle, business cards, and flyers. The details are included in the following table and chart.
| Start-up | |
| Requirements | |
| Start-up Expenses | |
| Legal | $11 |
| Business Cards | $10 |
| Brochures, Flyers, etc. | $20 |
| Software | $90 |
| Magnetic Sign | $30 |
| Total Start-up Expenses | $161 |
| Start-up Assets | |
| Cash Required | $839 |
| Start-up Inventory | $700 |
| Other Current Assets | $1,260 |
| Long-term Assets | $9,000 |
| Total Assets | $11,799 |
| Total Requirements | $11,960 |
| Start-up Funding | |
| Start-up Expenses to Fund | $161 |
| Start-up Assets to Fund | $11,799 |
| Total Funding Required | $11,960 |
| Assets | |
| Non-cash Assets from Start-up | $10,960 |
| Cash Requirements from Start-up | $839 |
| Additional Cash Raised | $0 |
| Cash Balance on Starting Date | $839 |
| Total Assets | $11,799 |
| Liabilities and Capital | |
| Liabilities | |
| Current Borrowing | $0 |
| Long-term Liabilities | $10,960 |
| Accounts Payable (Outstanding Bills) | $0 |
| Other Current Liabilities (interest-free) | $0 |
| Total Liabilities | $10,960 |
| Capital | |
| Planned Investment | |
| Greta Guidry | $1,000 |
| Other | $0 |
| Additional Investment Requirement | $0 |
| Total Planned Investment | $1,000 |
| Loss at Start-up (Start-up Expenses) | ($161) |
| Total Capital | $839 |
| Total Capital and Liabilities | $11,799 |
| Total Funding | $11,960 |
Services
Margarita Momma offers frozen drink machine rentals with complete delivery, setup, and pickup. We will be the first business of its kind in the area.
Product quality will include a large variety of tropical- and regular-flavored syrups. Margarita Momma has pledged to use only the healthiest, freshest ingredients for our frozen drinks. The brand Margarita Man margarita mix has been chosen because it has natural lemon and lime flavors and real lime juice. Extra natural flavoring can be used by adding Triple Sec Liqueur. Very few preservatives are added to enhance the freshness of our product. The result is a unique citrus-fruit-flavored margarita mix that can also be used as an excellent sweet ‘n sour. No other bar mix out there is fruitier. We will grow to include the full line of 11 flavors, mixed to the same standards of quality.
Current concentrate flavors available are:
- Strawberry Daiquiri
- Margarita
- Louisiana Hurricane
- Peach Bellini
- Bordermilk (Lemon Freeze)
- Razzmatazzberry
- Pina Colada
- Go Mango
- Go Banana
- Goombay Smash (Rum Punch)
- Tropical Punch
- Neutral Base
Market Analysis Summary
Although the name is Margarita Momma, we want to stress that this service is for everyone who plans a gathering. Every household, business, church, or event is a potential customer. From weddings to barbecues, from Lampasas to Harker Heights, the fun and convenience catches on like wildfire as everyone at the event enjoys a delicious frozen drink.
Some examples of excellent rental/concession opportunities are:
- Rabbit Fest
- 4th of July
- Hood Howdy
- Taste of Cove
- Weddings
- Club Fundraisers
- National Night Out
- Downtown Party
- St. Patrick’s Day
- New Years Eve
- Family Reunions
Currently, at these types of events, customers have a choice of purchasing soda or snow cones. And, while delicious in their own right, there is something missing from these two choices. We have an excellent alternative; Margarita Momma will provide a quality beverage, with real fruit flavoring and few preservatives. These drinks are far superior to the taste of a snowcone or a slurpee, and more nutritious than a soda.
4.1 Market Segmentation
Margarita Momma will target all segments of the population–children, teenagers, and adults–through rentals and concession stands at local events. This is truly a beverage people of all ages can enjoy. It is a fun, affordable alternative to the familiar party beverages that are available. Our market segmentation will focus more on areas of service than on potential customers. The only limitation would be how far the company is willing to travel and how much area can be covered through our advertising plans.

| Market Analysis | |||||||
| Year 1 | Year 2 | Year 3 | Year 4 | Year 5 | |||
| Potential Customers | Growth | CAGR | |||||
| Copperas Cove | 500% | 10 | 60 | 360 | 2,160 | 12,960 | 500.00% |
| Killeen | 600% | 20 | 140 | 980 | 6,860 | 48,020 | 600.00% |
| Ft. Hood | 700% | 15 | 120 | 960 | 7,680 | 61,440 | 700.00% |
| Total | 622.20% | 45 | 320 | 2,300 | 16,700 | 122,420 | 622.20% |
4.2 Market Analysis
Although this is a lucrative business, there are no competitors for Margarita Momma. This is due to the fact that there are no other companies in the targeted area which provide similar services. Margarita Momma has the advantage of being the first to market these services.

4.3 Target Market Segment Strategy
The margarita machine rental business has been EXPLODING in Texas for the last 15 years. Now this fun, profitable business is sweeping the country. In order for Margarita Momma to get a hold of this lucrative service, we must focus on a specific market segment whose needs match our offerings.
The target customer is anyone planning an event and wishing to provide an original beverage alternative for their guests. When the happy guests serve themselves, they think, “What a great idea, I’ll have Margarita Momma bring a machine to my next party.” Each guest is your next potential customer.
4.4 Market Needs
The party products market is popular, and demands quality services. Margarita Momma is able to provide this segment with the products and services it is seeking. The unique nature of a frozen drink machine service demands it be an indispensable part of any celebration or gathering.
The market for party products is growing throughout Texas–as well as the rest of the country. Margarita Momma has the advantage of being an originator in South Central Texas.
4.5 Service Business Analysis
As mentioned in the previous sections, there is no relevant competition for Margarita Momma at this time. This is a novel business in an exciting, expanding new industry; we are set up to reap the benefits of being pioneers within this area of Texas. That is not to say we would be unable to compete with a business offering the same services. We intend to entrench ourselves so fully in the segment, that our customers would never dream of using anyone else for their party needs. We will be the company that a new business will be wary of.
4.5.1 Business Participants
This topic was not included in the original business plan, but is included here as a placeholder for others using this plan as a guide. Please remember that the default outline is flexible on purpose, because every business plan is unique, so many excellent plans omit topics included in the standard outline and many add additional topics. The outline is a suggestion, not a checklist. You can add and delete topics easily. Make it your plan, not the software’s plan.
4.5.2 Competition and Buying Patterns
This topic was not included in the original business plan, but is included here as a placeholder for others using this plan as a guide. Please remember that the default outline is flexible on purpose, because every business plan is unique, so many excellent plans omit topics included in the standard outline and many add additional topics. The outline is a suggestion, not a checklist. You can add and delete topics easily. Make it your plan, not the software’s plan.
4.5.3 Distributing a Service
This topic was not included in the original business plan, but is included here as a placeholder for others using this plan as a guide. Please remember that the default outline is flexible on purpose, because every business plan is unique, so many excellent plans omit topics included in the standard outline and many add additional topics. The outline is a suggestion, not a checklist. You can add and delete topics easily. Make it your plan, not the software’s plan.
4.5.4 Main Competitors
This topic was not included in the original business plan, but is included here as a placeholder for others using this plan as a guide. Please remember that the default outline is flexible on purpose, because every business plan is unique, so many excellent plans omit topics included in the standard outline and many add additional topics. The outline is a suggestion, not a checklist. You can add and delete topics easily. Make it your plan, not the software’s plan.
Strategy and Implementation Summary
The beginning operation of Margarita Momma will be basic, with three machines, and three flavors of mix. It is imperative to the success of the company that smart financial decisions are made, and that the business does not expand too quickly; this could result in not having the funds necessary to operate. Flavors, machines, and an expanded service area will be added as they become necessary. This is a process we see as taking place over the first two years of operation. We plan to expand the flavor choice from the basic three to the full eleven that are available. Additional machines will be purchased in order to better serve an ever-expanding customer base. Within two years, we hope to be serving the Kempner, Lampasas, and Belton areas; this will expand our range to almost a fifty-mile service area.
5.1 Strategy Pyramid
This topic was not included in the original business plan, but is included here as a placeholder for others using this plan as a guide. Please remember that the default outline is flexible on purpose, because every business plan is unique, so many excellent plans omit topics included in the standard outline and many add additional topics. The outline is a suggestion, not a checklist. You can add and delete topics easily. Make it your plan, not the software’s plan.
5.2 Competitive Edge
We start with a critical edge–there is no direct competition at this point, closer than Austin, which is almost one hundred miles away. Available options for this area include: the snow cone trolley, purchasing the separate ingredients and using a blender to make frozen drinks, or canned drinks purchased at retail stores. Fundraising options would be provided by Pepsi and Coca-Cola distributors from the nearby Temple area. These options all pale when compared with the lively taste and nutritious quality of Margarita Momma’s frozen beverages.
Customers will be reached through advertisements such as business cards, flyers, newspaper ads, a website, and through word-of-mouth from satisfied customers. It is our goal to make each occasion the best it can be. By doing our utmost to ensure this, we expect positive feedback from our customers. It is our hope, then, that these satisfied customers will not be stingy with their praise for the company, and spread the word about us.
5.3 Sales Strategy
We will provide first-rate service during each aspect of rental: from time of booking, to setup, and all the way through to pickup. Each member of the Margarita Momma team will be adept at both sales and social skills. It is our goal to be the most friendly, knowledgeable business in the area. This will help Margarita Momma become number one in sales, and it will contribute to remaining number one.
5.3.1 Sales Forecast
The following table and chart give a run-down on forecasted sales. We expect sales to increase dramatically as name recognition and word-of-mouth advertising grows.


| Sales Forecast | |||
| Year 1 | Year 2 | Year 3 | |
| Unit Sales | |||
| Machine Rental | 572 | 650 | 750 |
| Extra Mix | 245 | 300 | 350 |
| Other | 0 | 0 | 0 |
| Total Unit Sales | 817 | 950 | 1,100 |
| Unit Prices | Year 1 | Year 2 | Year 3 |
| Machine Rental | $100.00 | $100.00 | $100.00 |
| Extra Mix | $15.00 | $15.00 | $15.00 |
| Other | $0.00 | $0.00 | $0.00 |
| Sales | |||
| Machine Rental | $57,200 | $65,000 | $75,000 |
| Extra Mix | $3,675 | $4,500 | $5,250 |
| Other | $0 | $0 | $0 |
| Total Sales | $60,875 | $69,500 | $80,250 |
| Direct Unit Costs | Year 1 | Year 2 | Year 3 |
| Machine Rental | $7.60 | $7.60 | $7.60 |
| Extra Mix | $4.80 | $4.80 | $4.80 |
| Other | $0.00 | $0.00 | $0.00 |
| Direct Cost of Sales | |||
| Machine Rental | $4,347 | $4,940 | $5,700 |
| Extra Mix | $1,176 | $1,440 | $1,680 |
| Other | $0 | $0 | $0 |
| Subtotal Direct Cost of Sales | $5,523 | $6,380 | $7,380 |
5.3.2 Sales Programs
This topic was not included in the original business plan, but is included here as a placeholder for others using this plan as a guide. Please remember that the default outline is flexible on purpose, because every business plan is unique, so many excellent plans omit topics included in the standard outline and many add additional topics. The outline is a suggestion, not a checklist. You can add and delete topics easily. Make it your plan, not the software’s plan.
5.4 Value Proposition
This topic was not included in the original business plan, but is included here as a placeholder for others using this plan as a guide. Please remember that the default outline is flexible on purpose, because every business plan is unique, so many excellent plans omit topics included in the standard outline and many add additional topics. The outline is a suggestion, not a checklist. You can add and delete topics easily. Make it your plan, not the software’s plan.
5.5 Milestones
The accompanying table lists important program milestones, with dates and persons in charge, and budgets for each. The milestone schedule indicates our emphasis on planning for implementation.

| Milestones | |||||
| Milestone | Start Date | End Date | Budget | Manager | Department |
| Business plan | 10/1/2000 | 10/31/2000 | $90 | Greta Guidry | Owner |
| Logo design | 10/1/2000 | 1/1/2001 | $0 | Kelley Guidry | Department |
| Business cards | 10/15/2000 | 11/1/2000 | $40 | Rachel Guidry | Department |
| Flyers | 10/12/2000 | 11/1/2000 | $20 | Kelley Guidry | Department |
| Magnetic sign for vehicle | 10/15/2000 | 11/1/2000 | $30 | Greta Guidry | Owner |
| Website | 11/15/2000 | 3/30/2001 | $100 | Greta Guidry | Owner |
| New phone number | 10/25/2000 | 11/1/2000 | $100 | Greta Guidry | Owner |
| Totals | $380 | ||||
5.6 Marketing Strategy
This topic was not included in the original business plan, but is included here as a placeholder for others using this plan as a guide. Please remember that the default outline is flexible on purpose, because every business plan is unique, so many excellent plans omit topics included in the standard outline and many add additional topics. The outline is a suggestion, not a checklist. You can add and delete topics easily. Make it your plan, not the software’s plan.
5.6.1 Marketing Programs
This topic was not included in the original business plan, but is included here as a placeholder for others using this plan as a guide. Please remember that the default outline is flexible on purpose, because every business plan is unique, so many excellent plans omit topics included in the standard outline and many add additional topics. The outline is a suggestion, not a checklist. You can add and delete topics easily. Make it your plan, not the software’s plan.
5.6.2 Positioning Statement
This topic was not included in the original business plan, but is included here as a placeholder for others using this plan as a guide. Please remember that the default outline is flexible on purpose, because every business plan is unique, so many excellent plans omit topics included in the standard outline and many add additional topics. The outline is a suggestion, not a checklist. You can add and delete topics easily. Make it your plan, not the software’s plan.
5.6.3 Pricing Strategy
This topic was not included in the original business plan, but is included here as a placeholder for others using this plan as a guide. Please remember that the default outline is flexible on purpose, because every business plan is unique, so many excellent plans omit topics included in the standard outline and many add additional topics. The outline is a suggestion, not a checklist. You can add and delete topics easily. Make it your plan, not the software’s plan.
5.6.4 Promotion Strategy
This topic was not included in the original business plan, but is included here as a placeholder for others using this plan as a guide. Please remember that the default outline is flexible on purpose, because every business plan is unique, so many excellent plans omit topics included in the standard outline and many add additional topics. The outline is a suggestion, not a checklist. You can add and delete topics easily. Make it your plan, not the software’s plan.
5.6.5 Distribution Strategy
This topic was not included in the original business plan, but is included here as a placeholder for others using this plan as a guide. Please remember that the default outline is flexible on purpose, because every business plan is unique, so many excellent plans omit topics included in the standard outline and many add additional topics. The outline is a suggestion, not a checklist. You can add and delete topics easily. Make it your plan, not the software’s plan.
Management Summary
Margarita Momma will be a family-based business. Greta Guidry has worked for the Army Air Force Exchange (AAFES) over the past 18 years in several different positions, from cashier to manager. Through these positions, Greta has gained great knowledge of the service industry, of being an efficient manager, and a feel for stocking and maintaining inventory.
The other members of her team (and family) are experienced sales professionals, and have intimate knowledge of the frozen drink machines being utilized. All family members are committed to the success of Margarita Momma, and have been trained in customer service and sales in order to make this goal a reality.
6.1 Personnel Plan
Greta Guidry, the owner, will conduct daily operations of the business. Steven, Kelley, and Michael Guidry will assist with deliveries and pickups. Because this is a family business, each member of the family has been given responsibilities, and is more than capable of assisting in all parts of the rental process.
| Personnel Plan | |||
| Year 1 | Year 2 | Year 3 | |
| Payroll | $11,050 | $11,800 | $12,500 |
| Other | $0 | $0 | $0 |
| Total People | 0 | 0 | 0 |
| Total Payroll | $11,050 | $11,800 | $12,500 |
6.2 Organizational Structure
This topic was not included in the original business plan, but is included here as a placeholder for others using this plan as a guide. Please remember that the default outline is flexible on purpose, because every business plan is unique, so many excellent plans omit topics included in the standard outline and many add additional topics. The outline is a suggestion, not a checklist. You can add and delete topics easily. Make it your plan, not the software’s plan.
6.3 Management Team
This topic was not included in the original business plan, but is included here as a placeholder for others using this plan as a guide. Please remember that the default outline is flexible on purpose, because every business plan is unique, so many excellent plans omit topics included in the standard outline and many add additional topics. The outline is a suggestion, not a checklist. You can add and delete topics easily. Make it your plan, not the software’s plan.
6.4 Management Team Gaps
This topic was not included in the original business plan, but is included here as a placeholder for others using this plan as a guide. Please remember that the default outline is flexible on purpose, because every business plan is unique, so many excellent plans omit topics included in the standard outline and many add additional topics. The outline is a suggestion, not a checklist. You can add and delete topics easily. Make it your plan, not the software’s plan.
Financial Plan
We want to finance growth mainly through cash flow. We recognize that this means we will have to grow slowly, adding machines one at a time, not in bulk. The most important indicator in our case is that minimal inventory will have to be stored for these rentals; this translates into very low overhead.
There are some seasonal variations, with the months of March through September being the hottest months in Texas. This will, as expected, mean a high rate of rentals for events such as pool parties, Fourth of July celebrations, and barbecues. However, we expect the winter months to be just as lucrative due to the number of holiday parties, football gatherings, and fundraising events. We expect a light seasonal variation, with sales increasing slightly during the cooler months. For the most part, Margarita Momma will experience a high rate of sales, regardless of weather variations.
7.1 Important Assumptions
The financial assumptions for Margarita Momma are included in the following table.
| General Assumptions | |||
| Year 1 | Year 2 | Year 3 | |
| Plan Month | 1 | 2 | 3 |
| Current Interest Rate | 10.00% | 10.00% | 10.00% |
| Long-term Interest Rate | 10.00% | 10.00% | 10.00% |
| Tax Rate | 25.42% | 25.00% | 25.42% |
| Other | 0 | 0 | 0 |
7.2 Key Financial Indicators
This topic was not included in the original business plan, but is included here as a placeholder for others using this plan as a guide. Please remember that the default outline is flexible on purpose, because every business plan is unique, so many excellent plans omit topics included in the standard outline and many add additional topics. The outline is a suggestion, not a checklist. You can add and delete topics easily. Make it your plan, not the software’s plan.

7.3 Break-even Analysis
The following table and chart summarize our break-even analysis. With estimated fixed costs as shown in the following table, we need to have 16 rentals by the end of the year to cover our costs.

| Break-even Analysis | |
| Monthly Units Break-even | 14 |
| Monthly Revenue Break-even | $1,052 |
| Assumptions: | |
| Average Per-Unit Revenue | $74.51 |
| Average Per-Unit Variable Cost | $6.76 |
| Estimated Monthly Fixed Cost | $957 |
7.4 Projected Profit and Loss
We expect net profits, and gross margins for FY 2001 through FY2003 as shown in the following table.


| Pro Forma Profit and Loss | |||
| Year 1 | Year 2 | Year 3 | |
| Sales | $60,875 | $69,500 | $80,250 |
| Direct Cost of Sales | $5,523 | $6,380 | $7,380 |
| Other | $0 | $0 | $0 |
| Total Cost of Sales | $5,523 | $6,380 | $7,380 |
| Gross Margin | $55,352 | $63,120 | $72,870 |
| Gross Margin % | 90.93% | 90.82% | 90.80% |
| Expenses | |||
| Payroll | $11,050 | $11,800 | $12,500 |
| Sales and Marketing and Other Expenses | $280 | $300 | $250 |
| Depreciation | $150 | $150 | $150 |
| Leased Equipment | $0 | $0 | $0 |
| Utilities | $0 | $0 | $0 |
| Insurance | $0 | $0 | $0 |
| Rent | $0 | $0 | $0 |
| Payroll Taxes | $0 | $0 | $0 |
| Other | $0 | $0 | $0 |
| Total Operating Expenses | $11,480 | $12,250 | $12,900 |
| Profit Before Interest and Taxes | $43,872 | $50,870 | $59,970 |
| EBITDA | $44,022 | $51,020 | $60,120 |
| Interest Expense | $1,031 | $916 | $796 |
| Taxes Incurred | $10,803 | $12,489 | $15,040 |
| Net Profit | $32,038 | $37,466 | $44,134 |
| Net Profit/Sales | 52.63% | 53.91% | 55.00% |
7.5 Projected Cash Flow
The following cash flow projections show the annual amounts only. For a monthly breakdown, please see the appendix at the end of the business plan.

| Pro Forma Cash Flow | |||
| Year 1 | Year 2 | Year 3 | |
| Cash Received | |||
| Cash from Operations | |||
| Cash Sales | $60,875 | $69,500 | $80,250 |
| Subtotal Cash from Operations | $60,875 | $69,500 | $80,250 |
| Additional Cash Received | |||
| Sales Tax, VAT, HST/GST Received | $0 | $0 | $0 |
| New Current Borrowing | $0 | $0 | $0 |
| New Other Liabilities (interest-free) | $0 | $0 | $0 |
| New Long-term Liabilities | $0 | $0 | $0 |
| Sales of Other Current Assets | $0 | $0 | $0 |
| Sales of Long-term Assets | $0 | $0 | $0 |
| New Investment Received | $0 | $0 | $0 |
| Subtotal Cash Received | $60,875 | $69,500 | $80,250 |
| Expenditures | Year 1 | Year 2 | Year 3 |
| Expenditures from Operations | |||
| Cash Spending | $11,050 | $11,800 | $12,500 |
| Bill Payments | $16,121 | $20,595 | $23,399 |
| Subtotal Spent on Operations | $27,171 | $32,395 | $35,899 |
| Additional Cash Spent | |||
| Sales Tax, VAT, HST/GST Paid Out | $0 | $0 | $0 |
| Principal Repayment of Current Borrowing | $0 | $0 | $0 |
| Other Liabilities Principal Repayment | $0 | $0 | $0 |
| Long-term Liabilities Principal Repayment | $1,200 | $1,200 | $1,200 |
| Purchase Other Current Assets | $0 | $0 | $0 |
| Purchase Long-term Assets | $0 | $0 | $0 |
| Dividends | $0 | $0 | $0 |
| Subtotal Cash Spent | $28,371 | $33,595 | $37,099 |
| Net Cash Flow | $32,504 | $35,905 | $43,151 |
| Cash Balance | $33,343 | $69,249 | $112,400 |
7.6 Projected Balance Sheet
The following table represents our financial position at the end of each of the three upcoming fiscal years.
| Pro Forma Balance Sheet | |||
| Year 1 | Year 2 | Year 3 | |
| Assets | |||
| Current Assets | |||
| Cash | $33,343 | $69,249 | $112,400 |
| Inventory | $1,177 | $1,359 | $1,572 |
| Other Current Assets | $1,260 | $1,260 | $1,260 |
| Total Current Assets | $35,780 | $71,868 | $115,233 |
| Long-term Assets | |||
| Long-term Assets | $9,000 | $9,000 | $9,000 |
| Accumulated Depreciation | $150 | $300 | $450 |
| Total Long-term Assets | $8,851 | $8,701 | $8,551 |
| Total Assets | $44,631 | $80,569 | $123,783 |
| Liabilities and Capital | Year 1 | Year 2 | Year 3 |
| Current Liabilities | |||
| Accounts Payable | $1,993 | $1,666 | $1,946 |
| Current Borrowing | $0 | $0 | $0 |
| Other Current Liabilities | $0 | $0 | $0 |
| Subtotal Current Liabilities | $1,993 | $1,666 | $1,946 |
| Long-term Liabilities | $9,760 | $8,560 | $7,360 |
| Total Liabilities | $11,753 | $10,226 | $9,306 |
| Paid-in Capital | $1,000 | $1,000 | $1,000 |
| Retained Earnings | ($161) | $31,877 | $69,343 |
| Earnings | $32,038 | $37,466 | $44,134 |
| Total Capital | $32,877 | $70,343 | $114,477 |
| Total Liabilities and Capital | $44,631 | $80,569 | $123,783 |
| Net Worth | $32,877 | $70,343 | $114,477 |
7.7 Business Ratios
The following table shows standard ratios and industry comparison for SIC code 7359, rental businesses.
| Ratio Analysis | ||||
| Year 1 | Year 2 | Year 3 | Industry Profile | |
| Sales Growth | 0.00% | 14.17% | 15.47% | 7.90% |
| Percent of Total Assets | ||||
| Inventory | 2.64% | 1.69% | 1.27% | 3.40% |
| Other Current Assets | 2.82% | 1.56% | 1.02% | 45.10% |
| Total Current Assets | 80.17% | 89.20% | 93.09% | 74.30% |
| Long-term Assets | 19.83% | 10.80% | 6.91% | 25.70% |
| Total Assets | 100.00% | 100.00% | 100.00% | 100.00% |
| Current Liabilities | 4.47% | 2.07% | 1.57% | 42.00% |
| Long-term Liabilities | 21.87% | 10.62% | 5.95% | 15.70% |
| Total Liabilities | 26.33% | 12.69% | 7.52% | 57.70% |
| Net Worth | 73.67% | 87.31% | 92.48% | 42.30% |
| Percent of Sales | ||||
| Sales | 100.00% | 100.00% | 100.00% | 100.00% |
| Gross Margin | 90.93% | 90.82% | 90.80% | 0.00% |
| Selling, General & Administrative Expenses | 38.15% | 36.91% | 35.50% | 82.90% |
| Advertising Expenses | 0.46% | 0.43% | 0.31% | 1.00% |
| Profit Before Interest and Taxes | 72.07% | 73.19% | 74.73% | 2.60% |
| Main Ratios | ||||
| Current | 17.95 | 43.14 | 59.21 | 1.68 |
| Quick | 17.36 | 42.33 | 58.40 | 1.33 |
| Total Debt to Total Assets | 26.33% | 12.69% | 7.52% | 57.70% |
| Pre-tax Return on Net Worth | 130.31% | 71.01% | 51.69% | 4.80% |
| Pre-tax Return on Assets | 95.99% | 62.00% | 47.80% | 11.40% |
| Additional Ratios | Year 1 | Year 2 | Year 3 | |
| Net Profit Margin | 52.63% | 53.91% | 55.00% | n.a |
| Return on Equity | 97.45% | 53.26% | 38.55% | n.a |
| Activity Ratios | ||||
| Inventory Turnover | 5.89 | 5.03 | 5.03 | n.a |
| Accounts Payable Turnover | 9.09 | 12.17 | 12.17 | n.a |
| Payment Days | 27 | 33 | 28 | n.a |
| Total Asset Turnover | 1.36 | 0.86 | 0.65 | n.a |
| Debt Ratios | ||||
| Debt to Net Worth | 0.36 | 0.15 | 0.08 | n.a |
| Current Liab. to Liab. | 0.17 | 0.16 | 0.21 | n.a |
| Liquidity Ratios | ||||
| Net Working Capital | $33,787 | $70,202 | $113,286 | n.a |
| Interest Coverage | 42.55 | 55.53 | 75.34 | n.a |
| Additional Ratios | ||||
| Assets to Sales | 0.73 | 1.16 | 1.54 | n.a |
| Current Debt/Total Assets | 4% | 2% | 2% | n.a |
| Acid Test | 17.36 | 42.33 | 58.40 | n.a |
| Sales/Net Worth | 1.85 | 0.99 | 0.70 | n.a |
| Dividend Payout | 0.00 | 0.00 | 0.00 | n.a |
Appendix
| Sales Forecast | |||||||||||||
| Month 1 | Month 2 | Month 3 | Month 4 | Month 5 | Month 6 | Month 7 | Month 8 | Month 9 | Month 10 | Month 11 | Month 12 | ||
| Unit Sales | |||||||||||||
| Machine Rental | 0% | 30 | 48 | 36 | 36 | 55 | 48 | 48 | 57 | 57 | 57 | 50 | 50 |
| Extra Mix | 0% | 10 | 20 | 10 | 15 | 25 | 20 | 20 | 25 | 25 | 25 | 25 | 25 |
| Other | 0% | 0 | 0 | 0 | 0 | 0 | 0 | 0 | 0 | 0 | 0 | 0 | 0 |
| Total Unit Sales | 40 | 68 | 46 | 51 | 80 | 68 | 68 | 82 | 82 | 82 | 75 | 75 | |
| Unit Prices | Month 1 | Month 2 | Month 3 | Month 4 | Month 5 | Month 6 | Month 7 | Month 8 | Month 9 | Month 10 | Month 11 | Month 12 | |
| Machine Rental | $100.00 | $100.00 | $100.00 | $100.00 | $100.00 | $100.00 | $100.00 | $100.00 | $100.00 | $100.00 | $100.00 | $100.00 | |
| Extra Mix | $15.00 | $15.00 | $15.00 | $15.00 | $15.00 | $15.00 | $15.00 | $15.00 | $15.00 | $15.00 | $15.00 | $15.00 | |
| Other | $0.00 | $0.00 | $0.00 | $0.00 | $0.00 | $0.00 | $0.00 | $0.00 | $0.00 | $0.00 | $0.00 | $0.00 | |
| Sales | |||||||||||||
| Machine Rental | $3,000 | $4,800 | $3,600 | $3,600 | $5,500 | $4,800 | $4,800 | $5,700 | $5,700 | $5,700 | $5,000 | $5,000 | |
| Extra Mix | $150 | $300 | $150 | $225 | $375 | $300 | $300 | $375 | $375 | $375 | $375 | $375 | |
| Other | $0 | $0 | $0 | $0 | $0 | $0 | $0 | $0 | $0 | $0 | $0 | $0 | |
| Total Sales | $3,150 | $5,100 | $3,750 | $3,825 | $5,875 | $5,100 | $5,100 | $6,075 | $6,075 | $6,075 | $5,375 | $5,375 | |
| Direct Unit Costs | Month 1 | Month 2 | Month 3 | Month 4 | Month 5 | Month 6 | Month 7 | Month 8 | Month 9 | Month 10 | Month 11 | Month 12 | |
| Machine Rental | 0.00% | $7.60 | $7.60 | $7.60 | $7.60 | $7.60 | $7.60 | $7.60 | $7.60 | $7.60 | $7.60 | $7.60 | $7.60 |
| Extra Mix | 0.00% | $4.80 | $4.80 | $4.80 | $4.80 | $4.80 | $4.80 | $4.80 | $4.80 | $4.80 | $4.80 | $4.80 | $4.80 |
| Other | 0.00% | $0.00 | $0.00 | $0.00 | $0.00 | $0.00 | $0.00 | $0.00 | $0.00 | $0.00 | $0.00 | $0.00 | $0.00 |
| Direct Cost of Sales | |||||||||||||
| Machine Rental | $228 | $365 | $274 | $274 | $418 | $365 | $365 | $433 | $433 | $433 | $380 | $380 | |
| Extra Mix | $48 | $96 | $48 | $72 | $120 | $96 | $96 | $120 | $120 | $120 | $120 | $120 | |
| Other | $0 | $0 | $0 | $0 | $0 | $0 | $0 | $0 | $0 | $0 | $0 | $0 | |
| Subtotal Direct Cost of Sales | $276 | $461 | $322 | $346 | $538 | $461 | $461 | $553 | $553 | $553 | $500 | $500 | |
| Personnel Plan | |||||||||||||
| Month 1 | Month 2 | Month 3 | Month 4 | Month 5 | Month 6 | Month 7 | Month 8 | Month 9 | Month 10 | Month 11 | Month 12 | ||
| Payroll | 0% | $900 | $900 | $900 | $900 | $900 | $900 | $900 | $950 | $950 | $950 | $950 | $950 |
| Other | 0% | $0 | $0 | $0 | $0 | $0 | $0 | $0 | $0 | $0 | $0 | $0 | $0 |
| Total People | 0 | 0 | 0 | 0 | 0 | 0 | 0 | 0 | 0 | 0 | 0 | 0 | |
| Total Payroll | $900 | $900 | $900 | $900 | $900 | $900 | $900 | $950 | $950 | $950 | $950 | $950 | |
| General Assumptions | |||||||||||||
| Month 1 | Month 2 | Month 3 | Month 4 | Month 5 | Month 6 | Month 7 | Month 8 | Month 9 | Month 10 | Month 11 | Month 12 | ||
| Plan Month | 1 | 2 | 3 | 4 | 5 | 6 | 7 | 8 | 9 | 10 | 11 | 12 | |
| Current Interest Rate | 10.00% | 10.00% | 10.00% | 10.00% | 10.00% | 10.00% | 10.00% | 10.00% | 10.00% | 10.00% | 10.00% | 10.00% | |
| Long-term Interest Rate | 10.00% | 10.00% | 10.00% | 10.00% | 10.00% | 10.00% | 10.00% | 10.00% | 10.00% | 10.00% | 10.00% | 10.00% | |
| Tax Rate | 30.00% | 25.00% | 25.00% | 25.00% | 25.00% | 25.00% | 25.00% | 25.00% | 25.00% | 25.00% | 25.00% | 25.00% | |
| Other | 0 | 0 | 0 | 0 | 0 | 0 | 0 | 0 | 0 | 0 | 0 | 0 | |
| Pro Forma Profit and Loss | |||||||||||||
| Month 1 | Month 2 | Month 3 | Month 4 | Month 5 | Month 6 | Month 7 | Month 8 | Month 9 | Month 10 | Month 11 | Month 12 | ||
| Sales | $3,150 | $5,100 | $3,750 | $3,825 | $5,875 | $5,100 | $5,100 | $6,075 | $6,075 | $6,075 | $5,375 | $5,375 | |
| Direct Cost of Sales | $276 | $461 | $322 | $346 | $538 | $461 | $461 | $553 | $553 | $553 | $500 | $500 | |
| Other | $0 | $0 | $0 | $0 | $0 | $0 | $0 | $0 | $0 | $0 | $0 | $0 | |
| Total Cost of Sales | $276 | $461 | $322 | $346 | $538 | $461 | $461 | $553 | $553 | $553 | $500 | $500 | |
| Gross Margin | $2,874 | $4,639 | $3,428 | $3,479 | $5,337 | $4,639 | $4,639 | $5,522 | $5,522 | $5,522 | $4,875 | $4,875 | |
| Gross Margin % | 91.24% | 90.96% | 91.42% | 90.96% | 90.84% | 90.96% | 90.96% | 90.89% | 90.89% | 90.89% | 90.70% | 90.70% | |
| Expenses | |||||||||||||
| Payroll | $900 | $900 | $900 | $900 | $900 | $900 | $900 | $950 | $950 | $950 | $950 | $950 | |
| Sales and Marketing and Other Expenses | $20 | $30 | $30 | $20 | $20 | $20 | $30 | $20 | $20 | $20 | $20 | $30 | |
| Depreciation | $13 | $13 | $13 | $13 | $13 | $13 | $13 | $13 | $13 | $13 | $10 | $11 | |
| Leased Equipment | $0 | $0 | $0 | $0 | $0 | $0 | $0 | $0 | $0 | $0 | $0 | $0 | |
| Utilities | $0 | $0 | $0 | $0 | $0 | $0 | $0 | $0 | $0 | $0 | $0 | $0 | |
| Insurance | $0 | $0 | $0 | $0 | $0 | $0 | $0 | $0 | $0 | $0 | $0 | $0 | |
| Rent | $0 | $0 | $0 | $0 | $0 | $0 | $0 | $0 | $0 | $0 | $0 | $0 | |
| Payroll Taxes | 15% | $0 | $0 | $0 | $0 | $0 | $0 | $0 | $0 | $0 | $0 | $0 | $0 |
| Other | $0 | $0 | $0 | $0 | $0 | $0 | $0 | $0 | $0 | $0 | $0 | $0 | |
| Total Operating Expenses | $933 | $943 | $943 | $933 | $933 | $933 | $943 | $983 | $983 | $983 | $980 | $991 | |
| Profit Before Interest and Taxes | $1,942 | $3,697 | $2,486 | $2,546 | $4,404 | $3,706 | $3,696 | $4,539 | $4,539 | $4,539 | $3,895 | $3,884 | |
| EBITDA | $1,954 | $3,709 | $2,498 | $2,559 | $4,417 | $3,719 | $3,709 | $4,552 | $4,552 | $4,552 | $3,905 | $3,895 | |
| Interest Expense | $91 | $90 | $89 | $88 | $87 | $86 | $86 | $85 | $84 | $83 | $82 | $81 | |
| Taxes Incurred | $555 | $902 | $599 | $615 | $1,079 | $905 | $903 | $1,114 | $1,114 | $1,114 | $953 | $951 | |
| Net Profit | $1,296 | $2,705 | $1,798 | $1,844 | $3,238 | $2,715 | $2,708 | $3,341 | $3,341 | $3,342 | $2,860 | $2,852 | |
| Net Profit/Sales | 41.13% | 53.04% | 47.94% | 48.20% | 55.11% | 53.23% | 53.10% | 54.99% | 55.00% | 55.01% | 53.20% | 53.06% | |
| Pro Forma Cash Flow | |||||||||||||
| Month 1 | Month 2 | Month 3 | Month 4 | Month 5 | Month 6 | Month 7 | Month 8 | Month 9 | Month 10 | Month 11 | Month 12 | ||
| Cash Received | |||||||||||||
| Cash from Operations | |||||||||||||
| Cash Sales | $3,150 | $5,100 | $3,750 | $3,825 | $5,875 | $5,100 | $5,100 | $6,075 | $6,075 | $6,075 | $5,375 | $5,375 | |
| Subtotal Cash from Operations | $3,150 | $5,100 | $3,750 | $3,825 | $5,875 | $5,100 | $5,100 | $6,075 | $6,075 | $6,075 | $5,375 | $5,375 | |
| Additional Cash Received | |||||||||||||
| Sales Tax, VAT, HST/GST Received | 0.00% | $0 | $0 | $0 | $0 | $0 | $0 | $0 | $0 | $0 | $0 | $0 | $0 |
| New Current Borrowing | $0 | $0 | $0 | $0 | $0 | $0 | $0 | $0 | $0 | $0 | $0 | $0 | |
| New Other Liabilities (interest-free) | $0 | $0 | $0 | $0 | $0 | $0 | $0 | $0 | $0 | $0 | $0 | $0 | |
| New Long-term Liabilities | $0 | $0 | $0 | $0 | $0 | $0 | $0 | $0 | $0 | $0 | $0 | $0 | |
| Sales of Other Current Assets | $0 | $0 | $0 | $0 | $0 | $0 | $0 | $0 | $0 | $0 | $0 | $0 | |
| Sales of Long-term Assets | $0 | $0 | $0 | $0 | $0 | $0 | $0 | $0 | $0 | $0 | $0 | $0 | |
| New Investment Received | $0 | $0 | $0 | $0 | $0 | $0 | $0 | $0 | $0 | $0 | $0 | $0 | |
| Subtotal Cash Received | $3,150 | $5,100 | $3,750 | $3,825 | $5,875 | $5,100 | $5,100 | $6,075 | $6,075 | $6,075 | $5,375 | $5,375 | |
| Expenditures | Month 1 | Month 2 | Month 3 | Month 4 | Month 5 | Month 6 | Month 7 | Month 8 | Month 9 | Month 10 | Month 11 | Month 12 | |
| Expenditures from Operations | |||||||||||||
| Cash Spending | $900 | $900 | $900 | $900 | $900 | $900 | $900 | $950 | $950 | $950 | $950 | $950 | |
| Bill Payments | $22 | $711 | $1,978 | $752 | $1,705 | $1,214 | $1,978 | $1,058 | $2,185 | $1,251 | $2,178 | $1,089 | |
| Subtotal Spent on Operations | $922 | $1,611 | $2,878 | $1,652 | $2,605 | $2,114 | $2,878 | $2,008 | $3,135 | $2,201 | $3,128 | $2,039 | |
| Additional Cash Spent | |||||||||||||
| Sales Tax, VAT, HST/GST Paid Out | $0 | $0 | $0 | $0 | $0 | $0 | $0 | $0 | $0 | $0 | $0 | $0 | |
| Principal Repayment of Current Borrowing | $0 | $0 | $0 | $0 | $0 | $0 | $0 | $0 | $0 | $0 | $0 | $0 | |
| Other Liabilities Principal Repayment | $0 | $0 | $0 | $0 | $0 | $0 | $0 | $0 | $0 | $0 | $0 | $0 | |
| Long-term Liabilities Principal Repayment | $100 | $100 | $100 | $100 | $100 | $100 | $100 | $100 | $100 | $100 | $100 | $100 | |
| Purchase Other Current Assets | $0 | $0 | $0 | $0 | $0 | $0 | $0 | $0 | $0 | $0 | $0 | $0 | |
| Purchase Long-term Assets | $0 | $0 | $0 | $0 | $0 | $0 | $0 | $0 | $0 | $0 | $0 | $0 | |
| Dividends | $0 | $0 | $0 | $0 | $0 | $0 | $0 | $0 | $0 | $0 | $0 | $0 | |
| Subtotal Cash Spent | $1,022 | $1,711 | $2,978 | $1,752 | $2,705 | $2,214 | $2,978 | $2,108 | $3,235 | $2,301 | $3,228 | $2,139 | |
| Net Cash Flow | $2,128 | $3,389 | $772 | $2,073 | $3,170 | $2,886 | $2,122 | $3,967 | $2,840 | $3,774 | $2,147 | $3,236 | |
| Cash Balance | $2,967 | $6,356 | $7,128 | $9,201 | $12,372 | $15,258 | $17,379 | $21,346 | $24,186 | $27,961 | $30,107 | $33,343 | |
| Pro Forma Balance Sheet | |||||||||||||
| Month 1 | Month 2 | Month 3 | Month 4 | Month 5 | Month 6 | Month 7 | Month 8 | Month 9 | Month 10 | Month 11 | Month 12 | ||
| Assets | Starting Balances | ||||||||||||
| Current Assets | |||||||||||||
| Cash | $839 | $2,967 | $6,356 | $7,128 | $9,201 | $12,372 | $15,258 | $17,379 | $21,346 | $24,186 | $27,961 | $30,107 | $33,343 |
| Inventory | $700 | $424 | $963 | $642 | $1,296 | $758 | $1,297 | $836 | $1,283 | $730 | $1,177 | $677 | $1,177 |
| Other Current Assets | $1,260 | $1,260 | $1,260 | $1,260 | $1,260 | $1,260 | $1,260 | $1,260 | $1,260 | $1,260 | $1,260 | $1,260 | $1,260 |
| Total Current Assets | $2,799 | $4,651 | $8,579 | $9,029 | $11,757 | $14,390 | $17,815 | $19,476 | $23,889 | $26,176 | $30,397 | $32,044 | $35,780 |
| Long-term Assets | |||||||||||||
| Long-term Assets | $9,000 | $9,000 | $9,000 | $9,000 | $9,000 | $9,000 | $9,000 | $9,000 | $9,000 | $9,000 | $9,000 | $9,000 | $9,000 |
| Accumulated Depreciation | $0 | $13 | $25 | $38 | $51 | $64 | $77 | $90 | $103 | $116 | $129 | $139 | $150 |
| Total Long-term Assets | $9,000 | $8,988 | $8,975 | $8,963 | $8,950 | $8,937 | $8,924 | $8,911 | $8,898 | $8,885 | $8,872 | $8,862 | $8,851 |
| Total Assets | $11,799 | $13,638 | $17,554 | $17,992 | $20,707 | $23,326 | $26,738 | $28,386 | $32,787 | $35,061 | $39,269 | $40,906 | $44,631 |
| Liabilities and Capital | Month 1 | Month 2 | Month 3 | Month 4 | Month 5 | Month 6 | Month 7 | Month 8 | Month 9 | Month 10 | Month 11 | Month 12 | |
| Current Liabilities | |||||||||||||
| Accounts Payable | $0 | $644 | $1,954 | $694 | $1,665 | $1,147 | $1,944 | $984 | $2,144 | $1,177 | $2,143 | $1,020 | $1,993 |
| Current Borrowing | $0 | $0 | $0 | $0 | $0 | $0 | $0 | $0 | $0 | $0 | $0 | $0 | $0 |
| Other Current Liabilities | $0 | $0 | $0 | $0 | $0 | $0 | $0 | $0 | $0 | $0 | $0 | $0 | $0 |
| Subtotal Current Liabilities | $0 | $644 | $1,954 | $694 | $1,665 | $1,147 | $1,944 | $984 | $2,144 | $1,177 | $2,143 | $1,020 | $1,993 |
| Long-term Liabilities | $10,960 | $10,860 | $10,760 | $10,660 | $10,560 | $10,460 | $10,360 | $10,260 | $10,160 | $10,060 | $9,960 | $9,860 | $9,760 |
| Total Liabilities | $10,960 | $11,504 | $12,714 | $11,354 | $12,225 | $11,607 | $12,304 | $11,244 | $12,304 | $11,237 | $12,103 | $10,880 | $11,753 |
| Paid-in Capital | $1,000 | $1,000 | $1,000 | $1,000 | $1,000 | $1,000 | $1,000 | $1,000 | $1,000 | $1,000 | $1,000 | $1,000 | $1,000 |
| Retained Earnings | ($161) | ($161) | ($161) | ($161) | ($161) | ($161) | ($161) | ($161) | ($161) | ($161) | ($161) | ($161) | ($161) |
| Earnings | $0 | $1,296 | $4,001 | $5,799 | $7,643 | $10,880 | $13,595 | $16,303 | $19,644 | $22,985 | $26,327 | $29,186 | $32,038 |
| Total Capital | $839 | $2,135 | $4,840 | $6,638 | $8,482 | $11,719 | $14,434 | $17,142 | $20,483 | $23,824 | $27,166 | $30,025 | $32,877 |
| Total Liabilities and Capital | $11,799 | $13,638 | $17,554 | $17,992 | $20,707 | $23,326 | $26,738 | $28,386 | $32,787 | $35,061 | $39,269 | $40,906 | $44,631 |
| Net Worth | $839 | $2,135 | $4,840 | $6,638 | $8,482 | $11,719 | $14,434 | $17,142 | $20,483 | $23,824 | $27,166 | $30,025 | $32,877 |

