
Employee Benefits Administration
Executive Summary
Employee Benefits Administrators (EBA) will provide benefits administration outsourcing for small to medium sized companies. The office, located in Morgantown, Pennsylvania, has opened for business.
The trend today for many employers is to outsource any function within their business that is not directly related to the generation of income. Consequently the Human Resources Administration function is one of the first to be considered for it has no direct link to bringing revenue across the threshold.
Outsourcing is a proactive approach that can improve productivity as well as reduce costs. Employee Benefits Administrators’ goal is to provide high quality benefits administration and customer service, allowing its clients to focus on their core competencies and other strategic initiatives.
At the inception of the business, EBA will target clients with ten to five hundred employees. Clients will be able to select from four levels of service, which will be tailored to their needs:
- COBRA (Consolidated OmniBus Reconciliation Act) and HIPAA (Health Insurance Portability and Accountability Act) Administration
- Flexible Spending Account Administration
- Basic Benefits Administration for health and welfare plans, including a call center
- An “All-Inclusive” level combining the first three levels
EBA will market its services through business associates, insurance brokers, local businesses, and professional associations. EBA also has plans to become certified in the state of Pennsylvania as a “WBE”, Women’s Business Enterprise in order to do business on the Federal, State and Local government levels.
Employee Benefits Administrators has been established as an LLC (Limited Liability Company). Cindy Wells and Diane Davis are equal owners (principals) in the business. They have over 25 years of combined experience in corporate benefits administration, employee relations and communications, legal compliance, and a history of providing outstanding customer service. Their experience in dealing with all levels of management as well as employees, gives them an edge over their competitors.
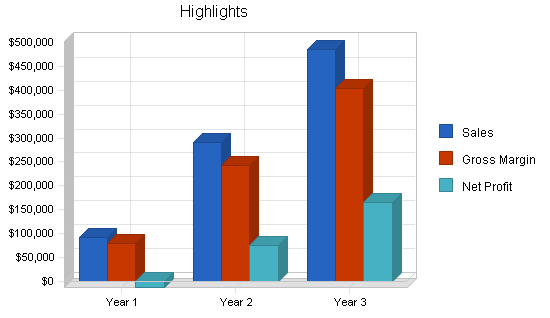
This business plan has been prepared to forecast all financial statements for three years, as well as to obtain initial funding. This will cover initial start-up costs as well as operating expenses for the first year. Employee Benefits Administrators projects substantial revenue by the end of year one, and phenomenal by the end of year two.
1.1 Objectives
Over the next three years, EBA hopes to achieve:
- Substantial first year revenue with phenomenal growth in the next year
- One new client/month for COBRA services, and one new client/quarter for basic and all inclusive services
- Staff of three by the beginning of Year 2, staff of seven by the end of Year 3
- By the end of Year 3, to evolve from providing strictly benefits administration to offering payroll services and/or any other HR services in which clients have expressed an interest in outsourcing
1.2 Mission
Employee Benefits Administrators provides high quality benefits administration and customer service for small to medium sized companies, allowing them to focus on their strategic initiatives.
1.3 Keys to Success
EBA’s keys to success are:
- Excellent communication and customer service skills — completely confidential, reliable, and trustworthy expertise and information
- One of the best Human Resources Information software modules on the market
- Thorough knowledge of benefits administration issues
Company Summary
EBA is a privately held Pennsylvania Limited Liability Company (LLC). Co-owners are Diane Davis and Cindy Wells. The office is located on Main Street, Morgantown, PA. This location was selected by the principals since it is a fast growing suburban area and is located within minutes from the Pennsylvania Turnpike, allowing quick access to surrounding growth areas.
2.1 Start-up Summary
The partners of EBA have spent almost a year planning this business venture. They have opened the office, and spent much time, energy, and their own funds in bringing the business this far.
The initial investment was used to purchase IBM laptop computers, software licensing fees for the Human Resources Information System, computer accessories and docking stations, small business education, seminars on current employee benefit trends, memberships in organizations, rent and security deposit of an office, and various other start-up costs.
Considering the forecasts predict an overall loss for the first year of business, EBA will follow avenues for obtaining a small business loan, preferably one guaranteed by the Small Business Association.
| Start-up | |
| Requirements | |
| Start-up Expenses | |
| Advertising – Brochure | $430 |
| Advertising – Business Cards | $120 |
| Bank – Cash | $160 |
| Computer Technician ( Consultant) | $250 |
| Dues and Subscriptions | $450 |
| Fax/Copier Combination | $65 |
| Furniture | $500 |
| Internet Access (DSL) | $150 |
| Insurance (Liability) | $1,000 |
| Laptop and Computer Accessories for LAN | $4,370 |
| Laptop Cindy | $750 |
| Legal Fees | $500 |
| Licensing (Software) | $2,000 |
| Office Expense | $150 |
| Phone System (Second Hand) | $85 |
| Phone Installation (Conestoga + Rapp) | $500 |
| Postage and Meter (Stamps, Meter, PO Box) | $125 |
| Printer | $550 |
| Professional Fees | $500 |
| Rent and Security Deposit | $1,800 |
| Seminars and OOP Expenses | $2,000 |
| SHRM – HR Comply – Legal Access | $475 |
| Telephone (Monthly) | $748 |
| Training (EBS) | $2,400 |
| Utilities | $200 |
| Web Hosting (Domain) | $150 |
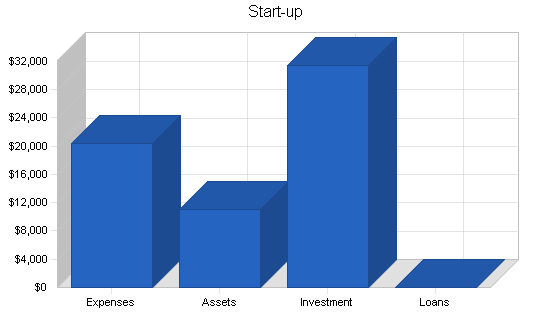
| Total Start-up Expenses | $20,428 |
| Start-up Assets | |
| Cash Required | $11,000 |
| Other Current Assets | $0 |
| Long-term Assets | $0 |
| Total Assets | $11,000 |
| Total Requirements | $31,428 |
| Start-up Funding | |
| Start-up Expenses to Fund | $20,428 |
| Start-up Assets to Fund | $11,000 |
| Total Funding Required | $31,428 |
| Assets | |
| Non-cash Assets from Start-up | $0 |
| Cash Requirements from Start-up | $11,000 |
| Additional Cash Raised | $0 |
| Cash Balance on Starting Date | $11,000 |
| Total Assets | $11,000 |
| Liabilities and Capital | |
| Liabilities | |
| Current Borrowing | $0 |
| Long-term Liabilities | $0 |
| Accounts Payable (Outstanding Bills) | $0 |
| Other Current Liabilities (interest-free) | $0 |
| Total Liabilities | $0 |
| Capital | |
| Planned Investment | |
| Cindy Wells | $15,714 |
| Diane Davis | $15,714 |
| Other | $0 |
| Additional Investment Requirement | $0 |
| Total Planned Investment | $31,428 |
| Loss at Start-up (Start-up Expenses) | ($20,428) |
| Total Capital | $11,000 |
| Total Capital and Liabilities | $11,000 |
| Total Funding | $31,428 |
2.2 Company Locations and Facilities
The principals of EBA chose Morgantown to locate the office, not only for its proximity to the Pennsylvania Turnpike and the growth potential of the area, but also because of a regional telephone service’s capability of offering DSL, high speed Internet access. DSL is extremely important considering EBA is using an Application Service Provider to house the Human Resource Information Software (HRIS) system. Accessing client information is instantaneous using DSL; as opposed to normal dial-up access which could take much longer.
EBA has signed a one year lease agreement for the 500 square foot office space for a monthly rental fee of $600. The office is located on the second floor of a small office building. The principals have already purchased a phone system, fax machine with limited copier capability, and a printer.
Recent years have seen much industrial and residential expansion in the northern and western suburbs of the Philadelphia, PA area. In under one hour, traveling east or west, employees of EBA can be in the York, Lancaster, Reading, Allentown, Exton, and Philadelphia areas.
2.3 Company Ownership
The principals of EBA share equally in the ownership. Although each partner has different strengths within the Human Resources field, cross training is a very important part of their management plan. It is very important that each can handle every aspect of the business, especially in the start-up years. As the company grows and adds staff, the principals will diversify into other equally strategic positions.
The principals decided to establish EBA as an LLC, Limited Liability Company, based on their investigation of liability and tax treatment.
Services
EBA offers a variety of services tailored to each client. It provides specialized expertise allowing the client’s HR Department to support the organization’s core competencies. EBA will focus on:
- Administration of COBRA and HIPAA
- Administration of Flexible Spending Accounts
- Administration of Basic Employee Benefits programs — eligibility, enrollment, billing reconciliation and employee support through a call center
- An all inclusive level with all of the above
3.1 Service Description
PRODUCT/SERVICE SUMMARIES

1. COBRA and HIPAA administration
- COBRA is an acronym for the Consolidated OmniBus Reconciliation Act. It is a federal mandate which states that employers must offer terminated employees and their eligible dependents the option to continue their group health plan coverage for a minimum of 18 months by paying a monthly premium. There are many regulations governing the information and types of communications which must be distributed to the terminated employees. If the terminated employee and/or dependents elect this coverage, they have the same coverage and rights as an active employee. Employee Benefits Administrators will track the eligibility, provide the employee communications, and accept payment of the COBRA premium to remit to the employer or provider. EBA will have a working relationship with the benefit providers.
- HIPAA is the Health Insurance Portability and Accountability Act. It is also a federal mandate and states that employers must provide verification of group health insurance coverage to terminated employees and their eligible dependents. This notice is basically used by the terminated employee and/or dependent to substantiate their previous coverage, and can be used to meet all or a portion of any waiting period subject to ‘pre-existing’ conditions imposed by future employers’ group health plans. EBA will administer this process.
2. Flexible Spending Accounts administration
- There are two types of Flexible Spending Account plans: medical and dependent care. In a Flexible Spending Account arrangement (FSA), the employee signs a salary reduction agreement establishing per pay period contributions to either (or both) types of accounts. These deferrals are calculated on a pre-tax basis (federal and most states). The IRS sets a limit on the dependent care account of $5,000; the employer sets the limit on the health care account. As the employee incurs eligible expenses, they submit ‘proof of services’, usually receipts, and are then reimbursed from their pre-tax accounts. EBA will track eligibility, enrollments and changes, as well as process the claims submitted for reimbursement. EBA will have a banking agreement with each client.
3. Basic Benefits Administration for Group Health Plans
- EBA will handle: eligibility tracking, benefit plan enrollments/deletions, monthly billing reconciliation for all applicable providers, and a call center to handle employee phone calls. Employee communications are key to these processes, and EBA will conduct employee meetings and manage the communications and enrollment/change processes. It will also be necessary for EBA to establish solid working relationships with the benefit providers (insurance companies, or third party administrators). EBA, in effect, becomes the Employee Benefits Administration Department for their client.
- EBA will reconcile the monthly provider billings. For example: If an employer offers employees group health plan insurance with Blue Cross Blue Shield, the employer will be billed monthly for the premiums. EBA will reconcile these billings with the number of employees covered and the coverage options of each employee.
- EBA will also provide a call center to the clients’ employees. This call center is designed to handle ADMINISTRATIVE QUESTIONS ONLY. Below is a sampling of questions the call center will take:
- What type of coverage do I have?
- Can you explain the Explanation of Benefits I just received from the insurance company?
- Can you tell me the status of my flexible spending account reimbursement?
- How do I add a dependent to my coverage?
- Please note that these questions can be easily answered by either looking at the employee database Employee Benefits Administrators will maintain, or by receiving a fax from a covered employee or dependent of a processed Explanation of Benefits. The call center will not answer questions regarding the group plan legal document NOR will the call center decide or rule if a health care claim was processed correctly.
4. A service level that includes all of the options above
- Some clients may wish to bundle the above services and contract with EBA for all of the services it provides.
Within the first three to four years in business, EBA plans to expand its services from strictly benefits administration to offering payroll services and other HR administration programs.
3.2 Competitive Comparison
Companies that currently provide benefits outsourcing include: Benefit Concepts, Trion, The Javers Group, Arbor, ADP and Ceridian. However, these companies either provide partial outsourcing services and it is not their main line of business, or they target a much larger clientele.
Additionally, some insurance companies and brokers offer some degree of administrative support. EBA will tailor its services to each client, including offering a call center to answer employees’ questions. The call center, along with the principals’ 25 years of experience, are key factors that the competition doesn’t have. Unless a competitor is a third party administrator for processing claims, they will not provide a call center.
It has been the experience of the principals that no matter how much a company automates the benefits process, employees still want to pick up the phone and speak to a live person. It is an invaluable customer service feature. The principals of Employee Benefits Administrators have over 25 years of experience in corporate benefit administration and a history of providing outstanding customer service. Throughout their careers with various employers, they have held senior benefits positions, giving them an edge over their competition.
3.3 Sales Literature
EBA has produced a brochure for their clients. This brochure outlines the services provided, as well as the benefits a company will experience by outsourcing benefits administrative functions.
EBA will publish a quarterly newsletter to be sent not only to current clients, but to prospects as well. The newsletter will include recent legal updates and summaries, definition of terms, and a brief question and answer section on basic employee benefit questions.
A Power Point presentation has been designed to deliver in a sales presentation. When presenting proposals, EBA will not only offer the proposal document, but also a folder of information. The folder will include hand-outs explaining the company, its services, and their edge over the competition.
A website is also in process. It is designed to handle general benefits questions as well as describing and marketing EBA’s services. The website will contain links to other appropriate Human Resources websites.
3.4 Fulfillment
Once a client signs a contract for services, EBA will meet with the current benefits administrator to complete a client data sheet. The client data sheet will:
- List the current benefit providers
- List the appropriate contacts
- List the office locations or divisions of the client for reporting purposes
- Outline the current enrollment and change processes
- Outline the current provider billing schedule and processes
- Determine the types of employee communications EBA will be responsible to distribute to the client’s employees
- Determine the schedule and types of employer reports
From the client data sheet, EBA will then initiate the relationships necessary for each service. For example: if EBA is to administer the medical insurance, the insurance provider will be contacted and introduced to EBA as the new administrator. EBA then becomes the contact for these services and the benefit provider will accept and funnel information through EBA.
With the completion of the client data sheet, EBA will request the census of appropriate employee data in order to populate the HRIS. Two audits of this information will be performed. The first will audit the client’s data against EBA’s, and the second will audit EBA’s data against each benefit provider.
As of the effective date of the contract, EBA will then become the client’s Benefits Administration Department. Depending on the services the client has elected, EBA will be responsible for:
- Preparation and distribution of enrollment packets and/or other employee communications
- Employee and dependent benefit eligibility tracking
- Employee and dependent benefits enrollment
- Maintenance of a Human Resources Information System (HRIS) to track data
- Notification of enrollments, changes and terminations to appropriate benefit vendors
- Month end billing reconciliation of benefit vendor invoices to HRIS and employer databases
- COBRA administration
- HIPAA administration
- Flexible Spending Account administration (health and dependent care)
- Call center to handle certain employee questions (eligibility and certain claims issues)
3.5 Technology
EBA relies on the technology of ASP: Application Service Providers. EBA is the benefits administrator for its clients and needs immediate access to employee data. Buying this technology and hiring a professional to support it is not cost effective for a start-up company. By contracting with an ASP, EBA has access to software and support that otherwise may not be available.
EBA has purchased access licensing for the Human Resources software. This software will track all of the necessary information on employees, and offers a reporting module in order to provide clients with periodic reports. The software is set up to handle multiple companies with multiple locations and/or divisions, if necessary. Great Plains™ is also “expandable”, meaning the package can deliver more than just employee benefits information. For example: the software also offers a Payroll Module. This was a definite benefit when reviewing software packages, especially since Payroll Services may be part of EBA’s future service options.
Currently, the two principals have IBM laptop computers which are networked at the office. Each laptop can be “docked” into a dummy terminal allowing use of a full size monitor and keyboard. Internet access is handled via a DSL modem and router. The DSL service is provided by the main telephone service provider in the area.
As stated previously, high speed Internet access through DSL is extremely important. A client’s employee data needs to be accessed in a moment’s notice in order to provide the client with a basis of good customer service.
3.6 Future Services
In the future, EBA will broaden its services to include administration of payroll processing as well as other types of optional Human Resources programs. The principals of EBA will continue to watch the development in HR and follow the avenues leading to more business opportunities and ideas.
As the company and the outsourcing market grows, the Internet will become a very valuable tool. The website and the Internet can greatly automate employee enrollments and change processes. The website is planned to be able to handle multiple company and users specific to each company’s plans, with links to the company’s website and intranet.
Obtaining broker and agent licenses are also planned. In becoming brokers and agents, EBA will be able to provide more services to their clients — offering it all under “one roof”.
EBA will also expand its market to national companies as well, but will continue to focus on the small to medium size employer.
Market Analysis Summary
Outsourcing can be implemented without regard to the size of the company (measured by profit or employee population), or to the business in which they are engaged. Any and all companies who offer benefit programs to their employees can reap the rewards of outsourcing certain functions.
EBA is focusing its efforts on the small to medium size employers. Today, these employers experience not only changing government regulations, but also an mobile and diverse workforce. In order for the companies to stay competitive in their marketplace, they must be able to attract and retain employees while staying focused on the success of their business. Therefore, the Human Resources departments are faced with multiple tasks — they must not only stay current and offer attractive benefit programs, but also keep up with the day-to-day administration of running the department and its programs. It is the day-to-day administration which is so time-consuming. This administration is viewed as “overhead” for the company, and depletes the time and resources which should be focused on the more important issues. Therefore, companies are looking outside of their organization for answers, and the most desirable solution is outsourcing the administrative tasks.
Michael Losey, former President of the Society of Human Resource Management (SHRM), spoke at the 2000 SHRM annual conference and stated that the future of Human Resources is about competencies… HR’s and the company’s employees. And, in order to become a strategic business partner, we need to expand out knowledge of laws, social and cultural issues, and leading-edge HR practices.
However, while striving to becoming a strategic partner, Human Resources is also faced with a 224% increase in the amount of HR transactions*. Outsourcing these functions is not a trend — it represents survival.
*SAP™ advertisement in HR Magazine, a SHRM publication
4.1 Target Market Segment Strategy
EBA will target companies with 10-500 employees. It is EBA’s goal to be recognized for providing high quality benefits administration and outstanding customer service for this size client who is often overlooked in the market place.
The ratio currently used today to substantiate the size of a Human Resources department is one HR professional per 100 employees. As a company grows, the HR department should also grow proportionately. However, most smaller companies are charged with complying withy the federal and state employment and discrimination laws no matter their size. Human Resources departments are responsible for this compliance. Therefore the level of expertise of a ‘personnel clerk’ twenty or so years ago, does not parallel the expertise once would need today. There are many companies with 500 employees or less whoa re faced with laws that only existed in the last 10 or so years.
In summary, companies now have many more Human Resources related rules and regulations to comply with, and adding more ‘overhead’ personnel is very costly. By outsourcing these administrative functions, companies are paying for a service and are not burdened by more overhead costs.
4.1.1 Market Needs
The outsourcing of an administrative business function can truly benefit any size or type of company. It is estimated, by SAP™, a major HR technical company, that Human Resources transactions will increase by 224% by 2006. And, as per the Industrial Democracy Commission, (IDC), the amount spent on Human Resources outsourcing is expected to reach $10.2 billion by 2003. These estimates include all types of industry and all sizes of companies.
The following quote is taken from the book, Outsourcing Human Resources Functions, written by Mary Cook: “If you think HR outsourcing is a trend that will dissipate with time, think again. Outsourcing is a serious and permanent new development. When done properly, outsourcing can deliver radically improved services and significant bottom-line savings — benefits that are too attractive to be ignored.”
Human Resource professionals need to become a strategic partner and assist their companies in becoming and staying an employer of choice. Administrative functions are increasing at an astronomical rate, and even though automation can help to some extent, employees still need the personal service of an HR department. As the HR departments become overwhelmed with the amount of administrative transactions, EBA can provide this personal service to their employees.
4.1.2 Market Trends
The trend today is for Human Resource Professionals to assist their companies in basic survival and growth. Unemployment is at an all time low, and companies need to be recruiting, hiring and retaining the right people. HR is the key. Once the employee is hired, HR needs to work on staying competitive — keeping their companies on the leading edge of work and life issues in order to sustain the workforce. Employees are looking for more than just base pay to keep them at a job. The benefits need to be current and up to date — not just health, life and disability, but also time off and flexible work life issues need to be addressed. Employee retention is one of the most visible ways a Human Resources Department can substantiate a return on investment. When these departments become overwhelmed with the day to day “adminstrivia”, other more important functions fall through the cracks. Outsourcing this administration is the answer for many companies.
4.1.3 Market Growth
Companies are discovering the strategic value that HR professionals can have on their business — it is imperative that Human Resources attract, obtain and retain the workforce.
With an estimated increase of HR administrative transactions of over 200%, the strategic value of HR is in jeopardy. It is very difficult for any HR department to demonstrate a good Return On Investment (ROI) for the company, especially when their time is eaten up by administration concerns. Therefore, requesting more headcount to help with this administration is not a good option.
A Benefits Administrator in the Philadelphia area has an average annual base salary of $45,000. In addition to that, a company will need to pay benefits and taxes on that amount for an estimated total of $63,000. For a company with 250 employees EBA could handle basic benefits administration for $36,000. As companies become aware of administrative outsourcers, and the amount of money and time to be saved, outsourcing will grow.
4.2 Service Business Analysis
Outsourcing is not a brand new trend in the HR market place. However, the service providers in recent years have focused on defined contribution plans (401(k)) or defined benefit plans (pension plans). Outsourcing COBRA and Flexible Spending Accounts are more recent additions, however, as stated previously, these functions are usually a sideline added to the true focus of the company. For example: A third party administrator for a self insured client may offer administration of COBRA and HIPAA considering that they have a database of the employees information, but COBRA and HIPAA are not the true thrust of the business. Nor will this type of company provide administrative services on other benefit programs.
Employee Benefits Administrators’ vision is “to be a major supplier of outsourced benefits administration for small to medium size companies.” The benefits administration services and the customer service of the employees is not a sideline service. It is the main focus.
Larger companies lose the attention to detail when providing these sideline services. Details and employee concerns slip through the cracks. Customer service, especially for a small business, is extremely important.
4.2.1 Competition and Buying Patterns
The benefits administration business is not based on industry “seasonality.” Clients’ group benefit plan years do not necessarily run on a calendar year basis. Even though it is not uncommon for the plan years to be the calendar year, the group benefit plan year can coincide with the company’s fiscal year or any 12-month span that the company deems appropriate.
The only service that EBA offers that might be considered “seasonal” is the administration of the Flexible Spending Account Plans. Since these plan limitations are governed by a section of the Internal Revenue code, the plan years are based on a calendar year. However, companies who wish to initiate this type of benefit plan do not have to wait until January of a year to be effective. They can begin the plan any month of the year, however, the renewal must be effective in January of the next year. For example, a company can initiate a Flexible Spending Plan in July of 2001, and it will be in effect through December 31, 2001. The plan must be renewed, and there must be an ‘open enrollment’ for the plan year beginning January of 2002. Subsequent years will then be a full 12 month period beginning January of each year.
Strategy and Implementation Summary
Employee Benefits Administrators will initially focus on employers with 10 to 500 employees within the local counties: Chester, Berks, Montgomery, and Lancaster. COBRA/HIPAA and Flexible Account Administration will be the main focus for these are areas in which companies can already begin to see the need for outsourcing services. Employers with 20 or more employees must offer COBRA if they offer any health insurance to their employees. And, if companies are already having to increase their employee contributions toward the cost of benefits, then offering a Flexible Spending Program may alleviate this added financial burden.
5.1 Competitive Edge
Most of the competitors will shy away from offering a call center to answer employee questions. This gives EBA a definite advantage called — Customer Service.
When a client contracts with EBA, we represent two clients. One is the company, and the second is the company’s employees. The call center is a priceless customer service tool to both clients. By providing a call center, EBA saves the client the time that the Benefits Administrator would normally spend on the phone with employees, plus it is a valuable service to the employees for their questions are answered on a timely basis.
The next edge is the expertise of the two principals. Both have held Employee Benefits and Administration positions and are aware of the laws, responsibilities, and customer service needed to excel. Competitors lack this advantage.
5.2 Marketing Strategy
The initial push for marketing will be the employer size, under 500. The business line of the company truly doesn’t matter.
Networking and keeping a mailing database is crucial. Both principals are members of Human Resources professional organizations which meet monthly — each attending approximately 4 meetings per month. At certain times, EBA will sponsor these meetings to present their services, however, these affiliations will be used as networking tools, and ‘word of mouth’ marketing.
In conjunction with this, EBA will also build a database with information obtained through the small business resources at the County Library. Informational packets and brochures will be sent out to the members of the database, with follow-up phone calls happening within two weeks of mailing.
The website will be linked to other popular sites, as well as advertised on small business service sites. By linking with these sites, EBA will be able to market its services over the Internet.
5.2.1 Pricing Strategy
Each level of service will be priced separately; the all-inclusive option will be discounted. Pricing will follow the industry standard and be charged on a per employee per month basis. Each client will also be charged a start-up fee depending on the number of employees. Depending on the size of the client and the number of group plans offered, EBA may impose an additional charge for the call center operation. Each client will be charged a one time start-up fee for transfer of employee data into the Great Plains software.
P/S Level Name — Brief Description — Cost — Start-up Fee
- COBRA & HIPAA — Notices, Administration of COBRA payments, and customer service for employees and eligible dependents — $12.75 per employee per month — $500
- Flexible Spending Accounts — Employee Communications, Enrollment, Flex Claims Processing and statements, and Employee and Bank Account Reconciliation — One Account per employee: $6.50 or Two Accounts per employee: $9.50 — $500
- Basic Benefits Administration — Employee Communications, Enrollments and Changes, Call Center for employee questions, Reconciliation of Provider Billings, Maintenance of Employee Benefit Data. Does not include COBRA, HIPAA, or Flex — $12.00 per employee per month — $2,000
- All-Inclusive — All of the above — $18.00 per employee per month — $2000
5.2.2 Promotion Strategy
EBA’s main focus on promotion will consist of speaking engagements at the professional associations, as well as networking with the members. Initially these engagements will be educational in nature, explaining the HR services and the laws that require employers to comply. EBA will also show that by offering a Flexible Spending Account Plan, employers will be able to help their employees offset any planned increase for their health insurance premium increases. Smaller employers may need education on these items since they may not have the resources to employ the HR knowledge.
As previously stated, the website is also a very important part of the promotion strategy. The majority of businesses today use the Internet not only for information, but also for comparing and pricing what is available. The website will house information about EBA, as well as educational information for companies who may not realize that if they have 20 or more employees, they must provide the COBRA option.
Direct mail will also be a small portion of the strategy — with follow-up calling.
5.2.3 Marketing Programs
EBA will network with business associates, insurance brokers, and local businesses. The principals of EBA are members of several local HR associations and Chambers of Commerce, and can promote their services through these organizations. EBA also has a relationship with an Application Service Provider for any software package, who is very interested in promoting HR support services. Their existing customers are potential clients for EBA, and the ASP will also give EBA access to an extensive mailing list of possible clients.
EBA can be a service provider for group insurance brokers whose clients have a need for outsourcing benefits administration. Although the relationships with the group insurance brokers are extremely important, the marketing and sales strategy will also include:
- Contacting previous business acquaintances and announcing the business. The contacts will be made either via telephone or a direct mailing including a brochure.
- Sales and marketing leads can also be purchased from marketing companies. These leads will list company size (by employees) as well as contact information.
- Most of the initial contacts will be made in the eastern Pennsylvania area, and EBA has attained a geographic employer summary of the area from an Internet site, PASourceline. Also, business listings and lead documents are obtained by using the resources at Chester County Library.
- As stated in the marketing strategy, the principals of EBA are members of Human Resources trade organizations on a local and national level. EBA can sponsor these organizations’ meetings to market their services. (Note: as of the writing of this business plan, EBA will be sponsoring a luncheon meeting of the Chester County Human Resources Association on May 18, 2001.)
- A press release has been sent to the local Chamber of Commerce, Morgantown Area Business Association, which is included in the current newsletter, and will appear in the May issue of two other Human Resources organization’s newsletters (CCHRA & GVFHRA).
- “New Business” press releases have also been sent to the local papers. Considering the general public may not be familiar with the business term, “Outsourcing”, EBA is planning an article explaining their services.
EBA will also target members of local business associations to receive a cover letter and brochure explaining our services. A follow-up phone call will take place within two weeks. At the same time, as mentioned above, local newspapers will spotlight EBA as a new company. This joint effort will promote the name and create an awareness of the outsourcing trend.
As the company grows, marketing strategies will include radio time and advertisements in HR trade journals. EBA can also build relationships with larger HR consulting firms and subcontract its services.
The most important marketing program is the networking, and both principals will initially be involved in the speaking engagements and subsequent sales presentation.
The first speaking engagement is May 18, 2001 at the monthly luncheon meeting of the Chester County Human Resources Association. The meeting will be attended by approximately sixty-five members.
EBA will sponsor this luncheon. Ms. Davis will speak about the outsourcing market and give a brief history of both principals. Ms. Wells will speak about EBA’s services. A table with promotional material will be set-up, and a raffle will be held for a gift basket — from which EBA will keep business cards. Follow-up notes and thank you notes will be sent the following week.
The other key marketing tool, the website design is currently being handled by Ms. Davis who will contract a designer by the end of May. The budget for this project has not yet been decided.
The direct mailings will be handled by both principals.
5.3 Value Proposition
By outsourcing administrative functions, a company can save in two very important areas: Time and Money. This is basically the goal of outsourcing.
By contracting with EBA, companies can use their current Human Resource professionals in other strategic areas. For example: if the company is growing, it will need to hire qualified people — and keep them. The company needs their HR department to focus on these issues. Not just attracting and interviewing the employees, but making certain the employees stay once they are hired. The company needs to offer programs and benefits in order to retain these employees. Turnover and retraining are so expensive. If the company outsources the benefits administration, they would then be able to save the time and use their current staff to help with all of these more important issues. As the company grows and decides it needs to add HR staff, it does not have to add a Benefits Administrator — for they have outsourced that function — they can then use that budget for additional HR staff to hire a more strategic position — such as a full-time Recruiter, Compensation Manager, or Employee Relations Manager.
As stated previously in Section 4.1.3, in the Philadelphia region, the average salary of a Benefits Administrator is about $45,000 annually plus benefits. For an average small company of 250 employees, EBA can administer the benefit plans for approximately $36,000 and a start up fee of $2,000.
5.4 Sales Strategy
As stated previously, customer support for the clients’ employees is key. If the employees are satisfied with the administration of their benefits, the client will hear no complaints. However, it is also necessary to keep the client company satisfied as well. Along with customer service, bottom line savings will be stressed in the sales presentation.
Considering EBA is starting out small, with just the two principals on staff, there is no question of accountability. Each principal is committed to customer service, and keeping the client happy with the services provided. To make certain this happens EBA will listen to the client and try to accommodate their needs with the services. EBA will provide clients with the services and reports that will make the client’s jobs “easier”. Internally, clients HR departments may be responsible for different reporting, and EBA will mold its services to fit those needs.
5.4.1 Sales Forecast
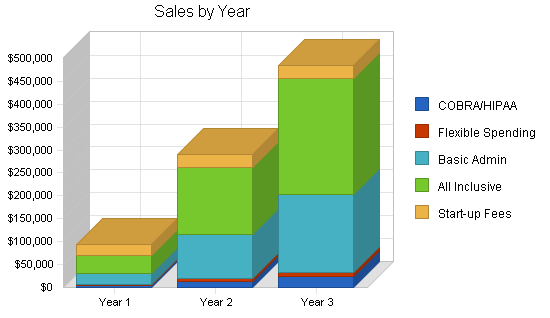
Projected sales figures are based on the four different services Employee Benefits Administrators provides. Each service has a different “AVERAGE” client.
- Level One is COBRA and HIPAA administration. This client has an average of 100 employees, however, the average number of employees for which a client will use this service is five.
- Level Two is Flexible Spending Account administration. This client also has an average of 100 employees. The average number of employees enrolling in a Flexible Spending Account is estimated at ten.
- Level Three is Basic Benefits administration, including a call center. This client also has an average of 100 employees, and it is likely that all 100 employees will enroll in one of the company’s group benefit plans. The average number of employees enrolling in the Basic Benefits administration is 100.
- Level Four is All-Inclusive of the first three services. This client also has an average of 100 employees, and it is likely that all 100 employees will enroll in one of the company’s group benefit plans.
The sales forecast is based on obtaining:
- One client a month for COBRA and HIPAA administration. COBRA and HIPAA are federal mandates and must be provided to employees after their termination. This is not seasonal.
- One Flexible Spending Account client for the first year, adding three new clients each calendar year (one per quarter, and two at the beginning of each year since that is when Employee Benefits Administrators can obtain clients who are renewing their flex plans.)
- One Basic client added each quarter (100 employees), and two clients in January of each year for those companies whose plan year is the calendar year.
- One All-Inclusive client added each quarter (100 employees), and two clients in January of each year for those companies whose plan year is the calendar year.
- A signed service contract
As EBA attains clients, the only direct cost of goods sold is the data storage fee paid to the Application Service Provider. This is a per employee per month charge and is related to Level One, Level Three and Level Four. (It is not related to Level Two, Flexible Spending Accounts, as it is not necessary to use the same information system to store the data.) This can be tracked in an ad-hoc database created by EBA. It is also forecasted that EBA will purchase a software package designed to track both Flexible Spending and COBRA. The cost of this software in 2000 was approximately $14,000 and is not scheduled to be purchased until the second calendar quarter of 2002. After this software is purchased, COGS will also decline for those clients who are contracted for COBRA and HIPAA administration only.
Please note in the Sales Forecast Table the “start-up fee” is represented as $100. It is noted this way because the start-up fee is charged to the client, but the sales figures are based on the number of employees. The start-up fee schedule is a one time fee for transfer of employee data into the Great Plains software. Each COBRA/HIPAA client will pay $500; each Flexible Spending Account client will pay $500; each Basic Benefits and All-Inclusive client will pay $2,000.

| Sales Forecast | |||
| Year 1 | Year 2 | Year 3 | |
| Unit Sales | |||
| COBRA/HIPAA | 360 | 1,110 | 1,830 |
| Flexible Spending | 180 | 660 | 1,380 |
| Basic Admin | 2,100 | 8,100 | 14,100 |
| All Inclusive | 2,100 | 8,100 | 14,100 |
| Start-up Fees | 240 | 290 | 290 |
| Total Unit Sales | 4,980 | 18,260 | 31,700 |
| Unit Prices | Year 1 | Year 2 | Year 3 |
| COBRA/HIPAA | $12.75 | $12.75 | $12.75 |
| Flexible Spending | $7.50 | $7.50 | $7.50 |
| Basic Admin | $12.00 | $12.00 | $12.00 |
| All Inclusive | $18.00 | $18.00 | $18.00 |
| Start-up Fees | $100.00 | $100.00 | $100.00 |
| Sales | |||
| COBRA/HIPAA | $4,590 | $14,153 | $23,333 |
| Flexible Spending | $1,350 | $4,950 | $10,350 |
| Basic Admin | $25,200 | $97,200 | $169,200 |
| All Inclusive | $37,800 | $145,800 | $253,800 |
| Start-up Fees | $24,000 | $29,000 | $29,000 |
| Total Sales | $92,940 | $291,103 | $485,683 |
| Direct Unit Costs | Year 1 | Year 2 | Year 3 |
| COBRA/HIPAA | $2.75 | $2.75 | $2.75 |
| Flexible Spending | $0.00 | $0.00 | $0.00 |
| Basic Admin | $2.75 | $2.75 | $2.75 |
| All Inclusive | $2.75 | $2.75 | $2.75 |
| Start-up Fees | $0.00 | $0.00 | $0.00 |
| Direct Cost of Sales | |||
| COBRA/HIPAA | $990 | $3,053 | $5,033 |
| Flexible Spending | $0 | $0 | $0 |
| Basic Admin | $5,775 | $22,275 | $38,775 |
| All Inclusive | $5,775 | $22,275 | $38,775 |
| Start-up Fees | $0 | $0 | $0 |
| Subtotal Direct Cost of Sales | $12,540 | $47,603 | $82,583 |
5.5 Strategic Alliances
EBA will depend on alliances with:
- Group Insurance Brokers who provide group benefit plans to employers with less than 500 employees. These brokers speak with clients daily and listen to their needs. Partnering with group brokers is a great strategy, for they can market our services initially without our presence.
- EBA’s Application Service Provider is an outsource provider for Accounting Services. Their clients could possibly become EBA’s clients.
- Accounting Firms — Many small to medium size companies use outside accounting firms to handle their financial transactions and reportings. By affiliating with these firms, EBA can obtain referrals if their clients are in need of employee benefits administration services.
- Chambers of Commerce and other Business Associations — These associations mainly deal with the same size client EBA is targeting. Speaking engagements and networking is a very big marketing and sales tool.
In addition to the above being strategic alliances for EBA, EBA will also be a referral source and advocate of these companies and associations.
5.6 Milestones
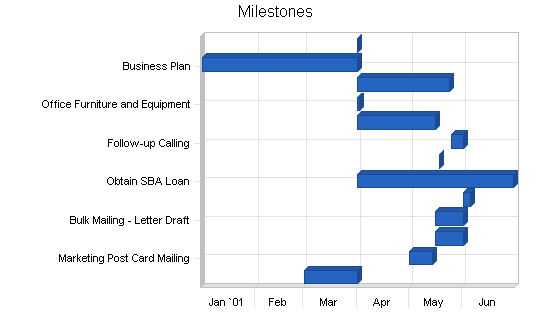
As described in the business plan’s affiliated table, both principals have responsibilities with the milestones which have been set. Most of the initial milestones have been met, with the marketing and follow-up calls still to take place. Both principals are accountable for these milestones.
It should be noted that most of the milestones have been omitted which had a commitment date prior to the office opening in April of 2001. The principals had been talking, planning, and preparing for this for almost a year.
| Milestones | |||||
| Milestone | Start Date | End Date | Budget | Manager | Department |
| Obtaining Office Space | 3/1/2001 | 4/1/2001 | $1,200 | Wells | Principal |
| Marketing Post Card Mailing | 5/1/2001 | 5/14/2001 | $75 | Davis | Principal |
| Bulk Mailing – Obtaining Leads | 5/16/2001 | 6/1/2001 | $0 | Wells | Principal |
| Bulk Mailing – Letter Draft | 5/16/2001 | 6/1/2001 | $0 | Wells | Principal |
| Bulk Mailing – Mail Merge and Mailing | 6/1/2001 | 6/5/2001 | $400 | Davis | Principal |
| Obtain SBA Loan | 4/1/2001 | 6/30/2001 | $1,000 | Davis/Wells | Principals |
| Speaking Engagement | 5/18/2001 | 5/18/2001 | $150 | Davis/Wells | Principals |
| Follow-up Calling | 5/25/2001 | 6/1/2001 | $0 | Davis/Wells | Principals |
| Brochures | 4/1/2001 | 5/16/2001 | $500 | Wells | Principal |
| Office Furniture and Equipment | 4/1/2001 | 4/2/2001 | $500 | Wells | Principal |
| Supplies | 4/1/2001 | 5/24/2001 | $400 | Davis/Wells | Principals |
| Business Plan | 1/1/2001 | 4/1/2001 | $150 | Davis | Principal |
| Success | 4/1/2001 | 4/1/2001 | $0 | Davis/Wells | Principals |
| Totals | $4,375 | ||||
Management Summary
The principals of EBA, Diane Davis and Cindy Wells, have over 25 years of experience in corporate benefits administration, employee relations and communications, and legal compliance. They have sat at the Employee Benefits Manager’s desk, and know the tasks that these HR professionals face everyday. In order to be successful, human resources professionals need to not only know the laws governing their employer’s plans, but also how to communicate with both management and employees.
Cindy Wells has been involved in Human Resources for over 18 years. During the past 15 years, she held several positions with one employer, most recently as Director of Benefits and Payroll. She led the development of the Human Resources Department and was responsible for a wide range of activities including employee benefits, payroll, employee relations and legal compliance. She has designed and implemented benefit programs in numerous areas, including medical, dental, life insurance, flexible spending accounts and 401(k) plans.
Ms. Wells has extensive experience in contract negotiations with benefit providers, as well as the transition of coverage to new carriers. Her background includes supporting employees in multiple domestic locations as well as in an international environment.
She is a graduate of the University of South Florida with a degree in Fine Arts with continued studies on the graduate level. She is a member of the Society for Human Resources Management (SHRM), the Chester County Human Resources Association (CCHRA), as well as the Greater Valley Forge Human Resources Association (GVFHRA).
Diane Davis was most recently employed as a Senior Employee Benefits Manager. She has held diverse HR positions since her career began in 1989. She began her HR career as an Employee Benefits Manager and was responsible for the design, implementation, and maintenance of all employee benefit plans. She has also held senior employee benefits positions at another high-tech firm, with very similar duties from 1992 through 1996.
In 1995, Ms. Davis obtained her PHR (Professional in Human Resources) certification and expanded her HR focus to include generalist duties, compensation plan research, development and consulting, employee relations and diversity, as well as executive search.
She is a member of the Society for Human Resource Management (SHRM), the Greater Valley Forge Human Resources Association (GVFHRA), and the Chester County Human Resources Association(CCHRA).
Ms. Wells and Ms. Davis bring into this business venture a vast knowledge of not only the employee benefits field but also a focus on customer service and communication. This is a key factor for not only are the clients their customers, but also the clients’ employees. They understand this and are committed to providing the highest level of customer support to both.
6.1 Management Team Gaps
The present management team, consisting of the two principals, Diane Davis and Cindy Wells, requires professional support for accounting functions with an emphasis on filing company taxes. To date, an accounting firm has not yet been contracted.
The team is aware that as the company attains clients, they will need administrative and marketing support, and have planned for that in the personnel plan. In order to compensate for this lack, both principals are doing their own administrative work and are attending coaching sessions on marketing and sales with The Enterprise Business Center which offers entrepreneurial training, and SCORE, which is the Service Corps of Retired Executives, which is affiliated with the Small Business Association and offers mentoring of new businesses.
6.2 Personnel Plan
The two principals will initially staff EBA. In 2002, an administrative assistant will be hired in January, a marketer in July 2002, and a benefits administrator in October.
It should be noted that both Ms. Davis and Ms. Wells are committed to staffing their business with qualified people who have a background in Human Resources and/or Customer Service.
| Personnel Plan | |||
| Year 1 | Year 2 | Year 3 | |
| Production Personnel | |||
| Name or title | $0 | $0 | $0 |
| Name or title | $0 | $0 | $0 |
| Name or title | $0 | $0 | $0 |
| Other | $0 | $0 | $0 |
| Subtotal | $0 | $0 | $0 |
| Sales and Marketing Personnel | |||
| Marketer Part Time | $0 | $18,750 | $25,000 |
| Name or title | $0 | $0 | $0 |
| Name or title | $0 | $0 | $0 |
| Other | $0 | $0 | $0 |
| Subtotal | $0 | $18,750 | $25,000 |
| General and Administrative Personnel | |||
| Cindy Wells | $30,000 | $30,000 | $30,000 |
| Diane Davis | $30,000 | $30,000 | $30,000 |
| Administrative Assistant Part Time | $3,252 | $13,000 | $13,000 |
| Benefits Administrator | $0 | $6,250 | $25,000 |
| Receptionist Part Time | $0 | $0 | $9,750 |
| Benefits Administrator | $0 | $0 | $12,500 |
| Subtotal | $63,252 | $79,250 | $120,250 |
| Other Personnel | |||
| Name or title | $0 | $0 | $0 |
| Name or title | $0 | $0 | $0 |
| Name or title | $0 | $0 | $0 |
| Other | $0 | $0 | $0 |
| Subtotal | $0 | $0 | $0 |
| Total People | 3 | 5 | 7 |
| Total Payroll | $63,252 | $98,000 | $145,250 |
Financial Plan
Initially, the two principals of Employee Benefits Administrators invested into the business. This investment was used for the majority of start-up expenses. These purchases include IBM laptop computers, software licensing fees of Great Plains Software, computer accessories and a docking station, small business education, seminars on current employee benefit trends, memberships in organizations, rent and security deposit of an office, and various other start-up costs. Expenses continue to be paid by the principals, including rent, utilities, and other working capital.
Considering the forecasts predict an overall loss for the first year of business, EBA will follow avenues for obtaining a small business loan, preferably one guaranteed by the Small Business Association.
EBA is forecasting sales based on their group benefits knowledge, marketing research, and their strategic alliances with brokers and other professional associations.
7.1 Important Assumptions
The financials are based on the following assumptions.
Sales Assumptions:
Projected sales figures are based on the four different services Employee Benefits Administrators provides. Each service has a different “AVERAGE” client.
- Level One is COBRA and HIPAA administration. This client has an average of 100 employees, however, the average number of employees for which a client will use this service is five.
- Level Two is Flexible Spending Account administration. This client also has an average of 100 employees. The average number of employees enrolling in a Flexible Spending Account is estimated at ten.
- Level Three is Basic Benefits administration, including a call center. This client also has an average of 100 employees, and it is likely that all 100 employees will enroll in one of the company’s group benefit plans. The average number of employees enrolling in the Basic Benefits administration is 100.
- Level Four is All-Inclusive of the first three services. This client also has an average of 100 employees, and it is likely that all 100 employees will enroll in one of the company’s group benefit plans.
The sales forecast is based on obtaining:
- One client a month for COBRA and HIPAA administration. COBRA and HIPAA are federal mandates and must be provided to employees after their termination. This is not seasonal.
- One Flexible Spending Account client for the first year, adding three new clients each calendar year (one per quarter, and two at the beginning of each year since that is when Employee Benefits Administrators can obtain clients who are renewing their flex plans.)
- One Basic client added each quarter (100 employees), and two clients in January of each year for those companies whose plan year is the calendar year.
- One All-Inclusive client added each quarter (100 employees), and two clients in January of each year for those companies whose plan year is the calendar year.
- A signed service contract
Cost of Sales:
As EBA attains clients, the only direct cost of goods sold is the data storage fee paid to the Application Service Provider. This is a per employee per month charge and is related to Level One, Level Three and Level Four. (It is not related to Level Two, Flexible Spending Accounts, as it is not necessary to use the same information system to store the data.) This can be tracked in an ad-hoc database created by EBA. It is also forecasted that EBA will purchase a software package designed to track both Flexible Spending and COBRA. The cost of this software in 2000 was approximately $14,000 and is not scheduled to be purchased until the second calendar quarter of 2002. After this software is purchased, COGS will also decline for those clients who are contracted for COBRA and HIPAA administration only.
As stated above, the depreciable expense will be for the computer system/network. The non-depreciable start up expenses will include:
- Advertising
- Fax machine with limited copier capabilities
- Printer
- Professional association membership dues
- Office furniture
- Business insurance
- Internet access
- Software licensing fees and training
- Phone, phone system, and installation
- Postage machine lease
- Professional fees
- Rent with security deposit
- Industry related seminars and meetings
- Software
- Web page design and hosting
Financial Assumptions Definitions and Explanations:
Accounts Payable: EBA will be applying for a working capital loan of which the status is not yet determined.
Average Client:
- Level One is COBRA and HIPAA administration. This client has an average of 100 employees, however, the average number of employees for which a client will use this service is five.
- Level Two is Flexible Spending Account administration. This client also has an average of 100 employees. The average number of employees enrolling in a Flexible Spending Account is estimated at ten.
- Level Three is Basic Benefits administration, including a call center. This client also has an average of 100 employees, and it is likely that all 100 employees will enroll in one of the company’s group benefit plans. The average number of employees enrolling in the Basic Benefits administration is 100.
- Level Four is All-Inclusive of the first three services. This client also has an average of 100 employees, and it is likely that all 100 employees will enroll in one of the company’s group benefit plans.
Depreciation: EBA is using straight line depreciation for their computer and other equipment.
Insurance Expense: Liability (Errors and Omissions) Insurance has been purchased and the cost is $100 per month.
Legal and Accounting Fees: Employee Benefits Administrators has retained legal counsel. The hourly rate for counsel is $250, and hourly legal assistance is $60. Accounting will be handled by a local CPA yet to be determined.
Loan Expenses: The amounts noted in the financial statements are based on a $50,000 loan for five years at 9% interest.
Payroll Expense: Besides the two principals, the following additions to staff are planned:
- Jan 2002, Hire, Part-time Administrative Assistant at $13,000
- July 2002, Hire, Part-time Marketer at $25,000
- Oct 2002, Hire, Benefits Administrator at $25,000
- Mar 2003, Hire, Part-time Receptionist at $13,000
- July 2003, Hire, Benefits Administrator at $25,000
Rent Expense: Employee Benefits Administrators is leasing a 500 square foot office in Morgantown, PA. The monthly rental is $600.
Salaries Expense: Each of the two principals of Employee Benefits Administrators will receive a yearly salary of $30,000.
Start-up Fee: A one time fee for transfer of employee data into the Human Resources Information System. Each COBRA/HIPAA client will pay $500; each Flexible Spending Account client will pay $500; each Basic Benefits and All-Inclusive client will pay $2,000.
Taxes: EBA is an LLC and as an entity is not taxed. However there is a payroll tax burden to include the employer’s portion of Social Security and Medicare as well as state and federal unemployment.
Utilities Expense: The monthly electric expense is projected to be $200. The monthly phone expense is projected to be $200.
| General Assumptions | |||
| Year 1 | Year 2 | Year 3 | |
| Plan Month | 1 | 2 | 3 |
| Current Interest Rate | 9.00% | 9.00% | 9.00% |
| Long-term Interest Rate | 8.00% | 8.00% | 8.00% |
| Tax Rate | 25.42% | 25.00% | 25.42% |
| Other | 0 | 0 | 0 |
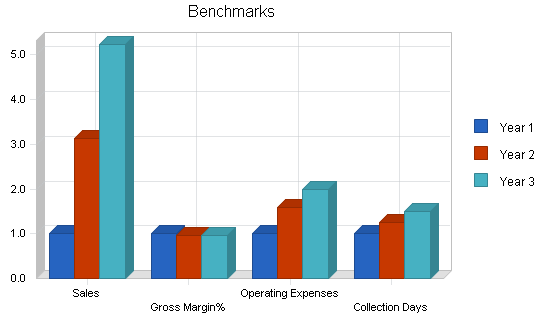
7.2 Key Financial Indicators
The following chart represents key financial indicators. The factors are Sales, Gross Margin%, Operating Expense, and Accounts Receivable.
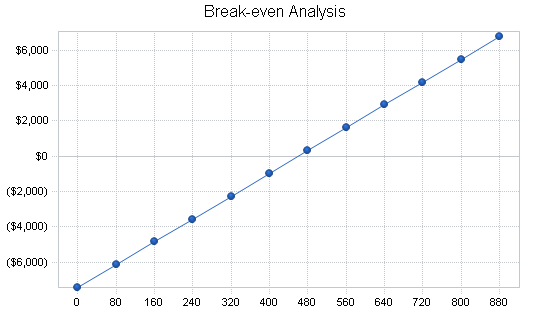
7.3 Break-even Analysis
The break-even point is based on other estimates and the projections contained in the financials. Based on an average fixed monthly cost, the break-even point in units is based on an average charge per unit with a variable cost per unit, as shown in the table and chart below. It should be noted that based in the fixed monthly cost is the cost of goods sold which, of course, increases with the number of units sold.
| Break-even Analysis | |
| Monthly Units Break-even | 460 |
| Monthly Revenue Break-even | $8,586 |
| Assumptions: | |
| Average Per-Unit Revenue | $18.66 |
| Average Per-Unit Variable Cost | $2.52 |
| Estimated Monthly Fixed Cost | $7,428 |
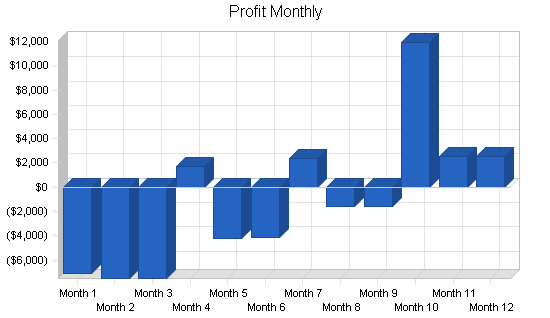
7.4 Projected Profit and Loss
The projected Profit and Loss for the first three years is shown on the following table.
For the first year in business, EBA is expecting a loss. Please note that this first twelve months shows no sales in the first three months as the company is becoming established. Year two shows a net profit and year three shows a hefty increase in profit. These projections are conservative considering this is a service business and can greatly depend on the economy and the level of benefits employers can afford.


| Pro Forma Profit and Loss | |||
| Year 1 | Year 2 | Year 3 | |
| Sales | $92,940 | $291,103 | $485,683 |
| Direct Cost of Sales | $12,540 | $47,603 | $82,583 |
| Production Payroll | $0 | $0 | $0 |
| Other | $0 | $0 | $0 |
| Total Cost of Sales | $12,540 | $47,603 | $82,583 |
| Gross Margin | $80,400 | $243,500 | $403,100 |
| Gross Margin % | 86.51% | 83.65% | 83.00% |
| Operating Expenses | |||
| Sales and Marketing Expenses | |||
| Sales and Marketing Payroll | $0 | $18,750 | $25,000 |
| Advertising/Promotion | $1,200 | $1,200 | $1,200 |
| Travel | $0 | $0 | $0 |
| Miscellaneous | $600 | $600 | $600 |
| Total Sales and Marketing Expenses | $1,800 | $20,550 | $26,800 |
| Sales and Marketing % | 1.94% | 7.06% | 5.52% |
| General and Administrative Expenses | |||
| General and Administrative Payroll | $63,252 | $79,250 | $120,250 |
| Sales and Marketing and Other Expenses | $0 | $0 | $0 |
| Depreciation | $1,020 | $1,020 | $1,020 |
| Dues and Subscriptions | $1,800 | $1,800 | $1,800 |
| Professional Fees | $600 | $600 | $600 |
| Rent | $7,200 | $7,200 | $7,200 |
| Software Purchases | $0 | $14,000 | $0 |
| Insurance | $1,200 | $1,200 | $1,200 |
| Telephone and Internet Access | $2,400 | $2,400 | $2,400 |
| Utilities | $2,400 | $2,400 | $2,400 |
| Miscellaneous | $2,400 | $2,400 | $2,400 |
| Payroll Taxes | $5,060 | $7,840 | $11,620 |
| Other General and Administrative Expenses | $0 | $0 | $0 |
| Total General and Administrative Expenses | $87,332 | $120,110 | $150,890 |
| General and Administrative % | 93.97% | 41.26% | 31.07% |
| Other Expenses: | |||
| Other Payroll | $0 | $0 | $0 |
| Consultants | $0 | $0 | $0 |
| Contract/Consultants | $0 | $0 | $0 |
| Total Other Expenses | $0 | $0 | $0 |
| Other % | 0.00% | 0.00% | 0.00% |
| Total Operating Expenses | $89,132 | $140,660 | $177,690 |
| Profit Before Interest and Taxes | ($8,732) | $102,840 | $225,410 |
| EBITDA | ($7,712) | $103,860 | $226,430 |
| Interest Expense | $3,897 | $3,632 | $2,957 |
| Taxes Incurred | $0 | $24,802 | $56,540 |
| Net Profit | ($12,629) | $74,406 | $165,913 |
| Net Profit/Sales | -13.59% | 25.56% | 34.16% |
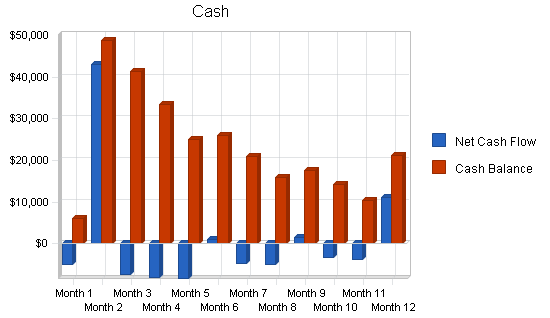
7.5 Projected Cash Flow
Cash flow projections are demonstrated by the following table and charts. Operating capital is needed and shown as a Current Borrowing capital loan. Cash flow is negative until the projected loan is received in May.
| Pro Forma Cash Flow | |||
| Year 1 | Year 2 | Year 3 | |
| Cash Received | |||
| Cash from Operations | |||
| Cash Sales | $0 | $0 | $0 |
| Cash from Receivables | $66,324 | $234,353 | $429,959 |
| Subtotal Cash from Operations | $66,324 | $234,353 | $429,959 |
| Additional Cash Received | |||
| Sales Tax, VAT, HST/GST Received | $0 | $0 | $0 |
| New Current Borrowing | $50,000 | $0 | $0 |
| New Other Liabilities (interest-free) | $0 | $0 | $0 |
| New Long-term Liabilities | $0 | $0 | $0 |
| Sales of Other Current Assets | $0 | $0 | $0 |
| Sales of Long-term Assets | $0 | $0 | $0 |
| New Investment Received | $0 | $0 | $0 |
| Subtotal Cash Received | $116,324 | $234,353 | $429,959 |
| Expenditures | Year 1 | Year 2 | Year 3 |
| Expenditures from Operations | |||
| Cash Spending | $63,252 | $98,000 | $145,250 |
| Bill Payments | $36,627 | $112,674 | $168,911 |
| Subtotal Spent on Operations | $99,879 | $210,674 | $314,161 |
| Additional Cash Spent | |||
| Sales Tax, VAT, HST/GST Paid Out | $0 | $0 | $0 |
| Principal Repayment of Current Borrowing | $6,150 | $7,000 | $8,000 |
| Other Liabilities Principal Repayment | $0 | $0 | $0 |
| Long-term Liabilities Principal Repayment | $0 | $0 | $0 |
| Purchase Other Current Assets | $0 | $0 | $0 |
| Purchase Long-term Assets | $0 | $0 | $0 |
| Dividends | $0 | $0 | $0 |
| Subtotal Cash Spent | $106,029 | $217,674 | $322,161 |
| Net Cash Flow | $10,295 | $16,679 | $107,798 |
| Cash Balance | $21,295 | $37,973 | $145,771 |
7.6 Projected Balance Sheet
The projected balance sheet follows.
| Pro Forma Balance Sheet | |||
| Year 1 | Year 2 | Year 3 | |
| Assets | |||
| Current Assets | |||
| Cash | $21,295 | $37,973 | $145,771 |
| Accounts Receivable | $26,616 | $83,366 | $139,090 |
| Other Current Assets | $0 | $0 | $0 |
| Total Current Assets | $47,911 | $121,340 | $284,861 |
| Long-term Assets | |||
| Long-term Assets | $0 | $0 | $0 |
| Accumulated Depreciation | $1,020 | $2,040 | $3,060 |
| Total Long-term Assets | ($1,020) | ($2,040) | ($3,060) |
| Total Assets | $46,891 | $119,300 | $281,801 |
| Liabilities and Capital | Year 1 | Year 2 | Year 3 |
| Current Liabilities | |||
| Accounts Payable | $4,670 | $9,672 | $14,260 |
| Current Borrowing | $43,850 | $36,850 | $28,850 |
| Other Current Liabilities | $0 | $0 | $0 |
| Subtotal Current Liabilities | $48,520 | $46,522 | $43,110 |
| Long-term Liabilities | $0 | $0 | $0 |
| Total Liabilities | $48,520 | $46,522 | $43,110 |
| Paid-in Capital | $31,428 | $31,428 | $31,428 |
| Retained Earnings | ($20,428) | ($33,057) | $41,350 |
| Earnings | ($12,629) | $74,406 | $165,913 |
| Total Capital | ($1,629) | $72,778 | $238,691 |
| Total Liabilities and Capital | $46,891 | $119,300 | $281,801 |
| Net Worth | ($1,629) | $72,778 | $238,691 |
7.7 Business Ratios
Table of business ratios follows. A comparison of Industry standard ratios is provided based on Standard Industrial Classification code, 8741, Management Services.
| Ratio Analysis | ||||
| Year 1 | Year 2 | Year 3 | Industry Profile | |
| Sales Growth | 0.00% | 213.22% | 66.84% | 8.50% |
| Percent of Total Assets | ||||
| Accounts Receivable | 56.76% | 69.88% | 49.36% | 25.80% |
| Other Current Assets | 0.00% | 0.00% | 0.00% | 46.60% |
| Total Current Assets | 102.18% | 101.71% | 101.09% | 76.40% |
| Long-term Assets | -2.18% | -1.71% | -1.09% | 23.60% |
| Total Assets | 100.00% | 100.00% | 100.00% | 100.00% |
| Current Liabilities | 103.47% | 39.00% | 15.30% | 44.00% |
| Long-term Liabilities | 0.00% | 0.00% | 0.00% | 17.30% |
| Total Liabilities | 103.47% | 39.00% | 15.30% | 61.30% |
| Net Worth | -3.47% | 61.00% | 84.70% | 38.70% |
| Percent of Sales | ||||
| Sales | 100.00% | 100.00% | 100.00% | 100.00% |
| Gross Margin | 86.51% | 83.65% | 83.00% | 0.00% |
| Selling, General & Administrative Expenses | 100.10% | 58.17% | 48.80% | 82.30% |
| Advertising Expenses | 1.29% | 0.41% | 0.25% | 1.30% |
| Profit Before Interest and Taxes | -9.40% | 35.33% | 46.41% | 2.40% |
| Main Ratios | ||||
| Current | 0.99 | 2.61 | 6.61 | 1.56 |
| Quick | 0.99 | 2.61 | 6.61 | 1.21 |
| Total Debt to Total Assets | 103.47% | 39.00% | 15.30% | 61.30% |
| Pre-tax Return on Net Worth | 775.34% | 136.32% | 93.20% | 3.90% |
| Pre-tax Return on Assets | -26.93% | 83.16% | 78.94% | 10.20% |
| Additional Ratios | Year 1 | Year 2 | Year 3 | |
| Net Profit Margin | -13.59% | 25.56% | 34.16% | n.a |
| Return on Equity | 0.00% | 102.24% | 69.51% | n.a |
| Activity Ratios | ||||
| Accounts Receivable Turnover | 3.49 | 3.49 | 3.49 | n.a |
| Collection Days | 56 | 69 | 84 | n.a |
| Accounts Payable Turnover | 8.84 | 12.17 | 12.17 | n.a |
| Payment Days | 27 | 22 | 25 | n.a |
| Total Asset Turnover | 1.98 | 2.44 | 1.72 | n.a |
| Debt Ratios | ||||
| Debt to Net Worth | 0.00 | 0.64 | 0.18 | n.a |
| Current Liab. to Liab. | 1.00 | 1.00 | 1.00 | n.a |
| Liquidity Ratios | ||||
| Net Working Capital | ($609) | $74,818 | $241,751 | n.a |
| Interest Coverage | -2.24 | 28.32 | 76.24 | n.a |
| Additional Ratios | ||||
| Assets to Sales | 0.50 | 0.41 | 0.58 | n.a |
| Current Debt/Total Assets | 103% | 39% | 15% | n.a |
| Acid Test | 0.44 | 0.82 | 3.38 | n.a |
| Sales/Net Worth | 0.00 | 4.00 | 2.03 | n.a |
| Dividend Payout | 0.00 | 0.00 | 0.00 | n.a |
Appendix
| Sales Forecast | |||||||||||||
| Month 1 | Month 2 | Month 3 | Month 4 | Month 5 | Month 6 | Month 7 | Month 8 | Month 9 | Month 10 | Month 11 | Month 12 | ||
| Unit Sales | |||||||||||||
| COBRA/HIPAA | 0% | 0 | 0 | 0 | 20 | 25 | 30 | 35 | 40 | 45 | 50 | 55 | 60 |
| Flexible Spending | 0% | 0 | 0 | 0 | 10 | 10 | 10 | 10 | 10 | 10 | 40 | 40 | 40 |
| Basic Admin | 0% | 0 | 0 | 0 | 100 | 100 | 100 | 200 | 200 | 200 | 400 | 400 | 400 |
| All Inclusive | 0% | 0 | 0 | 0 | 100 | 100 | 100 | 200 | 200 | 200 | 400 | 400 | 400 |
| Start-up Fees | 0% | 0 | 0 | 0 | 65 | 5 | 5 | 45 | 5 | 5 | 100 | 5 | 5 |
| Total Unit Sales | 0 | 0 | 0 | 295 | 240 | 245 | 490 | 455 | 460 | 990 | 900 | 905 | |
| Unit Prices | Month 1 | Month 2 | Month 3 | Month 4 | Month 5 | Month 6 | Month 7 | Month 8 | Month 9 | Month 10 | Month 11 | Month 12 | |
| COBRA/HIPAA | $12.75 | $12.75 | $12.75 | $12.75 | $12.75 | $12.75 | $12.75 | $12.75 | $12.75 | $12.75 | $12.75 | $12.75 | |
| Flexible Spending | $7.50 | $7.50 | $7.50 | $7.50 | $7.50 | $7.50 | $7.50 | $7.50 | $7.50 | $7.50 | $7.50 | $7.50 | |
| Basic Admin | $12.00 | $12.00 | $12.00 | $12.00 | $12.00 | $12.00 | $12.00 | $12.00 | $12.00 | $12.00 | $12.00 | $12.00 | |
| All Inclusive | $18.00 | $18.00 | $18.00 | $18.00 | $18.00 | $18.00 | $18.00 | $18.00 | $18.00 | $18.00 | $18.00 | $18.00 | |
| Start-up Fees | $100.00 | $100.00 | $100.00 | $100.00 | $100.00 | $100.00 | $100.00 | $100.00 | $100.00 | $100.00 | $100.00 | $100.00 | |
| Sales | |||||||||||||
| COBRA/HIPAA | $0 | $0 | $0 | $255 | $319 | $383 | $446 | $510 | $574 | $638 | $701 | $765 | |
| Flexible Spending | $0 | $0 | $0 | $75 | $75 | $75 | $75 | $75 | $75 | $300 | $300 | $300 | |
| Basic Admin | $0 | $0 | $0 | $1,200 | $1,200 | $1,200 | $2,400 | $2,400 | $2,400 | $4,800 | $4,800 | $4,800 | |
| All Inclusive | $0 | $0 | $0 | $1,800 | $1,800 | $1,800 | $3,600 | $3,600 | $3,600 | $7,200 | $7,200 | $7,200 | |
| Start-up Fees | $0 | $0 | $0 | $6,500 | $500 | $500 | $4,500 | $500 | $500 | $10,000 | $500 | $500 | |
| Total Sales | $0 | $0 | $0 | $9,830 | $3,894 | $3,958 | $11,021 | $7,085 | $7,149 | $22,938 | $13,501 | $13,565 | |
| Direct Unit Costs | Month 1 | Month 2 | Month 3 | Month 4 | Month 5 | Month 6 | Month 7 | Month 8 | Month 9 | Month 10 | Month 11 | Month 12 | |
| COBRA/HIPAA | 0.00% | $2.75 | $2.75 | $2.75 | $2.75 | $2.75 | $2.75 | $2.75 | $2.75 | $2.75 | $2.75 | $2.75 | $2.75 |
| Flexible Spending | 0.00% | $0.00 | $0.00 | $0.00 | $0.00 | $0.00 | $0.00 | $0.00 | $0.00 | $0.00 | $0.00 | $0.00 | $0.00 |
| Basic Admin | 0.00% | $2.75 | $2.75 | $2.75 | $2.75 | $2.75 | $2.75 | $2.75 | $2.75 | $2.75 | $2.75 | $2.75 | $2.75 |
| All Inclusive | 0.00% | $2.75 | $2.75 | $2.75 | $2.75 | $2.75 | $2.75 | $2.75 | $2.75 | $2.75 | $2.75 | $2.75 | $2.75 |
| Start-up Fees | 0.00% | $2.75 | $0.00 | $0.00 | $0.00 | $0.00 | $0.00 | $0.00 | $0.00 | $0.00 | $0.00 | $0.00 | $0.00 |
| Direct Cost of Sales | |||||||||||||
| COBRA/HIPAA | $0 | $0 | $0 | $55 | $69 | $83 | $96 | $110 | $124 | $138 | $151 | $165 | |
| Flexible Spending | $0 | $0 | $0 | $0 | $0 | $0 | $0 | $0 | $0 | $0 | $0 | $0 | |
| Basic Admin | $0 | $0 | $0 | $275 | $275 | $275 | $550 | $550 | $550 | $1,100 | $1,100 | $1,100 | |
| All Inclusive | $0 | $0 | $0 | $275 | $275 | $275 | $550 | $550 | $550 | $1,100 | $1,100 | $1,100 | |
| Start-up Fees | $0 | $0 | $0 | $0 | $0 | $0 | $0 | $0 | $0 | $0 | $0 | $0 | |
| Subtotal Direct Cost of Sales | $0 | $0 | $0 | $605 | $619 | $633 | $1,196 | $1,210 | $1,224 | $2,338 | $2,351 | $2,365 | |
| Personnel Plan | |||||||||||||
| Month 1 | Month 2 | Month 3 | Month 4 | Month 5 | Month 6 | Month 7 | Month 8 | Month 9 | Month 10 | Month 11 | Month 12 | ||
| Production Personnel | |||||||||||||
| Name or title | $0 | $0 | $0 | $0 | $0 | $0 | $0 | $0 | $0 | $0 | $0 | $0 | |
| Name or title | $0 | $0 | $0 | $0 | $0 | $0 | $0 | $0 | $0 | $0 | $0 | $0 | |
| Name or title | $0 | $0 | $0 | $0 | $0 | $0 | $0 | $0 | $0 | $0 | $0 | $0 | |
| Other | $0 | $0 | $0 | $0 | $0 | $0 | $0 | $0 | $0 | $0 | $0 | $0 | |
| Subtotal | $0 | $0 | $0 | $0 | $0 | $0 | $0 | $0 | $0 | $0 | $0 | $0 | |
| Sales and Marketing Personnel | |||||||||||||
| Marketer Part Time | $0 | $0 | $0 | $0 | $0 | $0 | $0 | $0 | $0 | $0 | $0 | $0 | |
| Name or title | $0 | $0 | $0 | $0 | $0 | $0 | $0 | $0 | $0 | $0 | $0 | $0 | |
| Name or title | $0 | $0 | $0 | $0 | $0 | $0 | $0 | $0 | $0 | $0 | $0 | $0 | |
| Other | $0 | $0 | $0 | $0 | $0 | $0 | $0 | $0 | $0 | $0 | $0 | $0 | |
| Subtotal | $0 | $0 | $0 | $0 | $0 | $0 | $0 | $0 | $0 | $0 | $0 | $0 | |
| General and Administrative Personnel | |||||||||||||
| Cindy Wells | $2,500 | $2,500 | $2,500 | $2,500 | $2,500 | $2,500 | $2,500 | $2,500 | $2,500 | $2,500 | $2,500 | $2,500 | |
| Diane Davis | $2,500 | $2,500 | $2,500 | $2,500 | $2,500 | $2,500 | $2,500 | $2,500 | $2,500 | $2,500 | $2,500 | $2,500 | |
| Administrative Assistant Part Time | $0 | $0 | $0 | $0 | $0 | $0 | $0 | $0 | $0 | $1,084 | $1,084 | $1,084 | |
| Benefits Administrator | $0 | $0 | $0 | $0 | $0 | $0 | $0 | $0 | $0 | $0 | $0 | $0 | |
| Receptionist Part Time | $0 | $0 | $0 | $0 | $0 | $0 | $0 | $0 | $0 | $0 | $0 | $0 | |
| Benefits Administrator | $0 | $0 | $0 | $0 | $0 | $0 | $0 | $0 | $0 | $0 | $0 | $0 | |
| Subtotal | $5,000 | $5,000 | $5,000 | $5,000 | $5,000 | $5,000 | $5,000 | $5,000 | $5,000 | $6,084 | $6,084 | $6,084 | |
| Other Personnel | |||||||||||||
| Name or title | $0 | $0 | $0 | $0 | $0 | $0 | $0 | $0 | $0 | $0 | $0 | $0 | |
| Name or title | $0 | $0 | $0 | $0 | $0 | $0 | $0 | $0 | $0 | $0 | $0 | $0 | |
| Name or title | $0 | $0 | $0 | $0 | $0 | $0 | $0 | $0 | $0 | $0 | $0 | $0 | |
| Other | $0 | $0 | $0 | $0 | $0 | $0 | $0 | $0 | $0 | $0 | $0 | $0 | |
| Subtotal | $0 | $0 | $0 | $0 | $0 | $0 | $0 | $0 | $0 | $0 | $0 | $0 | |
| Total People | 2 | 2 | 2 | 2 | 2 | 2 | 2 | 2 | 2 | 3 | 3 | 3 | |
| Total Payroll | $5,000 | $5,000 | $5,000 | $5,000 | $5,000 | $5,000 | $5,000 | $5,000 | $5,000 | $6,084 | $6,084 | $6,084 | |
| General Assumptions | |||||||||||||
| Month 1 | Month 2 | Month 3 | Month 4 | Month 5 | Month 6 | Month 7 | Month 8 | Month 9 | Month 10 | Month 11 | Month 12 | ||
| Plan Month | 1 | 2 | 3 | 4 | 5 | 6 | 7 | 8 | 9 | 10 | 11 | 12 | |
| Current Interest Rate | 9.00% | 9.00% | 9.00% | 9.00% | 9.00% | 9.00% | 9.00% | 9.00% | 9.00% | 9.00% | 9.00% | 9.00% | |
| Long-term Interest Rate | 8.00% | 8.00% | 8.00% | 8.00% | 8.00% | 8.00% | 8.00% | 8.00% | 8.00% | 8.00% | 8.00% | 8.00% | |
| Tax Rate | 30.00% | 25.00% | 25.00% | 25.00% | 25.00% | 25.00% | 25.00% | 25.00% | 25.00% | 25.00% | 25.00% | 25.00% | |
| Other | 0 | 0 | 0 | 0 | 0 | 0 | 0 | 0 | 0 | 0 | 0 | 0 | |
| Pro Forma Profit and Loss | |||||||||||||
| Month 1 | Month 2 | Month 3 | Month 4 | Month 5 | Month 6 | Month 7 | Month 8 | Month 9 | Month 10 | Month 11 | Month 12 | ||
| Sales | $0 | $0 | $0 | $9,830 | $3,894 | $3,958 | $11,021 | $7,085 | $7,149 | $22,938 | $13,501 | $13,565 | |
| Direct Cost of Sales | $0 | $0 | $0 | $605 | $619 | $633 | $1,196 | $1,210 | $1,224 | $2,338 | $2,351 | $2,365 | |
| Production Payroll | $0 | $0 | $0 | $0 | $0 | $0 | $0 | $0 | $0 | $0 | $0 | $0 | |
| Other | $0 | $0 | $0 | $0 | $0 | $0 | $0 | $0 | $0 | $0 | $0 | $0 | |
| Total Cost of Sales | $0 | $0 | $0 | $605 | $619 | $633 | $1,196 | $1,210 | $1,224 | $2,338 | $2,351 | $2,365 | |
| Gross Margin | $0 | $0 | $0 | $9,225 | $3,275 | $3,325 | $9,825 | $5,875 | $5,925 | $20,600 | $11,150 | $11,200 | |
| Gross Margin % | 0.00% | 0.00% | 0.00% | 93.85% | 84.11% | 84.02% | 89.15% | 82.92% | 82.88% | 89.81% | 82.58% | 82.57% | |
| Operating Expenses | |||||||||||||
| Sales and Marketing Expenses | |||||||||||||
| Sales and Marketing Payroll | $0 | $0 | $0 | $0 | $0 | $0 | $0 | $0 | $0 | $0 | $0 | $0 | |
| Advertising/Promotion | $100 | $100 | $100 | $100 | $100 | $100 | $100 | $100 | $100 | $100 | $100 | $100 | |
| Travel | $0 | $0 | $0 | $0 | $0 | $0 | $0 | $0 | $0 | $0 | $0 | $0 | |
| Miscellaneous | $50 | $50 | $50 | $50 | $50 | $50 | $50 | $50 | $50 | $50 | $50 | $50 | |
| Total Sales and Marketing Expenses | $150 | $150 | $150 | $150 | $150 | $150 | $150 | $150 | $150 | $150 | $150 | $150 | |
| Sales and Marketing % | 0.00% | 0.00% | 0.00% | 1.53% | 3.85% | 3.79% | 1.36% | 2.12% | 2.10% | 0.65% | 1.11% | 1.11% | |
| General and Administrative Expenses | |||||||||||||
| General and Administrative Payroll | $5,000 | $5,000 | $5,000 | $5,000 | $5,000 | $5,000 | $5,000 | $5,000 | $5,000 | $6,084 | $6,084 | $6,084 | |
| Sales and Marketing and Other Expenses | $0 | $0 | $0 | $0 | $0 | $0 | $0 | $0 | $0 | $0 | $0 | $0 | |
| Depreciation | $85 | $85 | $85 | $85 | $85 | $85 | $85 | $85 | $85 | $85 | $85 | $85 | |
| Dues and Subscriptions | $150 | $150 | $150 | $150 | $150 | $150 | $150 | $150 | $150 | $150 | $150 | $150 | |
| Professional Fees | $50 | $50 | $50 | $50 | $50 | $50 | $50 | $50 | $50 | $50 | $50 | $50 | |
| Rent | $600 | $600 | $600 | $600 | $600 | $600 | $600 | $600 | $600 | $600 | $600 | $600 | |
| Software Purchases | $0 | $0 | $0 | $0 | $0 | $0 | $0 | $0 | $0 | $0 | $0 | $0 | |
| Insurance | $100 | $100 | $100 | $100 | $100 | $100 | $100 | $100 | $100 | $100 | $100 | $100 | |
| Telephone and Internet Access | $200 | $200 | $200 | $200 | $200 | $200 | $200 | $200 | $200 | $200 | $200 | $200 | |
| Utilities | $200 | $200 | $200 | $200 | $200 | $200 | $200 | $200 | $200 | $200 | $200 | $200 | |
| Miscellaneous | $200 | $200 | $200 | $200 | $200 | $200 | $200 | $200 | $200 | $200 | $200 | $200 | |
| Payroll Taxes | 8% | $400 | $400 | $400 | $400 | $400 | $400 | $400 | $400 | $400 | $487 | $487 | $487 |
| Other General and Administrative Expenses | $0 | $0 | $0 | $0 | $0 | $0 | $0 | $0 | $0 | $0 | $0 | $0 | |
| Total General and Administrative Expenses | $6,985 | $6,985 | $6,985 | $6,985 | $6,985 | $6,985 | $6,985 | $6,985 | $6,985 | $8,156 | $8,156 | $8,156 | |
| General and Administrative % | 0.00% | 0.00% | 0.00% | 71.06% | 179.39% | 176.50% | 63.38% | 98.59% | 97.71% | 35.56% | 60.41% | 60.12% | |
| Other Expenses: | |||||||||||||
| Other Payroll | $0 | $0 | $0 | $0 | $0 | $0 | $0 | $0 | $0 | $0 | $0 | $0 | |
| Consultants | $0 | $0 | $0 | $0 | $0 | $0 | $0 | $0 | $0 | $0 | $0 | $0 | |
| Contract/Consultants | $0 | $0 | $0 | $0 | $0 | $0 | $0 | $0 | $0 | $0 | $0 | $0 | |
| Total Other Expenses | $0 | $0 | $0 | $0 | $0 | $0 | $0 | $0 | $0 | $0 | $0 | $0 | |
| Other % | 0.00% | 0.00% | 0.00% | 0.00% | 0.00% | 0.00% | 0.00% | 0.00% | 0.00% | 0.00% | 0.00% | 0.00% | |
| Total Operating Expenses | $7,135 | $7,135 | $7,135 | $7,135 | $7,135 | $7,135 | $7,135 | $7,135 | $7,135 | $8,306 | $8,306 | $8,306 | |
| Profit Before Interest and Taxes | ($7,135) | ($7,135) | ($7,135) | $2,090 | ($3,860) | ($3,810) | $2,690 | ($1,260) | ($1,210) | $12,294 | $2,844 | $2,894 | |
| EBITDA | ($7,050) | ($7,050) | ($7,050) | $2,175 | ($3,775) | ($3,725) | $2,775 | ($1,175) | ($1,125) | $12,379 | $2,929 | $2,979 | |
| Interest Expense | $0 | $375 | $375 | $370 | $365 | $360 | $355 | $350 | $345 | $339 | $334 | $329 | |
| Taxes Incurred | $0 | $0 | $0 | $0 | $0 | $0 | $0 | $0 | $0 | $0 | $0 | $0 | |
| Net Profit | ($7,135) | ($7,510) | ($7,510) | $1,720 | ($4,225) | ($4,170) | $2,335 | ($1,610) | ($1,555) | $11,955 | $2,510 | $2,565 | |
| Net Profit/Sales | 0.00% | 0.00% | 0.00% | 17.50% | -108.51% | -105.37% | 21.19% | -22.72% | -21.75% | 52.12% | 18.59% | 18.91% | |
| Pro Forma Cash Flow | |||||||||||||
| Month 1 | Month 2 | Month 3 | Month 4 | Month 5 | Month 6 | Month 7 | Month 8 | Month 9 | Month 10 | Month 11 | Month 12 | ||
| Cash Received | |||||||||||||
| Cash from Operations | |||||||||||||
| Cash Sales | $0 | $0 | $0 | $0 | $0 | $0 | $0 | $0 | $0 | $0 | $0 | $0 | |
| Cash from Receivables | $0 | $0 | $0 | $0 | $328 | $9,632 | $3,896 | $4,193 | $10,890 | $7,087 | $7,675 | $22,623 | |
| Subtotal Cash from Operations | $0 | $0 | $0 | $0 | $328 | $9,632 | $3,896 | $4,193 | $10,890 | $7,087 | $7,675 | $22,623 | |
| Additional Cash Received | |||||||||||||
| Sales Tax, VAT, HST/GST Received | 0.00% | $0 | $0 | $0 | $0 | $0 | $0 | $0 | $0 | $0 | $0 | $0 | $0 |
| New Current Borrowing | $0 | $50,000 | $0 | $0 | $0 | $0 | $0 | $0 | $0 | $0 | $0 | $0 | |
| New Other Liabilities (interest-free) | $0 | $0 | $0 | $0 | $0 | $0 | $0 | $0 | $0 | $0 | $0 | $0 | |
| New Long-term Liabilities | $0 | $0 | $0 | $0 | $0 | $0 | $0 | $0 | $0 | $0 | $0 | $0 | |
| Sales of Other Current Assets | $0 | $0 | $0 | $0 | $0 | $0 | $0 | $0 | $0 | $0 | $0 | $0 | |
| Sales of Long-term Assets | $0 | $0 | $0 | $0 | $0 | $0 | $0 | $0 | $0 | $0 | $0 | $0 | |
| New Investment Received | $0 | $0 | $0 | $0 | $0 | $0 | $0 | $0 | $0 | $0 | $0 | $0 | |
| Subtotal Cash Received | $0 | $50,000 | $0 | $0 | $328 | $9,632 | $3,896 | $4,193 | $10,890 | $7,087 | $7,675 | $22,623 | |
| Expenditures | Month 1 | Month 2 | Month 3 | Month 4 | Month 5 | Month 6 | Month 7 | Month 8 | Month 9 | Month 10 | Month 11 | Month 12 | |
| Expenditures from Operations | |||||||||||||
| Cash Spending | $5,000 | $5,000 | $5,000 | $5,000 | $5,000 | $5,000 | $5,000 | $5,000 | $5,000 | $6,084 | $6,084 | $6,084 | |
| Bill Payments | $68 | $2,063 | $2,425 | $2,445 | $3,025 | $3,034 | $3,061 | $3,601 | $3,610 | $3,658 | $4,814 | $4,822 | |
| Subtotal Spent on Operations | $5,068 | $7,063 | $7,425 | $7,445 | $8,025 | $8,034 | $8,061 | $8,601 | $8,610 | $9,742 | $10,898 | $10,906 | |
| Additional Cash Spent | |||||||||||||
| Sales Tax, VAT, HST/GST Paid Out | $0 | $0 | $0 | $0 | $0 | $0 | $0 | $0 | $0 | $0 | $0 | $0 | |
| Principal Repayment of Current Borrowing | $0 | $0 | $0 | $663 | $669 | $673 | $678 | $683 | $688 | $693 | $699 | $704 | |
| Other Liabilities Principal Repayment | $0 | $0 | $0 | $0 | $0 | $0 | $0 | $0 | $0 | $0 | $0 | $0 | |
| Long-term Liabilities Principal Repayment | $0 | $0 | $0 | $0 | $0 | $0 | $0 | $0 | $0 | $0 | $0 | $0 | |
| Purchase Other Current Assets | $0 | $0 | $0 | $0 | $0 | $0 | $0 | $0 | $0 | $0 | $0 | $0 | |
| Purchase Long-term Assets | $0 | $0 | $0 | $0 | $0 | $0 | $0 | $0 | $0 | $0 | $0 | $0 | |
| Dividends | $0 | $0 | $0 | $0 | $0 | $0 | $0 | $0 | $0 | $0 | $0 | $0 | |
| Subtotal Cash Spent | $5,068 | $7,063 | $7,425 | $8,108 | $8,694 | $8,707 | $8,739 | $9,284 | $9,298 | $10,435 | $11,597 | $11,610 | |
| Net Cash Flow | ($5,068) | $42,938 | ($7,425) | ($8,108) | ($8,367) | $925 | ($4,843) | ($5,091) | $1,592 | ($3,348) | ($3,922) | $11,013 | |
| Cash Balance | $5,932 | $48,869 | $41,444 | $33,336 | $24,970 | $25,895 | $21,051 | $15,960 | $17,552 | $14,204 | $10,282 | $21,295 | |
| Pro Forma Balance Sheet | |||||||||||||
| Month 1 | Month 2 | Month 3 | Month 4 | Month 5 | Month 6 | Month 7 | Month 8 | Month 9 | Month 10 | Month 11 | Month 12 | ||
| Assets | Starting Balances | ||||||||||||
| Current Assets | |||||||||||||
| Cash | $11,000 | $5,932 | $48,869 | $41,444 | $33,336 | $24,970 | $25,895 | $21,051 | $15,960 | $17,552 | $14,204 | $10,282 | $21,295 |
| Accounts Receivable | $0 | $0 | $0 | $0 | $9,830 | $13,396 | $7,721 | $14,847 | $17,739 | $13,998 | $29,848 | $35,674 | $26,616 |
| Other Current Assets | $0 | $0 | $0 | $0 | $0 | $0 | $0 | $0 | $0 | $0 | $0 | $0 | $0 |
| Total Current Assets | $11,000 | $5,932 | $48,869 | $41,444 | $43,166 | $38,366 | $33,616 | $35,898 | $33,699 | $31,550 | $44,052 | $45,956 | $47,911 |
| Long-term Assets | |||||||||||||
| Long-term Assets | $0 | $0 | $0 | $0 | $0 | $0 | $0 | $0 | $0 | $0 | $0 | $0 | $0 |
| Accumulated Depreciation | $0 | $85 | $170 | $255 | $340 | $425 | $510 | $595 | $680 | $765 | $850 | $935 | $1,020 |
| Total Long-term Assets | $0 | ($85) | ($170) | ($255) | ($340) | ($425) | ($510) | ($595) | ($680) | ($765) | ($850) | ($935) | ($1,020) |
| Total Assets | $11,000 | $5,847 | $48,699 | $41,189 | $42,826 | $37,941 | $33,106 | $35,303 | $33,019 | $30,785 | $43,202 | $45,021 | $46,891 |
| Liabilities and Capital | Month 1 | Month 2 | Month 3 | Month 4 | Month 5 | Month 6 | Month 7 | Month 8 | Month 9 | Month 10 | Month 11 | Month 12 | |
| Current Liabilities | |||||||||||||
| Accounts Payable | $0 | $1,982 | $2,344 | $2,344 | $2,924 | $2,933 | $2,941 | $3,481 | $3,489 | $3,498 | $4,653 | $4,661 | $4,670 |
| Current Borrowing | $0 | $0 | $50,000 | $50,000 | $49,337 | $48,668 | $47,995 | $47,317 | $46,634 | $45,946 | $45,253 | $44,554 | $43,850 |
| Other Current Liabilities | $0 | $0 | $0 | $0 | $0 | $0 | $0 | $0 | $0 | $0 | $0 | $0 | $0 |
| Subtotal Current Liabilities | $0 | $1,982 | $52,344 | $52,344 | $52,261 | $51,601 | $50,936 | $50,798 | $50,123 | $49,444 | $49,906 | $49,215 | $48,520 |
| Long-term Liabilities | $0 | $0 | $0 | $0 | $0 | $0 | $0 | $0 | $0 | $0 | $0 | $0 | $0 |
| Total Liabilities | $0 | $1,982 | $52,344 | $52,344 | $52,261 | $51,601 | $50,936 | $50,798 | $50,123 | $49,444 | $49,906 | $49,215 | $48,520 |
| Paid-in Capital | $31,428 | $31,428 | $31,428 | $31,428 | $31,428 | $31,428 | $31,428 | $31,428 | $31,428 | $31,428 | $31,428 | $31,428 | $31,428 |
| Retained Earnings | ($20,428) | ($20,428) | ($20,428) | ($20,428) | ($20,428) | ($20,428) | ($20,428) | ($20,428) | ($20,428) | ($20,428) | ($20,428) | ($20,428) | ($20,428) |
| Earnings | $0 | ($7,135) | ($14,645) | ($22,155) | ($20,435) | ($24,660) | ($28,830) | ($26,495) | ($28,105) | ($29,659) | ($17,704) | ($15,194) | ($12,629) |
| Total Capital | $11,000 | $3,865 | ($3,645) | ($11,155) | ($9,435) | ($13,660) | ($17,830) | ($15,495) | ($17,105) | ($18,659) | ($6,704) | ($4,194) | ($1,629) |
| Total Liabilities and Capital | $11,000 | $5,847 | $48,699 | $41,189 | $42,826 | $37,941 | $33,106 | $35,303 | $33,019 | $30,785 | $43,202 | $45,021 | $46,891 |
| Net Worth | $11,000 | $3,865 | ($3,645) | ($11,155) | ($9,435) | ($13,660) | ($17,830) | ($15,495) | ($17,105) | ($18,659) | ($6,704) | ($4,194) | ($1,629) |


