
Magnolia Inn
Executive Summary
The Magnolia Inn is a beautiful facility that sits atop a bluff overlooking the Pacific Ocean in scenic Half Moon Bay California. The Inn offers seven individually furnished rooms, each with its own antique theme. We are a complete bed and breakfast Inn with a full complementary breakfast served each morning to our guests. Magnolia’s target market strategy is based on becoming a destination of choice for professional couples in the greater San Francisco Bay area who are looking for a place to relax and recharge. We will also advertise to the newly married couple who is looking for that special get away. It will be important for us to be visible to those potential guests who are traveling on Highway 101 through Half Moon Bay.
The Magnolia will have an eye catching sign that will alert potential customers and drop-ins of our existence. We will use the Yellow Pages in the Bay area to market our Inn, as well as a Web page on the Internet which will focus on the features the Inn has to offer. Each room will be displayed with its unique decor, as well the outside of the Inn showing the beautiful gardens and views of the Pacific Ocean. Attractions within 30 miles of the Inn will be displayed with information about our shuttle service, room rates and directions. The Magnolia is confident that it will not take long to build a following that will put us at full capacity within the next year. The Inn would like to see steady growth with a average of over 90% capacity for Year 1, with profits also growing at a rate of 10%.
Jim and Nancy Anderson are the sole owners of the Magnolia and live at the Inn year around. The Andersons are hands-on owners who oversee every aspect of the Inn’s operations. A small staff consisting of a cook and a maid will work at the Inn. The cook will work 20 hours per week and the maid will be on the payroll 40 hours per week as she will also help Nancy take reservations and watch the front desk when needed. Nancy will oversee the inside operations working with the maid and cook as well as taking reservations. Jim will oversee the maintenance of the Inn and grounds and drive the van to shuttle guests when the need arises. Both Jim and Nancy will promote the Inn and oversee the advertising.

1.1 Mission
The Magnolia Inn intends to provide a serene setting for our guests to enjoy the many splendors of the beautiful California coast. Each guest will be treated with the kind of attention that is reserved for family. When our guests arrive we want them to leave their troubles at the door and step into a world of luxury and rest. As owners we intend to see that attention to detail and service will be followed by a staff dedicated to each guest.
1.2 Keys to Success
The primary keys to success for the Inn will be based on the following factors:
- Provide a facility that is first class with attention to detail.
- Give each guest a sense that he or she is our top priority.
- Provide quality meals.
- Retain our guests to ensure repeat bookings and referrals.
1.3 Objectives
- Generate a customer satisfaction rate above 90%.
- Generate an average of $26,000 of sales each month.
- Stay above 90% occupancy each month.
Company Summary
The Magnolia Inn is a beautiful facility that sits atop a bluff over looking the Pacific Ocean in scenic Half Moon Bay California. We are a new start-up enterprise that will offer seven wonderfully furnished rooms to guests who want to get away from the ordinary. Each room is individually furnished with antiques and there is a large deck with a hot tub overlooking the ocean. The Magnolia will provide a full breakfast each morning to our guests with no expense spared. Our target market is the professional couple who lives in the San Francisco area, or people looking for a place to honeymoon.
2.1 Company Ownership
The Magnolia Inn is owned and operated solely by Jim and Nancy Anderson. Jim and Nancy have refurbished a beautiful victorian home to accommodate 14 guests at a time in seven rooms. This is a start-up enterprise for the Andersons who are equal owners in the business. Jim and Nancy purchased the property a little over a year ago and have worked this past year preparing to open the Inn.
2.2 Start-up Summary
The start-up costs will come to $38,000 (including cash required at start-up) which will be primarily financed by Jim and Nancy Anderson. Joe Anderson, Jim’s father has contributed $15,000 into the enterprise. The costs of improvements to the building totaled $30,000. Jim and Nancy purchased the property a year ago with the intent of renovating and opening the business.

| Start-up | |
| Requirements | |
| Start-up Expenses | |
| Legal | $500 |
| Stationery etc. | $500 |
| Insurance | $500 |
| Improvements to Inn | $30,000 |
| Flowers | $500 |
| Total Start-up Expenses | $32,000 |
| Start-up Assets | |
| Cash Required | $6,000 |
| Other Current Assets | $10,000 |
| Long-term Assets | $370,000 |
| Total Assets | $386,000 |
| Total Requirements | $418,000 |
| Start-up Funding | |
| Start-up Expenses to Fund | $32,000 |
| Start-up Assets to Fund | $386,000 |
| Total Funding Required | $418,000 |
| Assets | |
| Non-cash Assets from Start-up | $380,000 |
| Cash Requirements from Start-up | $6,000 |
| Additional Cash Raised | $0 |
| Cash Balance on Starting Date | $6,000 |
| Total Assets | $386,000 |
| Liabilities and Capital | |
| Liabilities | |
| Current Borrowing | $0 |
| Long-term Liabilities | $353,000 |
| Accounts Payable (Outstanding Bills) | $0 |
| Other Current Liabilities (interest-free) | $0 |
| Total Liabilities | $353,000 |
| Capital | |
| Planned Investment | |
| Jim & Nancy Anderson | $50,000 |
| Joe Anderson | $15,000 |
| Additional Investment Requirement | $0 |
| Total Planned Investment | $65,000 |
| Loss at Start-up (Start-up Expenses) | ($32,000) |
| Total Capital | $33,000 |
| Total Capital and Liabilities | $386,000 |
| Total Funding | $418,000 |
Services
The Magnolia Inn provides four-star lodging on the beautiful central California coast. We are a complete bed and breakfast Inn with a full complementary breakfast served each morning. Seven impeccable rooms, each with its own theme are ready to embrace the individual who is looking for solitude, or the more adventurish person who likes to be active. We offer van trips to various locations of interest if guests are interested.
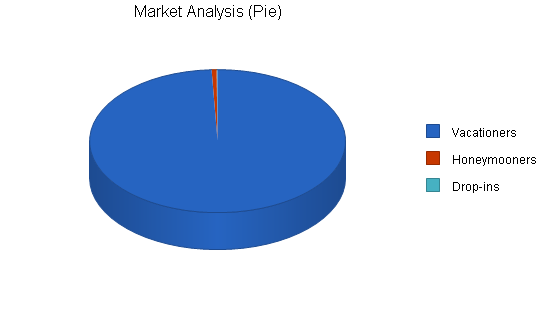
Market Analysis Summary
The Magnolia Inn’s target market strategy is based on becoming a destination choice for people in the greater San Francisco Bay region who are looking for a place to relax and recharge. The target markets that we are going to pursue are people looking for a vacation destination, Honeymooners, and drop-in customers. We envision many professional married and single customers making the short drive to Half Moon Bay from the greater Bay area to relax and enjoy the beautiful California coast. Our setting and facility is a natural for people looking for a place to spend their honeymoon. With an eye catching sign on highway 101 we will bring in drop-in business. The Magnolia would like to see a 10% increase of potential customers on a yearly basis.
4.1 Market Segmentation
The profile of our customer consists of the following geographic and demographic information.
Geographics
- Our immediate geographic market is the San Francisco Bay area with a population of over one million people.
- A 200-mile geographic area would want to use the kind of services we offer.
- The total target area population is estimated at two million people.
Demographics
- Male and female.
- Married and single.
- Combined annual income in excess of $75,000.
- Age range of 25 to 65 years. with a median age of 40.
- Work in a professional business setting.
| Market Analysis | |||||||
| Year 1 | Year 2 | Year 3 | Year 4 | Year 5 | |||
| Potential Customers | Growth | CAGR | |||||
| Vacationers | 10% | 800,000 | 880,000 | 968,000 | 1,064,800 | 1,171,280 | 10.00% |
| Honeymooners | 10% | 5,000 | 5,500 | 6,050 | 6,655 | 7,321 | 10.00% |
| Drop-ins | 10% | 1,000 | 1,100 | 1,210 | 1,331 | 1,464 | 10.00% |
| Total | 10.00% | 806,000 | 886,600 | 975,260 | 1,072,786 | 1,180,065 | 10.00% |

4.2 Target Market Segment Strategy
Our target market strategy is based on becoming a destination for people who are looking to get away for a few days, on the beautiful California coast. Our marketing strategy is based on superior performance in the following areas:
- Quality facilities.
- Beautiful location.
- Customer service.
The target markets are separated into three segments; “Vacationers,” “Honeymooners,” and “Drop-ins.” The primary marketing opportunity is selling to these accessible target market segments that focuses on vacation and recreational needs.
Vacationers
The most dominant segment of the three is comprised of the San Francisco Bay and surrounding area. Half Moon Bay is approximately a 45 minute drive for Bay area residents. Half Moon Bay can seem like a different world and this is attractive for those people who have the need to get away but do not have the time to go far.
Honeymooners
Because of the beauty and location of our Inn, we will be a very attractive choice for people looking for a honeymoon location.
Drop-ins
When rooms are available we will welcome the drop-in customer who is looking for a place to stay for the night. Our sign can be seen from highway 101 and we expect to get quite a few drop-ins.
4.3 Service Business Analysis
The Magnolia Inn is a seven room facility that provides over night lodging and breakfast in a luxurious setting on the beautiful California Coast. There are several other Inns in the area as well as motels. Most people who need lodging in the area make reservations in advance to assure room availability. Two other Bed and Breakfast Inns, the Riptide Inn, and the Bayshore Inn are our main competitors.
4.3.1 Competition and Buying Patterns
Typically in this industry the consumer is someone who is not just looking for a room to sleep in, but a facility that provides a homespun touch. A place that is unique and offers more personalized customer service. Because each Inn is offering something unique to the guest, customer service and quality of the facilities are at the forefront of importance. Location is also important and those Inns with an ocean view have an advantage, but with the limited number of rooms at Inns in the area there are enough customers to match the supply. The Magnolia will not be competing on price as the price of a room is on the high end of the scale. Guests at the Magnolia are paying for more than just a room, they are paying for a oasis away from their hectic world.
Strategy and Implementation Summary
The primary sales and marketing strategy for Magnolia includes these factors:
- To offer a bed and breakfast facility that will appeal to the busy professional.
- To provide unmatched customer service to our guests.
- To concentrate our marketing in the greater San Francisco Bay area.
5.1 Competitive Edge
The Magnolia Inn sets itself apart from similar competition in the following ways.
- Location: The sheer beauty of our setting is a huge plus. Nestled on a bluff with a panoramic view of the Pacific Ocean the Magnolia is the ideal place to take in mother nature. Beautiful magnolia trees and a garden area makes this setting a truly magnificent place.
- Our rooms: Each room is individually decorated with antiques that are tasteful but comfortable. You feel as if you have stepped back in time, as luxury is present at every turn.
- Customer service: Customer service is our number one priority. The Magnolia will treat each guest as if they are family.
5.2 Marketing Strategy
Our marketing strategy is based on becoming a destination for vacationers and honeymooners who are looking for truly beautiful and unique lodgings. With the greater San Francisco Bay area our main target market the Magnolia will use several different approaches to advertise our facility. We will use the Yellow Pages to advertise, as well as develop a Web page that will show our beautiful Inn. On highway 101 we will have an eye catching sign that will alert potential drop-ins of our existence. The Magnolia is confident that it will not take long with word-of-mouth from past customers, to build up to full capacity.
5.3 Sales Strategy
Our prime location with a beautiful ocean view and a quality facility will be an attractive choice for our potential customers. Each room is decorated individually with antiques and quality furnishings made to feel just like home. A hot tub on the deck overlooking the ocean is provided for our guests. A first class breakfast is served each morning with no expense spared. Guests will have several options on our menu so that we can accommodate most tastes. There are several fun and interesting destination spots within 30 minutes of the Inn and we will have a van ready to shuttle guests if they need the service. The Magnolia guest will feel pampered and will leave for home well rested.
5.3.1 Sales Forecast
The sales forecast table is broken down into two main revenue streams: Reservations and Drop-ins. The sales forecast for the upcoming year is based on a 10% growth rate for direct sales. The Magnolia has seven rooms to offer its guests at a rate of $175.00 per night. We expect the rate of rooms occupied to increase as the year progresses. In spite of the economic unpredictability we are experiencing, these projections appear attainable and take the increasing base into consideration. Growth rates for the years 2005 and 2006 are based on percentage increases as follows:
- Reservations: 10% growth rate per year.
- Drop-ins: 10% growth rate per year.

| Sales Forecast | |||
| Year 1 | Year 2 | Year 3 | |
| Sales | |||
| Reservations | $294,140 | $323,554 | $355,909 |
| Drop-ins | $47,690 | $52,459 | $57,705 |
| Total Sales | $341,830 | $376,013 | $413,614 |
| Direct Cost of Sales | Year 1 | Year 2 | Year 3 |
| Reservations | $14,707 | $14,000 | $16,000 |
| Drop-ins | $2,385 | $7,000 | $8,000 |
| Subtotal Direct Cost of Sales | $17,092 | $21,000 | $24,000 |
5.4 Milestones
The milestones table below outlines key activities that will be critical to our success. Owners Jim and Nancy Anderson will take care of these important activities.

| Milestones | |||||
| Milestone | Start Date | End Date | Budget | Manager | Department |
| Business Plan | 1/8/2003 | 2/8/2003 | $500 | Jim | Management |
| Web Development | 3/7/2003 | 5/4/2003 | $1,000 | Nancy | Management |
| Marketing | 5/12/2003 | 7/1/2003 | $3,000 | Nancy | Management |
| Accounting Plan | 6/8/2003 | 7/9/2003 | $500 | Jim | Management |
| Totals | $5,000 | ||||
Web Plan Summary
The Magnolia Inn website will focus on the features the Inn has to offer. Each room with its unique decor will be on the site as well as pictures of the Inn and the surrounding gardens and grounds over looking the Pacific Ocean. The breakfast menu will be displayed with pictures of the food laid out in the dining room. Room rates will be given with maps on how to get to the Inn. Attractions within 30 miles will be on the site and other local color will be shown. Reservations can be made online if the consumer wishes to do so.
6.1 Website Marketing Strategy
Our website marketing strategy will focus on professional couples who are looking for a vacation destination that is both close and elegant. The Bay area will be our main focal point. The Magnolia will promote through our website by using:
- Detailed photos of the Inn and surrounding area.
- Price list of our rooms and a menu of our breakfast.
- Maps from many points of the Bay area that lead to the Inn.
6.2 Development Requirements
Co-owner Nancy Anderson will develop the website. The site itself will take several months to develop and it will be an ongoing effort to add new information to the site as we see necessary. Nancy has a degree in computer science and extensive experience working with websites. Every aspect of the site will be handled by Nancy including company logo, Web page format, and maintenance of the site. AOL Web services will host the site.
Management Summary
Jim and Nancy Anderson are the sole owners of the Magnolia Inn. A small staff consisting of a cook and maid will work at the Inn. The rest of the tasks will be done by Jim and Nancy. Jim is responsible for the outside maintenance of the grounds and of the Inn. He will also drive the van for guests when the need arises. Nancy will organize the day to day operations on the inside and handle reservations. Both Jim and Nancy will promote the Inn through the advertising methods discussed in the marketing strategy section. Nancy will also work with the cook to purchase the food served at the Inn.
7.1 Personnel Plan
Jim and Nancy sold a small motel a year and a half ago with the intent of finding the ideal location for a bed and breakfast. The personnel plan consists of Jim and Nancy’s schedule plus that of the staff. Stacie, our cook will work 20 hours per week and will help with the shopping for the supplies. Carol will work full time preparing rooms and helping with taking reservations and watching the Inn when Jim or Nancy cannot be there. Jim and Nancy will live at the Inn with their own quarters on site. Jim’s dad will receive $500 dollars each month until the $15,000 dollars he invested is payed back. The total payroll equates to $111,000 including the $57,000 dollars that Jim and Nancy will take out as their salary.
| Personnel Plan | |||
| Year 1 | Year 2 | Year 3 | |
| Owners | $57,000 | $65,000 | $65,000 |
| Full time Staff | $48,000 | $52,000 | $54,000 |
| Total People | 4 | 4 | 4 |
| Total Payroll | $105,000 | $117,000 | $119,000 |
Financial Plan
The Magnolia Inn expects business to grow steadily until we are at an average of over 90% capacity for the year 2004 with a conservative capacity rate of 50% expected at times. We will be growing slowly with profits growing at a rate of about 10%. Expenses will be well managed, allowing Magnolia to make a profit even if the capacity rate drops as low as 50%.
8.1 Important Assumptions
The following critical assumptions will determine the potential for future success.
- A healthy economy that supports a moderate level of growth in our market.
- Keeping operating costs as low as possible, particularly in the areas of personnel and our ongoing monthly expenses.
| General Assumptions | |||
| Year 1 | Year 2 | Year 3 | |
| Plan Month | 1 | 2 | 3 |
| Current Interest Rate | 9.50% | 9.50% | 9.50% |
| Long-term Interest Rate | 8.50% | 8.50% | 8.50% |
| Tax Rate | 28.17% | 28.00% | 28.17% |
| Other | 0 | 0 | 0 |
8.2 Break-even Analysis
The following chart and table summarize our break-even analysis. Our fixed costs will be $17,000 per month at the onset and we expect to reach the break-even point within the first few months of operation.

| Break-even Analysis | |
| Monthly Revenue Break-even | $18,487 |
| Assumptions: | |
| Average Percent Variable Cost | 5% |
| Estimated Monthly Fixed Cost | $17,563 |
8.3 Projected Profit and Loss
The following represents the Projected Profit and Loss for the Magnolia Inn based on sales and expense projections for 2004 and beyond.


| Pro Forma Profit and Loss | |||
| Year 1 | Year 2 | Year 3 | |
| Sales | $341,830 | $376,013 | $413,614 |
| Direct Cost of Sales | $17,092 | $21,000 | $24,000 |
| Other Costs of Sales | $12,000 | $14,000 | $16,000 |
| Total Cost of Sales | $29,092 | $35,000 | $40,000 |
| Gross Margin | $312,739 | $341,013 | $373,614 |
| Gross Margin % | 91.49% | 90.69% | 90.33% |
| Expenses | |||
| Payroll | $105,000 | $117,000 | $119,000 |
| Sales and Marketing and Other Expenses | $12,000 | $14,000 | $16,000 |
| Depreciation | $0 | $0 | $0 |
| Rent | $48,000 | $48,000 | $48,000 |
| Utilities | $12,000 | $14,000 | $16,000 |
| Insurance | $6,000 | $7,000 | $8,000 |
| Payroll Taxes | $15,750 | $17,550 | $17,850 |
| Other | $12,000 | $3,000 | $0 |
| Total Operating Expenses | $210,750 | $220,550 | $224,850 |
| Profit Before Interest and Taxes | $101,989 | $120,463 | $148,764 |
| EBITDA | $101,989 | $120,463 | $148,764 |
| Interest Expense | $29,885 | $29,660 | $29,411 |
| Taxes Incurred | $20,188 | $25,425 | $33,618 |
| Net Profit | $51,916 | $65,378 | $85,736 |
| Net Profit/Sales | 15.19% | 17.39% | 20.73% |
8.4 Projected Cash Flow
The Cash Flow projections are outlined below. Again, these projections are based on our basic assumptions with revenue generation factors carrying the most significant weight regarding the outcome. We are anticipating that we will not need to invest any additional capital into the business with a healthy cash flow in place.

| Pro Forma Cash Flow | |||
| Year 1 | Year 2 | Year 3 | |
| Cash Received | |||
| Cash from Operations | |||
| Cash Sales | $341,830 | $376,013 | $413,614 |
| Subtotal Cash from Operations | $341,830 | $376,013 | $413,614 |
| Additional Cash Received | |||
| Sales Tax, VAT, HST/GST Received | $0 | $0 | $0 |
| New Current Borrowing | $0 | $0 | $0 |
| New Other Liabilities (interest-free) | $0 | $0 | $0 |
| New Long-term Liabilities | $0 | $0 | $0 |
| Sales of Other Current Assets | $0 | $0 | $0 |
| Sales of Long-term Assets | $0 | $0 | $0 |
| New Investment Received | $0 | $0 | $0 |
| Subtotal Cash Received | $341,830 | $376,013 | $413,614 |
| Expenditures | Year 1 | Year 2 | Year 3 |
| Expenditures from Operations | |||
| Cash Spending | $105,000 | $117,000 | $119,000 |
| Bill Payments | $169,225 | $193,409 | $207,626 |
| Subtotal Spent on Operations | $274,225 | $310,409 | $326,626 |
| Additional Cash Spent | |||
| Sales Tax, VAT, HST/GST Paid Out | $0 | $0 | $0 |
| Principal Repayment of Current Borrowing | $0 | $0 | $0 |
| Other Liabilities Principal Repayment | $0 | $0 | $0 |
| Long-term Liabilities Principal Repayment | $2,646 | $2,831 | $3,029 |
| Purchase Other Current Assets | $0 | $0 | $0 |
| Purchase Long-term Assets | $0 | $0 | $0 |
| Dividends | $6,000 | $6,000 | $3,000 |
| Subtotal Cash Spent | $282,871 | $319,240 | $332,655 |
| Net Cash Flow | $58,959 | $56,773 | $80,959 |
| Cash Balance | $64,959 | $121,732 | $202,692 |
8.5 Projected Balance Sheet
The Balance Sheet in the following table shows sufficient growth and a very acceptable financial position. The monthly estimates are included and shown in the appendix.
| Pro Forma Balance Sheet | |||
| Year 1 | Year 2 | Year 3 | |
| Assets | |||
| Current Assets | |||
| Cash | $64,959 | $121,732 | $202,692 |
| Other Current Assets | $10,000 | $10,000 | $10,000 |
| Total Current Assets | $74,959 | $131,732 | $212,692 |
| Long-term Assets | |||
| Long-term Assets | $370,000 | $370,000 | $370,000 |
| Accumulated Depreciation | $0 | $0 | $0 |
| Total Long-term Assets | $370,000 | $370,000 | $370,000 |
| Total Assets | $444,959 | $501,732 | $582,692 |
| Liabilities and Capital | Year 1 | Year 2 | Year 3 |
| Current Liabilities | |||
| Accounts Payable | $15,689 | $15,915 | $17,168 |
| Current Borrowing | $0 | $0 | $0 |
| Other Current Liabilities | $0 | $0 | $0 |
| Subtotal Current Liabilities | $15,689 | $15,915 | $17,168 |
| Long-term Liabilities | $350,354 | $347,523 | $344,494 |
| Total Liabilities | $366,043 | $363,438 | $361,662 |
| Paid-in Capital | $65,000 | $65,000 | $65,000 |
| Retained Earnings | ($38,000) | $7,916 | $70,294 |
| Earnings | $51,916 | $65,378 | $85,736 |
| Total Capital | $78,916 | $138,294 | $221,030 |
| Total Liabilities and Capital | $444,959 | $501,732 | $582,692 |
| Net Worth | $78,916 | $138,294 | $221,030 |
8.6 Business Ratios
Business ratios for the years of this plan are shown below. Industry profile ratios based on the Standard Industrial Classification (SIC) code 7011.0401, Bed and Breakfast Inns are shown for comparison.
The following will enable us to keep on track. If we fail in any of these areas we will need to re-evaluate our business mode:
- Month-to-month annual comparisons indicate an increase of 10% or greater.
- Do not depend on credit line to meet cash requirements.
| Ratio Analysis | ||||
| Year 1 | Year 2 | Year 3 | Industry Profile | |
| Sales Growth | 0.00% | 10.00% | 10.00% | 7.24% |
| Percent of Total Assets | ||||
| Other Current Assets | 2.25% | 1.99% | 1.72% | 22.48% |
| Total Current Assets | 16.85% | 26.26% | 36.50% | 27.08% |
| Long-term Assets | 83.15% | 73.74% | 63.50% | 72.92% |
| Total Assets | 100.00% | 100.00% | 100.00% | 100.00% |
| Current Liabilities | 3.53% | 3.17% | 2.95% | 14.60% |
| Long-term Liabilities | 78.74% | 69.26% | 59.12% | 32.80% |
| Total Liabilities | 82.26% | 72.44% | 62.07% | 47.40% |
| Net Worth | 17.74% | 27.56% | 37.93% | 52.60% |
| Percent of Sales | ||||
| Sales | 100.00% | 100.00% | 100.00% | 100.00% |
| Gross Margin | 91.49% | 90.69% | 90.33% | 100.00% |
| Selling, General & Administrative Expenses | 76.30% | 73.30% | 69.55% | 67.52% |
| Advertising Expenses | 0.00% | 0.00% | 0.00% | 2.55% |
| Profit Before Interest and Taxes | 29.84% | 32.04% | 35.97% | 0.36% |
| Main Ratios | ||||
| Current | 4.78 | 8.28 | 12.39 | 1.00 |
| Quick | 4.78 | 8.28 | 12.39 | 0.76 |
| Total Debt to Total Assets | 82.26% | 72.44% | 62.07% | 59.90% |
| Pre-tax Return on Net Worth | 91.37% | 65.66% | 54.00% | 0.24% |
| Pre-tax Return on Assets | 16.20% | 18.10% | 20.48% | 0.60% |
| Additional Ratios | Year 1 | Year 2 | Year 3 | |
| Net Profit Margin | 15.19% | 17.39% | 20.73% | n.a |
| Return on Equity | 65.79% | 47.27% | 38.79% | n.a |
| Activity Ratios | ||||
| Accounts Payable Turnover | 11.79 | 12.17 | 12.17 | n.a |
| Payment Days | 27 | 30 | 29 | n.a |
| Total Asset Turnover | 0.77 | 0.75 | 0.71 | n.a |
| Debt Ratios | ||||
| Debt to Net Worth | 4.64 | 2.63 | 1.64 | n.a |
| Current Liab. to Liab. | 0.04 | 0.04 | 0.05 | n.a |
| Liquidity Ratios | ||||
| Net Working Capital | $59,270 | $115,817 | $195,524 | n.a |
| Interest Coverage | 3.41 | 4.06 | 5.06 | n.a |
| Additional Ratios | ||||
| Assets to Sales | 1.30 | 1.33 | 1.41 | n.a |
| Current Debt/Total Assets | 4% | 3% | 3% | n.a |
| Acid Test | 4.78 | 8.28 | 12.39 | n.a |
| Sales/Net Worth | 4.33 | 2.72 | 1.87 | n.a |
| Dividend Payout | 0.12 | 0.09 | 0.03 | n.a |
Appendix
| Sales Forecast | |||||||||||||
| Month 1 | Month 2 | Month 3 | Month 4 | Month 5 | Month 6 | Month 7 | Month 8 | Month 9 | Month 10 | Month 11 | Month 12 | ||
| Sales | |||||||||||||
| Reservations | 0% | $18,000 | $20,000 | $24,482 | $24,727 | $24,974 | $25,224 | $25,476 | $25,731 | $25,989 | $26,248 | $26,511 | $26,776 |
| Drop-ins | 0% | $2,000 | $3,000 | $4,080 | $4,121 | $4,162 | $4,204 | $4,246 | $4,289 | $4,331 | $4,375 | $4,418 | $4,463 |
| Total Sales | $20,000 | $23,000 | $28,563 | $28,848 | $29,137 | $29,428 | $29,723 | $30,020 | $30,320 | $30,623 | $30,929 | $31,239 | |
| Direct Cost of Sales | Month 1 | Month 2 | Month 3 | Month 4 | Month 5 | Month 6 | Month 7 | Month 8 | Month 9 | Month 10 | Month 11 | Month 12 | |
| Reservations | $900 | $1,000 | $1,224 | $1,236 | $1,249 | $1,261 | $1,274 | $1,287 | $1,299 | $1,312 | $1,326 | $1,339 | |
| Drop-ins | $100 | $150 | $204 | $206 | $208 | $210 | $212 | $214 | $217 | $219 | $221 | $223 | |
| Subtotal Direct Cost of Sales | $1,000 | $1,150 | $1,428 | $1,442 | $1,457 | $1,471 | $1,486 | $1,501 | $1,516 | $1,531 | $1,546 | $1,562 | |
| Personnel Plan | |||||||||||||
| Month 1 | Month 2 | Month 3 | Month 4 | Month 5 | Month 6 | Month 7 | Month 8 | Month 9 | Month 10 | Month 11 | Month 12 | ||
| Owners | 0% | $3,000 | $4,000 | $5,000 | $5,000 | $5,000 | $5,000 | $5,000 | $5,000 | $5,000 | $5,000 | $5,000 | $5,000 |
| Full time Staff | 0% | $4,000 | $4,000 | $4,000 | $4,000 | $4,000 | $4,000 | $4,000 | $4,000 | $4,000 | $4,000 | $4,000 | $4,000 |
| Total People | 4 | 4 | 4 | 4 | 4 | 4 | 4 | 4 | 4 | 4 | 4 | 4 | |
| Total Payroll | $7,000 | $8,000 | $9,000 | $9,000 | $9,000 | $9,000 | $9,000 | $9,000 | $9,000 | $9,000 | $9,000 | $9,000 | |
| General Assumptions | |||||||||||||
| Month 1 | Month 2 | Month 3 | Month 4 | Month 5 | Month 6 | Month 7 | Month 8 | Month 9 | Month 10 | Month 11 | Month 12 | ||
| Plan Month | 1 | 2 | 3 | 4 | 5 | 6 | 7 | 8 | 9 | 10 | 11 | 12 | |
| Current Interest Rate | 9.50% | 9.50% | 9.50% | 9.50% | 9.50% | 9.50% | 9.50% | 9.50% | 9.50% | 9.50% | 9.50% | 9.50% | |
| Long-term Interest Rate | 8.50% | 8.50% | 8.50% | 8.50% | 8.50% | 8.50% | 8.50% | 8.50% | 8.50% | 8.50% | 8.50% | 8.50% | |
| Tax Rate | 30.00% | 28.00% | 28.00% | 28.00% | 28.00% | 28.00% | 28.00% | 28.00% | 28.00% | 28.00% | 28.00% | 28.00% | |
| Other | 0 | 0 | 0 | 0 | 0 | 0 | 0 | 0 | 0 | 0 | 0 | 0 | |
| Pro Forma Profit and Loss | |||||||||||||
| Month 1 | Month 2 | Month 3 | Month 4 | Month 5 | Month 6 | Month 7 | Month 8 | Month 9 | Month 10 | Month 11 | Month 12 | ||
| Sales | $20,000 | $23,000 | $28,563 | $28,848 | $29,137 | $29,428 | $29,723 | $30,020 | $30,320 | $30,623 | $30,929 | $31,239 | |
| Direct Cost of Sales | $1,000 | $1,150 | $1,428 | $1,442 | $1,457 | $1,471 | $1,486 | $1,501 | $1,516 | $1,531 | $1,546 | $1,562 | |
| Other Costs of Sales | $1,000 | $1,000 | $1,000 | $1,000 | $1,000 | $1,000 | $1,000 | $1,000 | $1,000 | $1,000 | $1,000 | $1,000 | |
| Total Cost of Sales | $2,000 | $2,150 | $2,428 | $2,442 | $2,457 | $2,471 | $2,486 | $2,501 | $2,516 | $2,531 | $2,546 | $2,562 | |
| Gross Margin | $18,000 | $20,850 | $26,135 | $26,406 | $26,680 | $26,957 | $27,236 | $27,519 | $27,804 | $28,092 | $28,383 | $28,677 | |
| Gross Margin % | 90.00% | 90.65% | 91.50% | 91.53% | 91.57% | 91.60% | 91.64% | 91.67% | 91.70% | 91.73% | 91.77% | 91.80% | |
| Expenses | |||||||||||||
| Payroll | $7,000 | $8,000 | $9,000 | $9,000 | $9,000 | $9,000 | $9,000 | $9,000 | $9,000 | $9,000 | $9,000 | $9,000 | |
| Sales and Marketing and Other Expenses | $1,000 | $1,000 | $1,000 | $1,000 | $1,000 | $1,000 | $1,000 | $1,000 | $1,000 | $1,000 | $1,000 | $1,000 | |
| Depreciation | $0 | $0 | $0 | $0 | $0 | $0 | $0 | $0 | $0 | $0 | $0 | $0 | |
| Rent | $4,000 | $4,000 | $4,000 | $4,000 | $4,000 | $4,000 | $4,000 | $4,000 | $4,000 | $4,000 | $4,000 | $4,000 | |
| Utilities | $1,000 | $1,000 | $1,000 | $1,000 | $1,000 | $1,000 | $1,000 | $1,000 | $1,000 | $1,000 | $1,000 | $1,000 | |
| Insurance | $500 | $500 | $500 | $500 | $500 | $500 | $500 | $500 | $500 | $500 | $500 | $500 | |
| Payroll Taxes | 15% | $1,050 | $1,200 | $1,350 | $1,350 | $1,350 | $1,350 | $1,350 | $1,350 | $1,350 | $1,350 | $1,350 | $1,350 |
| Other | $1,000 | $1,000 | $1,000 | $1,000 | $1,000 | $1,000 | $1,000 | $1,000 | $1,000 | $1,000 | $1,000 | $1,000 | |
| Total Operating Expenses | $15,550 | $16,700 | $17,850 | $17,850 | $17,850 | $17,850 | $17,850 | $17,850 | $17,850 | $17,850 | $17,850 | $17,850 | |
| Profit Before Interest and Taxes | $2,450 | $4,150 | $8,285 | $8,556 | $8,830 | $9,107 | $9,386 | $9,669 | $9,954 | $10,242 | $10,533 | $10,827 | |
| EBITDA | $2,450 | $4,150 | $8,285 | $8,556 | $8,830 | $9,107 | $9,386 | $9,669 | $9,954 | $10,242 | $10,533 | $10,827 | |
| Interest Expense | $2,499 | $2,497 | $2,496 | $2,494 | $2,493 | $2,491 | $2,490 | $2,488 | $2,487 | $2,485 | $2,483 | $2,482 | |
| Taxes Incurred | ($15) | $463 | $1,621 | $1,697 | $1,774 | $1,852 | $1,931 | $2,011 | $2,091 | $2,172 | $2,254 | $2,337 | |
| Net Profit | ($34) | $1,190 | $4,168 | $4,364 | $4,563 | $4,763 | $4,966 | $5,170 | $5,377 | $5,585 | $5,796 | $6,008 | |
| Net Profit/Sales | -0.17% | 5.17% | 14.59% | 15.13% | 15.66% | 16.19% | 16.71% | 17.22% | 17.73% | 18.24% | 18.74% | 19.23% | |
| Pro Forma Cash Flow | |||||||||||||
| Month 1 | Month 2 | Month 3 | Month 4 | Month 5 | Month 6 | Month 7 | Month 8 | Month 9 | Month 10 | Month 11 | Month 12 | ||
| Cash Received | |||||||||||||
| Cash from Operations | |||||||||||||
| Cash Sales | $20,000 | $23,000 | $28,563 | $28,848 | $29,137 | $29,428 | $29,723 | $30,020 | $30,320 | $30,623 | $30,929 | $31,239 | |
| Subtotal Cash from Operations | $20,000 | $23,000 | $28,563 | $28,848 | $29,137 | $29,428 | $29,723 | $30,020 | $30,320 | $30,623 | $30,929 | $31,239 | |
| Additional Cash Received | |||||||||||||
| Sales Tax, VAT, HST/GST Received | 0.00% | $0 | $0 | $0 | $0 | $0 | $0 | $0 | $0 | $0 | $0 | $0 | $0 |
| New Current Borrowing | $0 | $0 | $0 | $0 | $0 | $0 | $0 | $0 | $0 | $0 | $0 | $0 | |
| New Other Liabilities (interest-free) | $0 | $0 | $0 | $0 | $0 | $0 | $0 | $0 | $0 | $0 | $0 | $0 | |
| New Long-term Liabilities | $0 | $0 | $0 | $0 | $0 | $0 | $0 | $0 | $0 | $0 | $0 | $0 | |
| Sales of Other Current Assets | $0 | $0 | $0 | $0 | $0 | $0 | $0 | $0 | $0 | $0 | $0 | $0 | |
| Sales of Long-term Assets | $0 | $0 | $0 | $0 | $0 | $0 | $0 | $0 | $0 | $0 | $0 | $0 | |
| New Investment Received | $0 | $0 | $0 | $0 | $0 | $0 | $0 | $0 | $0 | $0 | $0 | $0 | |
| Subtotal Cash Received | $20,000 | $23,000 | $28,563 | $28,848 | $29,137 | $29,428 | $29,723 | $30,020 | $30,320 | $30,623 | $30,929 | $31,239 | |
| Expenditures | Month 1 | Month 2 | Month 3 | Month 4 | Month 5 | Month 6 | Month 7 | Month 8 | Month 9 | Month 10 | Month 11 | Month 12 | |
| Expenditures from Operations | |||||||||||||
| Cash Spending | $7,000 | $8,000 | $9,000 | $9,000 | $9,000 | $9,000 | $9,000 | $9,000 | $9,000 | $9,000 | $9,000 | $9,000 | |
| Bill Payments | $434 | $13,060 | $13,863 | $15,398 | $15,487 | $15,577 | $15,668 | $15,760 | $15,853 | $15,947 | $16,041 | $16,137 | |
| Subtotal Spent on Operations | $7,434 | $21,060 | $22,863 | $24,398 | $24,487 | $24,577 | $24,668 | $24,760 | $24,853 | $24,947 | $25,041 | $25,137 | |
| Additional Cash Spent | |||||||||||||
| Sales Tax, VAT, HST/GST Paid Out | $0 | $0 | $0 | $0 | $0 | $0 | $0 | $0 | $0 | $0 | $0 | $0 | |
| Principal Repayment of Current Borrowing | $0 | $0 | $0 | $0 | $0 | $0 | $0 | $0 | $0 | $0 | $0 | $0 | |
| Other Liabilities Principal Repayment | $0 | $0 | $0 | $0 | $0 | $0 | $0 | $0 | $0 | $0 | $0 | $0 | |
| Long-term Liabilities Principal Repayment | $212 | $214 | $215 | $217 | $218 | $220 | $221 | $223 | $224 | $226 | $228 | $229 | |
| Purchase Other Current Assets | $0 | $0 | $0 | $0 | $0 | $0 | $0 | $0 | $0 | $0 | $0 | $0 | |
| Purchase Long-term Assets | $0 | $0 | $0 | $0 | $0 | $0 | $0 | $0 | $0 | $0 | $0 | $0 | |
| Dividends | $500 | $500 | $500 | $500 | $500 | $500 | $500 | $500 | $500 | $500 | $500 | $500 | |
| Subtotal Cash Spent | $8,147 | $21,774 | $23,578 | $25,114 | $25,205 | $25,297 | $25,389 | $25,483 | $25,577 | $25,672 | $25,769 | $25,866 | |
| Net Cash Flow | $11,853 | $1,226 | $4,985 | $3,734 | $3,932 | $4,132 | $4,333 | $4,537 | $4,743 | $4,951 | $5,161 | $5,373 | |
| Cash Balance | $17,853 | $19,080 | $24,065 | $27,799 | $31,730 | $35,862 | $40,195 | $44,732 | $49,475 | $54,426 | $59,586 | $64,959 | |
| Pro Forma Balance Sheet | |||||||||||||
| Month 1 | Month 2 | Month 3 | Month 4 | Month 5 | Month 6 | Month 7 | Month 8 | Month 9 | Month 10 | Month 11 | Month 12 | ||
| Assets | Starting Balances | ||||||||||||
| Current Assets | |||||||||||||
| Cash | $6,000 | $17,853 | $19,080 | $24,065 | $27,799 | $31,730 | $35,862 | $40,195 | $44,732 | $49,475 | $54,426 | $59,586 | $64,959 |
| Other Current Assets | $10,000 | $10,000 | $10,000 | $10,000 | $10,000 | $10,000 | $10,000 | $10,000 | $10,000 | $10,000 | $10,000 | $10,000 | $10,000 |
| Total Current Assets | $16,000 | $27,853 | $29,080 | $34,065 | $37,799 | $41,730 | $45,862 | $50,195 | $54,732 | $59,475 | $64,426 | $69,586 | $74,959 |
| Long-term Assets | |||||||||||||
| Long-term Assets | $370,000 | $370,000 | $370,000 | $370,000 | $370,000 | $370,000 | $370,000 | $370,000 | $370,000 | $370,000 | $370,000 | $370,000 | $370,000 |
| Accumulated Depreciation | $0 | $0 | $0 | $0 | $0 | $0 | $0 | $0 | $0 | $0 | $0 | $0 | $0 |
| Total Long-term Assets | $370,000 | $370,000 | $370,000 | $370,000 | $370,000 | $370,000 | $370,000 | $370,000 | $370,000 | $370,000 | $370,000 | $370,000 | $370,000 |
| Total Assets | $386,000 | $397,853 | $399,080 | $404,065 | $407,799 | $411,730 | $415,862 | $420,195 | $424,732 | $429,475 | $434,426 | $439,586 | $444,959 |
| Liabilities and Capital | Month 1 | Month 2 | Month 3 | Month 4 | Month 5 | Month 6 | Month 7 | Month 8 | Month 9 | Month 10 | Month 11 | Month 12 | |
| Current Liabilities | |||||||||||||
| Accounts Payable | $0 | $12,600 | $13,350 | $14,882 | $14,968 | $15,055 | $15,143 | $15,232 | $15,321 | $15,412 | $15,503 | $15,596 | $15,689 |
| Current Borrowing | $0 | $0 | $0 | $0 | $0 | $0 | $0 | $0 | $0 | $0 | $0 | $0 | $0 |
| Other Current Liabilities | $0 | $0 | $0 | $0 | $0 | $0 | $0 | $0 | $0 | $0 | $0 | $0 | $0 |
| Subtotal Current Liabilities | $0 | $12,600 | $13,350 | $14,882 | $14,968 | $15,055 | $15,143 | $15,232 | $15,321 | $15,412 | $15,503 | $15,596 | $15,689 |
| Long-term Liabilities | $353,000 | $352,788 | $352,574 | $352,359 | $352,143 | $351,925 | $351,705 | $351,484 | $351,261 | $351,037 | $350,811 | $350,583 | $350,354 |
| Total Liabilities | $353,000 | $365,388 | $365,924 | $367,241 | $367,111 | $366,980 | $366,848 | $366,716 | $366,582 | $366,449 | $366,314 | $366,179 | $366,043 |
| Paid-in Capital | $65,000 | $65,000 | $65,000 | $65,000 | $65,000 | $65,000 | $65,000 | $65,000 | $65,000 | $65,000 | $65,000 | $65,000 | $65,000 |
| Retained Earnings | ($32,000) | ($32,500) | ($33,000) | ($33,500) | ($34,000) | ($34,500) | ($35,000) | ($35,500) | ($36,000) | ($36,500) | ($37,000) | ($37,500) | ($38,000) |
| Earnings | $0 | ($34) | $1,156 | $5,324 | $9,688 | $14,251 | $19,014 | $23,980 | $29,150 | $34,526 | $40,112 | $45,907 | $51,916 |
| Total Capital | $33,000 | $32,466 | $33,156 | $36,824 | $40,688 | $44,751 | $49,014 | $53,480 | $58,150 | $63,026 | $68,112 | $73,407 | $78,916 |
| Total Liabilities and Capital | $386,000 | $397,853 | $399,080 | $404,065 | $407,799 | $411,730 | $415,862 | $420,195 | $424,732 | $429,475 | $434,426 | $439,586 | $444,959 |
| Net Worth | $33,000 | $32,466 | $33,156 | $36,824 | $40,688 | $44,751 | $49,014 | $53,480 | $58,150 | $63,026 | $68,112 | $73,407 | $78,916 |


