
Vette Kat Harbour Bed and Breakfast
Executive Summary
The Vette Kat Harbour Bed & Breakfast will be a charming bed and breakfast (B & B) located overlooking Vette Kat Harbour on our beautiful Caribbean island. The island is well known for its beauty and history. The B & B will be set up as a LLC of Kayman St. Lucia and will reside in the St. Lucia’s home. Their home is the centerpiece for the entire B & B experience. There will be up to seven guest rooms to choose from. The facility has a wonderful centralized living room where the guests may socialize, a private garden patio, and the Buccaneer Culinary Centre on the property.
At first glance you might not even notice the unassuming white building festooned with flags of many nations. But once inside the front door you realize that this could only be the Vette Kat Harbour Bed & Breakfast. A graceful gato gordo may greet you as one of the staff takes your bags and leads you to a cozy alcove for Passion Fruit tea and delicate biscuits.
From an 18th Century portrait high above a crackling fire, famed French Gastronome Fromage LeGrande smiles approvingly. Steps away an enchanting courtyard beckons through French doors while the sparkle of crystal and silver on nearby tables hints at pleasures to come. Wherever you look fragrant flowers, richly layered fabrics and wall coverings and amethyst-studded ceilings form a bewitching backdrop for the owner’s superb collection of art and antiques.
The inn’s personalized approach to serving its guests will be consistently rated amongst the World’s Best by readers of Travel + Leisure magazine as well as others. Indeed, one will have the sense that anything might be possible here. Breakfast can be brought to your room or served in the light–filled Terrace Room overlooking the garden. Should you wish to take to the countryside or the seaside for lunch, the staff will pack you an unforgettable picnic and suggest a scenic route to some of the most spectacular scenery on the island. Returning to the inn for afternoon tea in the living room will be a treat. Attention to detail will clearly be the hallmark of this magical place.
The Market
Within the hospitality industry, the Vette Kat Harbour Bed & Breakfast will be competing with hotels as there are no other B & Bs in the general area. The Vette Kat Harbour Bed & Breakfast facilities are far nicer than other hotels in the area. All of the hotels in the area are fairly standard chain hotels, nothing noteworthy. The Vette Kat Harbour Bed & Breakfast – on the other hand, is a beautiful, elegant home – on a quiet street, in a small town, on the sea.
The Vette Kat Harbour Bed & Breakfast has different target groups that it is going to successfully attract. The first are people from the region that just want to get away for the weekend. They may have activities planned for the weekend at the parks, local towns or just choose to relax in a comfortable setting. The second group are travelers who are sailing through the area prefer to stay in B & Bs – instead of a hotel/motel, or on board their boats. Others will just want to have the experience of service presented by an Executive Chef. While we will certainly get customers that fall outside of these groups, this classification should be fairly accurate.
Competitive Edge
The Vette Kat Harbour Bed & Breakfast has two distinct competitive edges that differentiates it from the competition. The first is the never-ending attention to detail and customer service. The St. Lucia’s recognize that their mission is to ensure that their customers have the finest stay with them. Both Kayman and Jenné will do whatever it takes to ensure the customer’s happiness. This will be showcased in breakfast which will offer Starbucks Authorized and Certified Training System of Coffee and Tazo Tea service.
We will have full Barrista services complete with Cafe Au Lait and four selections of coffee daily. Teas will be from the Tazo collection and number eight per day showcased. Our baked goods and breakfast will be amazing and celebrate the guests with offerings of traditional simple pleasures, to gourmet exotic entrees to heart-healthy options endorsed by the American Heart Association. Island Style Skillet Conch grilled to perfection and served with Red-eye Gravy over Hand Rolled Biscuits or Challah Bread Dipped French Toast with Guava and Mango on top and then dusted incessantly with Powdered Sugar are a few examples of simple pleasures. Pancetta, Sundried Tomato and California Asparagus Fritattas are an example of a gourmet selection while the offering of Egg Beaters, fresh juices with 100% juice and Wheat breads, Spelt or Hearty Grain Muffins are offerings of healthy cuisine. Whether a guest is desirous of splurging or maintaining a regimen – our full medical cuisine knowledge will be handy and unheard of in the region. So will our famous Caribbean White Chocolate Chip, Macadamia, Pineapple and Walnut cookies that everyone raves about!
Their second competitive edge is the unique facility. The facility is so wonderful in part because of the actual structure – which is a magical place to behold and stay at. The tiffany lamps inside, the original gas, solid-silver fixture lamps and antiques are all amazing – as are the historic stories of Executive Chef Kayman’s foods, dishes and cooking all over the world.
Management Team
The Vette Kat Harbour B & B will be able to execute on its strong business model because of its management. Kayman has earned his MBA providing the establishment with invaluable business skills. Kayman also has unique experiences and talents that no other innkeeper has. As Kayman’s extended resumes for Chef, Marketing VP and B & B GM show – he has deep and successful experience in all three avenues needed. Kayman has been the GM for world-class resorts, hotels and B & B’s each of which experienced escalated profits and program growth. Kayman will be assisted by numerous Presidents, famed Executive Chefs from television and industry magnates/titans/CEO’s. Kayman’s fame around the world on TV, the TODAY show and more will also bring TV exposure, shows and once again – Kayman will go live weekly on the radio and in magazines. Kayman will be assisted by his step-son, Max Nevis and wife, Jenné Sequa – both trained Chefs from Country Club and restaurant work experiences. Kayman will continue to work for the company he has been with for 13 years now.
The Vette Kat Harbour B & B will be able to leverage its amazing facility and turn it into a beautiful, special B & B serving our inter-island community. This will be done through the passion and experience of Kayman St. Lucia. The B & B will become profitable by month three and will earn a respectable profit by the end of year one.
1.1 Objectives
The objectives of the Vette Kat Harbour Bed & Breakfast for the first five years of operation include:
- To create a B & B whose primary goal is to exceed customer’s expectations along the lines learned of, “unprecedented hospitality and service standards,” learned by the our world renown Chef.
- The Vette Kat Harbour Bed & Breakfast will increase visitors every week throughout the year.
- To increase our number of clients by 10% per year through superior service to 50% occupancy in Year 5.
- To develop a sustainable business, surviving off its own cash flow, exceeding set data. Customer Comment Cards should score 92 or above on average.
- To develop a sustainable Buccaneer Culinary Centre which survives off of its own cash flow, changes exhibits and contributes to the Bed and Breakfast operation by increased demographic draw. Customer Comment Cards should score 85 or above on average.
- To operate as green an operation as possible spanning water, power and emissions. Thusly becoming a lighthouse in the region for others.
- To contribute to the community in a loving and giving manner which allows us to preserve our island community. This will be measured by awards received.
1.2 Mission
The Mission of the Vette Kat Harbour B & B is:

“We are committed to being the preferred Bed and Breakfast Inn for the Vette Kat Harbour area and surrounding islands as well. We will exceed the expectations of our guests and colleagues by providing a contemporary, world class experience, through continuous commitment to the development of our colleagues and product to achieve maximum growth and profitability.”
For some the inn will be a romantic fantasy world far removed from the harsh realities of modern day life, for others it will be a culinary oasis akin to visiting a multi-starred restaurant. Some will be surprised – and relieved – that the inn doesn’t take itself too seriously. Guests often will remark that while the interiors could be called grand they are also whimsical and wonderfully comfortable.
1.3 Keys to Success
In order to succeed, the Vette Kat Harbour Bed & Breakfast will strive to achieve the following goals:
- Position the Vette Kat Harbour inn as the best B & B in the region among tourists and travelers.
- Build strong market position among the local patrons within a 120 mile radius.
- Maintain sound financial management of the venture.
- Link into the strongest referral engines and B & B Association engines for room bookings.
- Automate our full digital calendar and room night booking system onto our website.
- Offer unique experiences and service to our guests.
Company Summary
The Vette Kat Harbour Bed & Breakfast, located overlooking Vette Kat Harbour on our beautiful Caribbean island will offer a luxurious, quaint B & B for people to enjoy. The Vette Kat Harbour Bed & Breakfast will have seven individual rooms some with private baths, a central living room/socializing area, a garden patio, outdoor BBQ area and a Buccaneer Culinary Centre (housed in former out building) for its guests. Two of the guest rooms can be joined to form the Privateer Suite with a private kitchen, living room and outdoor sitting area and a separate entrance to offer a unique lodging experience. We are located within casual walking distance from the shore on a quite small town street.
The adjacent properties are of a matching elegant nature and charm up and down the street. The entire property next to us is owned by the church and quiet.
2.1 Company Ownership
The Vette Kat Harbour Bed & Breakfast will be a LLC of Kayman St. Lucia – who will be the owner. The B & B uses Mr. St. Lucia’s home as the inn.
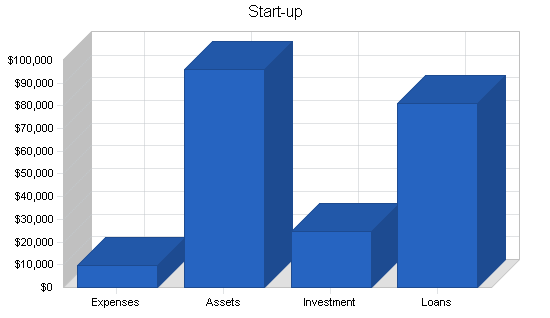
2.2 Start-up Summary
The Vette Kat Harbour Bed & Breakfast start-up expenses include:
- Home office equipment including: computer, copier, fax machine, extra telephone line, and filing cabinet.
- Wireless Internet network access for guests.
- Website creation.
- Advertising/association dues for the several B & B associations.
- Furnishings and linens for individual guest rooms.
- Pest Control Program set up.
- Tableware (China, Silverware, and glassware).
- Signage.
- Safety Programs (Fire) (Anti-slip).
We have budgeted $32,000.00 for initial, functional yet tasteful furnishings.
Our Bed and Room Linen Expenses Breakdown.
- Comforters – $700
- Sheets – $420
- Blankets – $350
- Pillows – $300
- Towels – $1,200
- Dust Ruffles – $140
- Robes – $1,680
- Total – $4,790
Equipment and Furnishings Expenses Breakdown.
- Computers – $2,800
- Computer Accessories – $300
- Computer Printers – $513
- Poster Printer – $800
- Router – $148
- Networking Cables – $156
- Furniture – $13,453
- Lamps – $150
- Artwork/Decorations – $1,843
- Accessories – $1,273
- Buccaneer Culinary Collection – $1,821
- Kitchen Equipment – $1,400
- Telephone Upgrade – $180
- Total – $24,840
Kayman St. Lucia will directly invest $25,000 in starting up the B & B. We plan on acquiring additional direct funding via a bank and backed by the SBA under an Island Economic Development loan package.
| Start-up | |
| Requirements | |
| Start-up Expenses | |
| Legal | $1,260 |
| Insurance | $2,903 |
| Licenses and Permits | $320 |
| B&B Associations & linking | $2,400 |
| Retrofit of Premises | $3,000 |
| – | $0 |
| Total Start-up Expenses | $9,883 |
| Start-up Assets | |
| Cash Required | $24,000 |
| Start-up Inventory | $2,500 |
| Other Current Assets | $13,667 |
| Long-term Assets | $56,000 |
| Total Assets | $96,167 |
| Total Requirements | $106,050 |
| Start-up Funding | |
| Start-up Expenses to Fund | $9,883 |
| Start-up Assets to Fund | $96,167 |
| Total Funding Required | $106,050 |
| Assets | |
| Non-cash Assets from Start-up | $72,167 |
| Cash Requirements from Start-up | $24,000 |
| Additional Cash Raised | $0 |
| Cash Balance on Starting Date | $24,000 |
| Total Assets | $96,167 |
| Liabilities and Capital | |
| Liabilities | |
| Current Borrowing | $0 |
| Long-term Liabilities | $81,210 |
| Accounts Payable (Outstanding Bills) | $0 |
| Other Current Liabilities (interest-free) | $0 |
| Total Liabilities | $81,210 |
| Capital | |
| Planned Investment | |
| Owner Investment | $24,840 |
| Other | $0 |
| Additional Investment Requirement | $0 |
| Total Planned Investment | $24,840 |
| Loss at Start-up (Start-up Expenses) | ($9,883) |
| Total Capital | $14,957 |
| Total Capital and Liabilities | $96,167 |
| Total Funding | $106,050 |
Services
The Vette Kat Harbour Bed & Breakfast is a small, attractive B & B that offers travelers, sailors, vacationers a relaxed, small town setting for a weekend getaway, change of scenery, family occassions, etc. Vette Kat Harbour Bed & Breakfast has a large central gathering room, an upstairs covered patio, and outside gardens that will allow travelers to socialize. The customers will receive the personal attention of Kayman St. Lucia and his family, who will meet any need a traveler has.
The Vette Kat Harbour Bed & Breakfast provides a gourmet breakfast feast and can meet any dietary restriction. Vette Kat Harbour Bed & Breakfast overlooks the beautiful Caribbean island harbour of Vette Kat, and is a comfortable casual from the seaside, through our small town.
3.1 Service Business Analysis
Although Bed and Breakfasts have been firmly established in Europe for years, they were introduced in the United States in the late 1960s. There are now more than 20,000 B & Bs, up from about 2,000 in 1979. A sign of a maturing industry is the increasing average number of rooms per property, increasing occupancy rates, and increasing number of associations and support services; i.e., national, state, and regional associations setting standards. There are now professional newsletters, travel publications, guidebooks, and vendors catering to small lodges. The rewards of being a Bed and Breakfast host include meeting people, adding income, gaining independence and an enjoyable way of life, and perhaps, restoring an old building. The business can give you great satisfaction as it grows into a valuable investment. As a host, your personality, distinctive and personalized hospitality, standards of excellence, and creative marketing can make a significant difference.
Importance of Image, Name, and Word-of-Mouth:
The personal image one projects and the reputation of a B & B can make the difference between success and failure. I need to promote myself as well as my B & B. I will be judged on how I dress, walk, speak, and interact. My attitude of caring and ability to make guests feel special will produce repeat and referral business. A good, lasting impression can be created by (1) front desk personal and telephone contact with guests; (2) the name of my B & B, my logo, slogan, and sign; (3) the design of my stationery and business cards; and (4) the eye-catching brochures and confirmation cards.
Coming up with a catchy name—one that sounds good, piques people’s curiosity, and tells something about the B & B—is an important marketing consideration. Given the nature of our island group as well as proximity to the rest of the tropical paradise of the Caribbean – I believe I have done a great job! The name alone can help generate customers. A consumer’s decision to select a B & B may involve actually visualizing or imagining what it may be like to stay in the B & B. B & Bs grow stronger by personal recommendations of customers and friends. Consumers generally ask trusted friends where to find a good B & B. It is the quality of the total B & B experience that makes the customer appreciative and talkative. Prospective owners/hosts need to be aware of how critical word-of-mouth public relations are in the growth of their B & B, thus one of our most important goals should be that every customer have an enjoyable experience.
There are hardly any B & B’s in the region. We are the first to be established on our island, though a few exist on neighboring isles.
Market Analysis Summary
The Vette Kat Harbour Bed & Breakfast has different target groups that it is attempting to attract. The first are people from the region that just want to get away for the weekend. They may have activities planned for the weekend on the sea, local towns or just chose to relax in a comfortable setting.
The second group are travelers who are sailing through the area and prefer to stay in B & Bs instead of a hotel/motel, or onboard their boat. This group also can also include vacationers who want a quiet convivial tropical destination away from the overstimulating mega-resorts.
Others will just want to have the experience of a themed weekend presented by Chef Kayman.
While Vette Kat Harbour Bed & Breakfast will certainly get customers that fall outside of these groups, this classification should be fairly accurate.
4.1 Market Segmentation
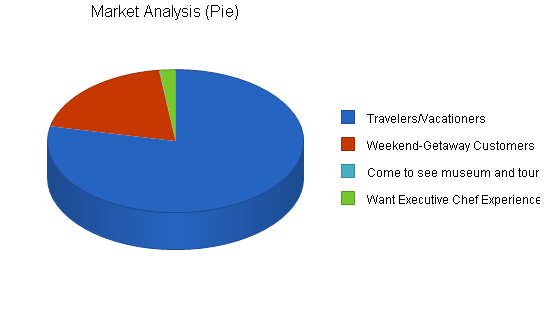
Our customers can be broadly divided into three groups (please note it is possible to divide the customers in to much smaller groups, but we have chosen not to):
- Weekend getaway customers. These people are from the region and are looking to get away from their life so they come to the Vette Kat Harbour Bed & Breakfast to be pampered and escape.
- Travelers/vacationers. These people, for whatever reason, are sailing among, or destination vacationing in the islands and prefer to stay in a B & B instead of a hotel/motel.
- Experience Executive Chef Service. These people will be wanting to visit to experience the service provided by Chef Kayman. They also will be interested in the historical information, collections, and other culinary items relating to the Caribbean Age of Sail in the Buccaneer Culinary Centre.
| Market Analysis | |||||||
| Year 1 | Year 2 | Year 3 | Year 4 | Year 5 | |||
| Potential Customers | Growth | CAGR | |||||
| Travelers/Vacationers | 9% | 964,982 | 1,051,830 | 1,146,495 | 1,249,680 | 1,362,151 | 9.00% |
| Weekend-Getaway Customers | 9% | 241,245 | 262,957 | 286,623 | 312,419 | 340,537 | 9.00% |
| Come to see museum and tour | 8% | 1,200 | 1,296 | 1,400 | 1,512 | 1,633 | 8.01% |
| Want Executive Chef Experience | 5% | 24,124 | 25,330 | 26,597 | 27,927 | 29,323 | 5.00% |
| Total | 8.92% | 1,231,551 | 1,341,413 | 1,461,115 | 1,591,538 | 1,733,644 | 8.92% |
4.2 Target Market Segment Strategy
The Vette Kat Harbour Bed & Breakfast intends to target these three customer groups as they make up the largest population of people who utilize B & B’s. The Vette Kat Harbour Bed & Breakfast has a three pronged strategy that will work for all these groups:
- Association membership and advertising. A large number of visitors will look to regional B & B associations for information about the different B & B’s in the area. Most associations publish a guide to the local B & B’s and the Vette Kat Harbour Bed & Breakfast wants to be in this guide. One of the other perks of membership is visibility on the associations website with a link to ours. Additionally, we will be a member of many Chambers of Commerce because people will typically inquire with the local Chambers when planning a vacation.
- Website. The Vette Kat Harbour Bed & Breakfast will have a full-service website that allows the visitor to view the B & B, read details about what it has to offer, provide information on regional activities, and even allow the visitor to book a reservation. With the growing use of the Internet, the Web has become an indispensable tool for planning vacations to areas that are not close enough to check out in person.
- Other Advertising. In many rest areas and on billboards, as well as lifestyle magazines such as food, travel.
- Events. Host Caribbean history and Buccaneer/Pirate/Age of Sail themed events on the grounds.
4.2.1 Marketing Strategy
The retail marketing strategy of the Vette Kat Harbour Bed & Breakfast centers on creating a corporate identity that clearly defines our market niche in terms that benefit our customer. Other specific strategies that will be used follow:
- Print Ads – Keeping the the Vette Kat Harbour Bed & Breakfast name in front of the customer while getting established will be necessary. We plan on running limited space ads in the local newspapers to keep our name and phone number in front of the consumer. We may attempt to showcase a single product in an effort to return revenue from the ad. Our past experience has been that showing measurable revenue from these types of ads is difficult. In the future we plan on utilizing vacation magazines and affluent Caribbean basin magazines as a method of increasing our sales revenue.
- Press Releases – The local papers and magazines have offered to run releases and/or stories concerning the opening of the Vette Kat Harbour Bed & Breakfast. We will also use the above media to run new art releases showcased in the B & B monthly.
- Unique Artist and Historic Gallery in House: The Vette Kat Harbour Bed & Breakfast will be the home to a local and unique artist who has all of their works displayed throughout the inn. All of these items will be for sale. The home is therefore populated with free and beautiful works. Also, each month on the second Wednesday, we will host a wine (non-alcoholic), cider and cheese night with historic unveiling of “this month’s work of art.”
- Designer Postcard – We will be holding a local contest for students to design a postcard for our guests to eventually buy. Our pricing for postcards is $110.00 per 1000 and includes aqueous glossy film coating. The winner of the annual contest will receive a cash scholarship and internship with us.
- Apparel – We know several people in the area who produce embroidered apparel such as will be on our robes. A line of premium Vette Kat Harbour Bed & Breakfast apparel could be designed and produced in very small runs to reduce inventory costs. These can be sold or given away with qualifying purchases to further expose the Vette Kat Harbour Bed & Breakfast name.
- Gourmet Dinners and Guest Speakers – Our gourmet dinners will be a blockbuster event. One of our guest chefs and guest speakers will be Walter Scheib III, the FOOD TV Iron Chef winner. Other guest chefs will be Roland Meisner, Pastry Chef for 25 years to the White House, and Patrick O’Connell of the Inn at Little Washington.
- Grand Opening – A Grand Opening is the most successful of any promotions. With manufacturer support, a large number of door prizes can be given away while instantly building a mailing list. Loss leader pricing on a few high volume consumable products will attract stories and traffic.
- Trade Shows, Chamber of Commerce meetings and Fairs – We will exhibit at approximately four regional trade shows annually.
- Word of Mouth – By giving first-time customers great service and a fair price, the word is sure to spread. Also, the many industry and business contacts that we already have in the area will prove to be most beneficial in spreading the word.
- Monthly Events – We will be hosting monthly specialty and themed events, initially emphasizing Caribbean history and the Buccaneer Age of Sail. We also will be hosting monthly events such as Valentines Day Lovers Getaways with Champagne, Chocolate samplers, Fresh Fruit and Cheese and masseuse services. We will have a different events each month with different specials/dinners.
All marketing decisions with regard to specific media choices, frequency, size, and expenditures will be conducted on an on-going basis with careful considerations of returns generated.
4.3 Competition and Buying Patterns
Competition comes in several forms:
Other B & Bs.
- Typically B & Bs have a set of unique features, something that makes them stand out.
- Some B & Bs will create uniqueness down to the level of different rooms within the B & B. We will be doing that. The size of a B & Bs range from one or two room (traditionally called a home stay) to a country inn with 30 rooms.
- On average most B & Bs have only a couple of rooms and are often booked up in advance. Particularly during special events, demand outstrips supply for the B & Bs.
- The B & Bs differentiate themselves by personal service offerings and the general ambiance of the Inn. Finally, B & Bs usually have a very nice sit down breakfast for their guests (Ours will be extensive and homemade with jams, preserves and jellies as well as Applewood Thick Cut Bacon and healthy options). This is not a simple continental breakfast of juice, coffee, and a bagel, but an elaborate spread of gourmet food such as quiche, a portabello mushroom, fresh roasted garlic and sun dried tomato omelette, or some sort of fresh smoked fish.
- Guests of B & Bs are looking not just for a room to sleep in but the whole experience in staying in a lovely setting, with interesting people to chat with and people present to pamper them in any way possible.
Hotels/motels.
- These facilities are generally much more sterile in character relative to B & Bs.
- The rooms are typically the same throughout the facility (unlike B & Bs where each room is typically different). The guests of hotels generally use the hotel as a place to stay at night.
- The operator will usually see the guest when they check in and when they check out. This differs from a B & B where the guests are encouraged to spend time in communal rooms and socialize with the operators and the other guests.
- Breakfasts, if included, are sparse. Even at the Hampton or Holiday Inn Express. The typical guests are looking for a room to stay in at night and not much more than that.
Strategy and Implementation Summary
The Vette Kat Harbour Bed & Breakfast will be using advertising and membership in associations to drive prospective customers. They will also use their website as a complete source of information about the B & B. Kayman will then turn these leads into customers through unsurpassed attentiveness in one-on-one phone inquiries/conversations.
5.1 SWOT Analysis
The SWOT analysis provides us with an opportunity to examine the internal strengths and weaknesses the Vette Kat Harbour Bed & Breakfast must address. It also allows us to examine the opportunities presented to us as well as potential threats.
The Vette Kat Harbour Bed & Breakfast has a valuable inventory of strengths that will help it succeed. These strengths include: a knowledgeable and friendly staff, state-of-the-art computer hardware, software, website, full 100% in house graphics production (avoiding massive costs outside) for weekly events and flyers and a clear vision of the market need. We also will go GREEN with most of our energy and wastes, have a victory garden, Buccaneer Culinary Centre, provide tours and unique interaction with the innkeeper. Our offerings of food for breakfast (such as a Portobello Mushroom and Sun-dried Fritatta (Egg Beaters)), home-made jellies, jams and preserves on croissants with all-you can eat down-home flapjacks and Vermont Maple syrup, hand-squeezed Orange Juice (or choice of six juices) as well as other items will be impossible to match.
Strengths are valuable, but it is also important to realize the weaknesses the Vette Kat Harbour Bed & Breakfast must address. These weaknesses include: lower priced rooms locally in regular hotels, loyalty card programs with multi-million enrollments and superior signage and networking.
5.2 Competitive Edge
The Vette Kat Harbour Bed & Breakfast two competitive advantages are:
Attention to personalized service.
- While anyone at a B & B should reasonably expect good service, there are ways of setting yourself apart.
- This will be done through the unrelenting pursuit of personal attention. In the area there are no B & Bs that offer outstanding service.
- The feeling of personal attention, or more accurately defined as a sense of person concern, really adds a positive dimension to the B & B experience. Not only will Kayman be offering personal concern, but he will be providing the concern, not some employee. This will be an enchanted place of customer service standards few if ever experienced. No request will ever be too small, such as breakfast in bed or in your room!
Uniqueness and beauty of the facility.
- The Vette Kat Harbour Bed & Breakfast will be housed in the St. Lucia home.
- One unique aspect of the Vette Kat Harbour Bed & Breakfast is the setting within the town of Grover which was renamed after the President of the United States, Grover Cleveland, when he visited. The setting is a beautiful lawn and yard in back. A lovely porch with white rocking chairs spans the massive front of the home.
- To compliment this setting, the Vette Kat Harbour Bed & Breakfast will have a large outside patio allowing guests to spend relaxing time outside with a nice view of the harbour and mountains.
5.3 Sales Strategy
The Vette Kat Harbour Bed & Breakfast sales strategy will be multi-pronged:
Sales strategy regarding breakfasts and dinners.
I was supposed to have become an actor but soon found the living theater of the inn and restaurant world more compelling than the stage. Running an inn and restaurant allows me to be the producer, director, set designer, and lead player in a wonderfully fractured daily performance (with dinners weekend nights for staying guests) in which the world of complete illusion in the dining room is brilliantly juxtaposed with the blood-and-guts reality of the kitchen. Sometimes it seems like a Broadway show that won’t quit – calamities happen, but somehow the show still opens every night.
Ever since I opened my first resort in 1987, I’ve never really thought of myself as “hosting” an inn, hotel or resort – just a hideaway with a manager who likes to entertain, clean and decorate – a lot! For over 26 years it has felt as if I’ve been hosting one continuous party whether at Country Clubs or resorts or restaurants. A successful party, like a great film or work of art, elevates the spirit, makes people feel life is worth living and enhances a guest’s self esteem.
We will try to convey a sense of place at the Vette Kat Harbour Bed & Breakfast by making use of the abundance of wonderful products from our region, which the French call a “cuisine de terroir.” We will try to elevate these fine, earthy ingredients and use them in unique and interesting new ways while still preserving the soulful flavors and memories we associate with them. Most of my favorite dishes are the simplest and depend on a few ingredients of the finest quality. I like food to appear effortless in its presentation – as though it dropped on the plate from the sky or was blown on it by a gentle breeze – never touched by human hands – or stacked and tortured as was the trend for a while.
It has taken me a long time to realize that what I’ve been doing over the last quarter century is evolving and refining many of the dishes I grew up with and making them relevant to a new century while keeping their soul intact — building a sort of culinary bridge between the past and future.
Personal attention in regard to calls of inquiry.
It is Kayman’s strategy to be willing to spend a fair amount of time on the phone with prospective clients. While most B & Bs will be pleasant on the phone and willing to answer any question, the sooner they are off the phone, the sooner they can get back to the work they were previously doing.
Kayman has the attitude that the more time he can spend on the phone with inquiries, the more likely he will be able to turn them into customers.
Very detailed website.
Kayman recognizes that over 95% of his clients have Web access and 80% used the Web to research their vacations. This usage is compelling enough to have a comprehensive website that offers enough information to allow the visitor to make a decision to stay at the Vette Kat Harbour Bed & Breakfast.
The website will have 3D walk-through tours allowing people to see the different bedrooms as well as common areas. Online pricing and reservations are also available as well as a resource page that details the different activities in the area.
While Kayman would like to encourage people to call with questions, if they do not they will be able to answer almost all questions with the website.
5.3.1 Sales Forecast
The home has seven different rooms. December will be used for furnishing rooms and adding safety features. By January 2008 the B & B will be ready to go. Kayman will have already been advertising, become a member of several B & B Associations with online bookings as well as have formed a strategic relationship with the Chambers of Commerce so business will ramp up fairly quickly.
In accordance with the 98-page “Developing a Bed & Breakfast Business Plan” (as was published by Purdue University and the University of Illinois) calling for first year occupancy rates of between 10% and 25% we agree that the median of this study would be 18.5%. We do not seek to argue that we would have lower than predicted occupancy (at the low end of 10%) or higher (at the high end of 25%). We would agree that the median is 18.5%. In our studies of the area we did not feel we could predict average or median first year occupancies – we felt that we could exceed that and be near the higher end.
However, for financing sake, we thought it best to present first-year occupancy at lower than even the median. Accordingly, our prediction starting in month one, January 2008 shows a 15% occupancy. From there a sliding upward scale of 10% increase continues month-by-month and 10% year-by-year.
We used the following formulas for the sales forecast of rooms and suites.
Room night @ 110.00 per night (5) (23 p/month) 365/15%=54.75 x 5 rooms=273.75 nights per yr/12 =
Suite night @ 175.00 per night (2) (9 p/month) 365/15%=54.75 x 2 rooms=109.5 nights per yr/12 =
Robert D. Espeseth
Coordinator, Illinois-Indiana Sea
Grant Program Recreation Specialist
University of Illinois Cooperative
Extension Service
Robert D. Buchanan
Extension Specialist, Restaurant,
Hotel and Institutional Management
Purdue University

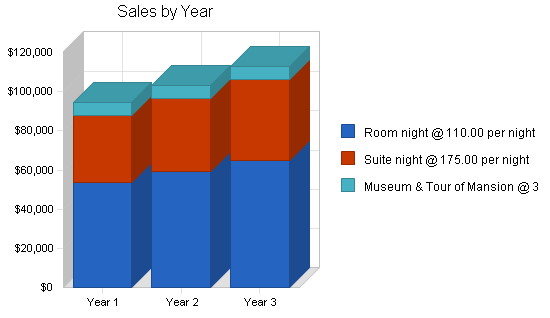
| Sales Forecast | |||
| Year 1 | Year 2 | Year 3 | |
| Sales | |||
| Room night @ 110.00 per night | $53,653 | $59,018 | $64,920 |
| Suite night @ 175.00 per night | $34,151 | $37,566 | $41,323 |
| Museum & Tour of Mansion @ 3.00 pp | $6,415 | $6,600 | $6,800 |
| Total Sales | $94,219 | $103,184 | $113,043 |
| Direct Cost of Sales | Year 1 | Year 2 | Year 3 |
| Room night @ 20.00 cost | $5,520 | $5,796 | $6,085 |
| Suite night @ 30.00 cost | $3,240 | $3,402 | $3,572 |
| Museum and Tour of Mansion | $480 | $500 | $520 |
| Subtotal Direct Cost of Sales | $9,240 | $9,698 | $10,177 |
5.4 Milestones
The Vette Kat Harbour Bed & Breakfast will have several milestones early on:
- Business plan completion. This will be done as a road map for the organization. While we do not need a business plan to raise extended capital, it will be an indispensable tool for the ongoing performance and improvement of the company.
- Joining the different associations. This is, in effect, the coming out party for announcing to the world that you are a real B & B, ready for business.
- Completion of the facility renovations.
- Our 100th client.
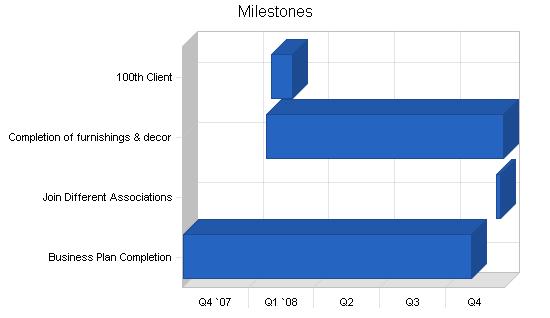
| Milestones | |||||
| Milestone | Start Date | End Date | Budget | Manager | Department |
| Business Plan Completion | 10/1/2007 | 11/6/2008 | $2,800 | Jenné Sequa | Business |
| Join Different Associations | 12/10/2008 | 12/16/2008 | $2,400 | Kayman St. Lucia | Marketing |
| Completion of furnishings & decor | 12/20/2008 | 1/25/2008 | $32,000 | Kayman St. Lucia | Design |
| 100th Client | 2/1/2008 | 3/1/2008 | $400 | Dominica Martlet | Marketing |
| Totals | $37,600 | ||||
Web Plan Summary
The firms of Nevis Associates and Antigua Associates will build an e-commerce enabled platform and website for the Vette Kat Harbour Bed & Breakfast. SuperInn will be used for advanced room booking software and full credit card integration.
The website will encompass the award winning photography of Ms. Jenné Sequa and Mr. Kayman St. Lucia. It’s design will be simple yet elegant.
Search Engine strategies will be provided for linking into 2000+ search engines (inclusive of top shelf AOL, MSN, Yahoo!, Google, etc.) via WebPosition Gold.
Some limited Google AdWords will be used. Overture Networks SEO strategies created by Max Nevis will be employed.
Local linking via BBB and COC with others will take place as will BBOnline and ABBA.
We will also link into the various promotional schemes for significant events held on all the local islands.
6.1 Website Marketing Strategy
Market strategy in an Internet room-booking business depends on recognition of expertise by the consumer. For the Vette Kat Harbour Bed & Breakfast, it will start with our existing brick-and-mortar customer base, informing them of our Internet presence and encouraging their word-of-mouth recommendations to others. Further awareness will be heightened by utilizing search engine marketing, banner advertising, and affiliates.
Management Summary
The Vette Kat Harbour Bed & Breakfast is owned and operated by Kayman St. Lucia. It will be a LLC.
- Kayman has a degree in Culinary Arts and an MBA in Restaurant Management.
- Kayman recently earned his Master Certified Food Executive (MCFE) designation at SUNY New York State Morrisville College by the International Food Service Executives Association.
- He earned certification as a licensed hotel manager for a world-wide hotel chain.
- He has 21 years food service experience in various military venues.
- He was general manager of a highly successful Bed & Breakfast in downtown Philadelphia, and prior to that assistant manager for a 1500-room resort in Florida.
He has dreamed of someday having a B & B run from his house, with the excitement of taking care of travelers and never-ending visitors. He is ready to share the fun and stories of his years of experience, as well as display is collection of historical artifacts and information from the Caribbean’s Buccaneering Age of Sail.
Kayman’s education coupled with his practical experiences has given him the ideal skill-set required for operating a B & B. The only other thing that is truly required is passion, and Kayman recognized his passion in serving which he has displayed in many positions and tasks. Kayman has everything needed to succeed and will fulfill his destiny.
Kayman will be assisted by his wife Jenné Sequa who is a professional in the Human Resources field who also has accounting and payroll experience, and who is a qualified banquet chef. She is able to help him in any task needed, administrative, cooking, cleaning and/or guest services.
7.1 Personnel Plan
Initially Kayman St. Lucia will continue working for his current employer, and will not take a salary from Vette Kat Harbour B & B until September and the start of the prime tourist season.
Jenné Sequa will handle the bulk of the day-to-day operations, front desk, and bookkeeping. She will begin taking a salary in month three, to assure positive cash balance. Jenné also has additional income from her home-based bookkeeping business.
The inn will also employ part-time help to assist with housekeeping, landscaping, and maintenance chores.
| Personnel Plan | |||
| Year 1 | Year 2 | Year 3 | |
| Kayman | $0 | $0 | $0 |
| Jenne | $0 | $0 | $0 |
| Housekeeping/Grounds Maintenance | $0 | $0 | $0 |
| Total People | 0 | 0 | 0 |
| Total Payroll | $0 | $0 | $0 |
Financial Plan
The following sections will detail important financial information.
8.1 Important Assumptions
The following table highlights some of the important financial assumptions for the Vette Kat Harbour Bed & Breakfast.
| General Assumptions | |||
| Year 1 | Year 2 | Year 3 | |
| Plan Month | 1 | 2 | 3 |
| Current Interest Rate | 6.00% | 6.00% | 6.00% |
| Long-term Interest Rate | 6.00% | 6.00% | 6.00% |
| Tax Rate | 13.00% | 13.00% | 13.00% |
| Other | 0 | 0 | 0 |
8.2 Break-even Analysis
The Break-even Analysis indicates the monthly revenue we must exceed to break even. This will fluctuate as the business plan is recalculated in the first twelve months of usage of utilities and advertising costs.

| Break-even Analysis | |
| Monthly Revenue Break-even | $1,820 |
| Assumptions: | |
| Average Percent Variable Cost | 10% |
| Estimated Monthly Fixed Cost | $1,642 |
8.3 Projected Profit and Loss
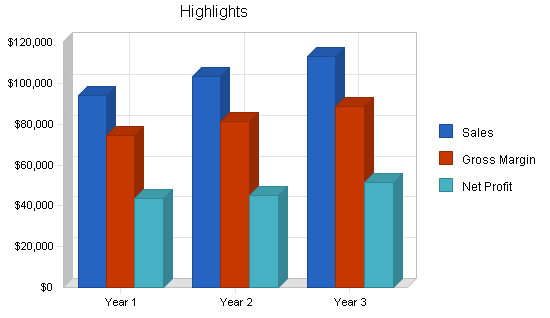
The following table indicates projected, modest profits.


| Pro Forma Profit and Loss | |||
| Year 1 | Year 2 | Year 3 | |
| Sales | $94,219 | $103,184 | $113,043 |
| Direct Cost of Sales | $9,240 | $9,698 | $10,177 |
| Other | $10,320 | $12,320 | $14,320 |
| Total Cost of Sales | $19,560 | $22,018 | $24,497 |
| Gross Margin | $74,659 | $81,166 | $88,546 |
| Gross Margin % | 79.24% | 78.66% | 78.33% |
| Expenses | |||
| Payroll | $0 | $0 | $0 |
| Sales & Marketing & Other Expenses | $6,500 | $10,000 | $10,000 |
| Depreciation | $1,200 | $1,200 | $1,200 |
| Annual web and Assoc fees | $1,200 | $1,600 | $1,700 |
| Utilities | $7,200 | $7,600 | $7,800 |
| Payroll Tax | $0 | $0 | $0 |
| Insurance | $3,600 | $4,800 | $5,000 |
| Total Operating Expenses | $19,700 | $25,200 | $25,700 |
| Profit Before Interest and Taxes | $54,959 | $55,966 | $62,846 |
| EBITDA | $56,159 | $57,166 | $64,046 |
| Interest Expense | $4,639 | $4,225 | $3,793 |
| Taxes Incurred | $6,542 | $6,726 | $7,677 |
| Net Profit | $43,779 | $45,015 | $51,376 |
| Net Profit/Sales | 46.46% | 43.63% | 45.45% |
8.4 Projected Cash Flow
The following chart and table will indicate projected cash flow.

| Pro Forma Cash Flow | |||
| Year 1 | Year 2 | Year 3 | |
| Cash Received | |||
| Cash from Operations | |||
| Cash Sales | $94,219 | $103,184 | $113,043 |
| Subtotal Cash from Operations | $94,219 | $103,184 | $113,043 |
| Additional Cash Received | |||
| Sales Tax, VAT, HST/GST Received | $12,248 | $13,414 | $14,696 |
| New Current Borrowing | $0 | $0 | $0 |
| New Other Liabilities (interest-free) | $0 | $0 | $0 |
| New Long-term Liabilities | $0 | $0 | $0 |
| Sales of Other Current Assets | $0 | $0 | $0 |
| Sales of Long-term Assets | $0 | $0 | $0 |
| New Investment Received | $0 | $0 | $0 |
| Subtotal Cash Received | $106,468 | $116,598 | $127,739 |
| Expenditures | Year 1 | Year 2 | Year 3 |
| Expenditures from Operations | |||
| Cash Spending | $0 | $0 | $0 |
| Bill Payments | $45,254 | $56,845 | $60,357 |
| Subtotal Spent on Operations | $45,254 | $56,845 | $60,357 |
| Additional Cash Spent | |||
| Sales Tax, VAT, HST/GST Paid Out | $12,248 | $13,414 | $14,696 |
| Principal Repayment of Current Borrowing | $0 | $0 | $0 |
| Other Liabilities Principal Repayment | $0 | $0 | $0 |
| Long-term Liabilities Principal Repayment | $7,200 | $7,200 | $7,200 |
| Purchase Other Current Assets | $0 | $0 | $0 |
| Purchase Long-term Assets | $0 | $0 | $0 |
| Dividends | $0 | $0 | $0 |
| Subtotal Cash Spent | $64,703 | $77,459 | $82,253 |
| Net Cash Flow | $41,765 | $39,139 | $45,486 |
| Cash Balance | $65,765 | $104,904 | $150,390 |
8.5 Projected Balance Sheet
The following table will indicate the projected balance sheet. Bankers and CPA’s will notice that excessive funds are reported being raised, initially. This is a contingency and prudent safety fund. It may prove cost effective and intelligent to place that into the SBA PE bank’s savings fund or mutually accessible program yielding a good rate.
| Pro Forma Balance Sheet | |||
| Year 1 | Year 2 | Year 3 | |
| Assets | |||
| Current Assets | |||
| Cash | $65,765 | $104,904 | $150,390 |
| Inventory | $847 | $889 | $933 |
| Other Current Assets | $13,667 | $13,667 | $13,667 |
| Total Current Assets | $80,279 | $119,460 | $164,990 |
| Long-term Assets | |||
| Long-term Assets | $56,000 | $56,000 | $56,000 |
| Accumulated Depreciation | $1,200 | $2,400 | $3,600 |
| Total Long-term Assets | $54,800 | $53,600 | $52,400 |
| Total Assets | $135,079 | $173,060 | $217,390 |
| Liabilities and Capital | Year 1 | Year 2 | Year 3 |
| Current Liabilities | |||
| Accounts Payable | $2,333 | $2,499 | $2,653 |
| Current Borrowing | $0 | $0 | $0 |
| Other Current Liabilities | $0 | $0 | $0 |
| Subtotal Current Liabilities | $2,333 | $2,499 | $2,653 |
| Long-term Liabilities | $74,010 | $66,810 | $59,610 |
| Total Liabilities | $76,343 | $69,309 | $62,263 |
| Paid-in Capital | $24,840 | $24,840 | $24,840 |
| Retained Earnings | ($9,883) | $33,896 | $78,911 |
| Earnings | $43,779 | $45,015 | $51,376 |
| Total Capital | $58,736 | $103,751 | $155,128 |
| Total Liabilities and Capital | $135,079 | $173,060 | $217,390 |
| Net Worth | $58,736 | $103,751 | $155,128 |
8.6 Business Ratios
The business ratios reflect both a cross-sectional analysis and time-series analysis of the company’s risk and profitability. The cross-sectional analysis consists of a comparison of our firm’s ratios and those of the hotel and motel industry, NAICS code 72110, averages. The reader will note that there are some significant differences in the ratios, especially in regards to the way our company is leveraged. This is due to the fact that industry averages also include very large hotel chains that usually have much higher capital costs and investments in long-term assets. Furthermore, the Vette Kat Harbour B & B has lower SG&A costs than other hotels and motels since B & Bs usually provide fewer services than larger competitors.
| Ratio Analysis | ||||
| Year 1 | Year 2 | Year 3 | Industry Profile | |
| Sales Growth | 0.00% | 9.52% | 9.55% | 7.24% |
| Percent of Total Assets | ||||
| Inventory | 0.63% | 0.51% | 0.43% | 1.35% |
| Other Current Assets | 10.12% | 7.90% | 6.29% | 24.20% |
| Total Current Assets | 59.43% | 69.03% | 75.90% | 29.12% |
| Long-term Assets | 40.57% | 30.97% | 24.10% | 70.88% |
| Total Assets | 100.00% | 100.00% | 100.00% | 100.00% |
| Current Liabilities | 1.73% | 1.44% | 1.22% | 16.94% |
| Long-term Liabilities | 54.79% | 38.61% | 27.42% | 26.60% |
| Total Liabilities | 56.52% | 40.05% | 28.64% | 43.54% |
| Net Worth | 43.48% | 59.95% | 71.36% | 56.46% |
| Percent of Sales | ||||
| Sales | 100.00% | 100.00% | 100.00% | 100.00% |
| Gross Margin | 79.24% | 78.66% | 78.33% | 100.00% |
| Selling, General & Administrative Expenses | 138.22% | 42.64% | 43.67% | 75.85% |
| Advertising Expenses | 5.03% | 1.22% | 1.09% | 2.17% |
| Profit Before Interest and Taxes | 58.33% | 54.24% | 55.59% | 0.35% |
| Main Ratios | ||||
| Current | 34.41 | 47.80 | 62.20 | 0.98 |
| Quick | 34.05 | 47.45 | 61.85 | 0.75 |
| Total Debt to Total Assets | 56.52% | 40.05% | 28.64% | 58.28% |
| Pre-tax Return on Net Worth | 85.67% | 49.87% | 38.07% | 0.29% |
| Pre-tax Return on Assets | 37.25% | 29.90% | 27.16% | 0.70% |
| Additional Ratios | Year 1 | Year 2 | Year 3 | |
| Net Profit Margin | 46.46% | 43.63% | 45.45% | n.a |
| Return on Equity | 74.54% | 43.39% | 33.12% | n.a |
| Activity Ratios | ||||
| Inventory Turnover | 9.94 | 11.17 | 11.17 | n.a |
| Accounts Payable Turnover | 20.40 | 22.81 | 22.81 | n.a |
| Payment Days | 14 | 15 | 16 | n.a |
| Total Asset Turnover | 0.70 | 0.60 | 0.52 | n.a |
| Debt Ratios | ||||
| Debt to Net Worth | 1.30 | 0.67 | 0.40 | n.a |
| Current Liab. to Liab. | 0.03 | 0.04 | 0.04 | n.a |
| Liquidity Ratios | ||||
| Net Working Capital | $77,946 | $116,961 | $162,338 | n.a |
| Interest Coverage | 11.85 | 13.25 | 16.57 | n.a |
| Additional Ratios | ||||
| Assets to Sales | 1.43 | 1.68 | 1.92 | n.a |
| Current Debt/Total Assets | 2% | 1% | 1% | n.a |
| Acid Test | 34.05 | 47.45 | 61.85 | n.a |
| Sales/Net Worth | 1.60 | 0.99 | 0.73 | n.a |
| Dividend Payout | 0.00 | 0.00 | 0.00 | n.a |
Appendix
| Sales Forecast | |||||||||||||
| Month 1 | Month 2 | Month 3 | Month 4 | Month 5 | Month 6 | Month 7 | Month 8 | Month 9 | Month 10 | Month 11 | Month 12 | ||
| Sales | |||||||||||||
| Room night @ 110.00 per night | 10% | $2,509 | $2,760 | $3,036 | $3,339 | $3,673 | $4,041 | $4,445 | $4,889 | $5,378 | $5,916 | $6,508 | $7,158 |
| Suite night @ 175.00 per night | 10% | $1,597 | $1,757 | $1,932 | $2,126 | $2,338 | $2,572 | $2,829 | $3,112 | $3,423 | $3,766 | $4,142 | $4,556 |
| Museum & Tour of Mansion @ 3.00 pp | 10% | $300 | $330 | $363 | $399 | $439 | $483 | $531 | $585 | $643 | $707 | $778 | $856 |
| Total Sales | $4,406 | $4,847 | $5,331 | $5,864 | $6,451 | $7,096 | $7,805 | $8,586 | $9,445 | $10,389 | $11,428 | $12,571 | |
| Direct Cost of Sales | Month 1 | Month 2 | Month 3 | Month 4 | Month 5 | Month 6 | Month 7 | Month 8 | Month 9 | Month 10 | Month 11 | Month 12 | |
| Room night @ 20.00 cost | $460 | $460 | $460 | $460 | $460 | $460 | $460 | $460 | $460 | $460 | $460 | $460 | |
| Suite night @ 30.00 cost | $270 | $270 | $270 | $270 | $270 | $270 | $270 | $270 | $270 | $270 | $270 | $270 | |
| Museum and Tour of Mansion | $40 | $40 | $40 | $40 | $40 | $40 | $40 | $40 | $40 | $40 | $40 | $40 | |
| Subtotal Direct Cost of Sales | $770 | $770 | $770 | $770 | $770 | $770 | $770 | $770 | $770 | $770 | $770 | $770 | |
| General Assumptions | |||||||||||||
| Month 1 | Month 2 | Month 3 | Month 4 | Month 5 | Month 6 | Month 7 | Month 8 | Month 9 | Month 10 | Month 11 | Month 12 | ||
| Plan Month | 1 | 2 | 3 | 4 | 5 | 6 | 7 | 8 | 9 | 10 | 11 | 12 | |
| Current Interest Rate | 6.00% | 6.00% | 6.00% | 6.00% | 6.00% | 6.00% | 6.00% | 6.00% | 6.00% | 6.00% | 6.00% | 6.00% | |
| Long-term Interest Rate | 6.00% | 6.00% | 6.00% | 6.00% | 6.00% | 6.00% | 6.00% | 6.00% | 6.00% | 6.00% | 6.00% | 6.00% | |
| Tax Rate | 13.00% | 13.00% | 13.00% | 13.00% | 13.00% | 13.00% | 13.00% | 13.00% | 13.00% | 13.00% | 13.00% | 13.00% | |
| Other | 0 | 0 | 0 | 0 | 0 | 0 | 0 | 0 | 0 | 0 | 0 | 0 | |
| Pro Forma Profit and Loss | |||||||||||||
| Month 1 | Month 2 | Month 3 | Month 4 | Month 5 | Month 6 | Month 7 | Month 8 | Month 9 | Month 10 | Month 11 | Month 12 | ||
| Sales | $4,406 | $4,847 | $5,331 | $5,864 | $6,451 | $7,096 | $7,805 | $8,586 | $9,445 | $10,389 | $11,428 | $12,571 | |
| Direct Cost of Sales | $770 | $770 | $770 | $770 | $770 | $770 | $770 | $770 | $770 | $770 | $770 | $770 | |
| Other | $860 | $860 | $860 | $860 | $860 | $860 | $860 | $860 | $860 | $860 | $860 | $860 | |
| Total Cost of Sales | $1,630 | $1,630 | $1,630 | $1,630 | $1,630 | $1,630 | $1,630 | $1,630 | $1,630 | $1,630 | $1,630 | $1,630 | |
| Gross Margin | $2,776 | $3,217 | $3,701 | $4,234 | $4,821 | $5,466 | $6,175 | $6,956 | $7,815 | $8,759 | $9,798 | $10,941 | |
| Gross Margin % | 63.00% | 66.37% | 69.43% | 72.21% | 74.73% | 77.03% | 79.12% | 81.02% | 82.74% | 84.31% | 85.74% | 87.03% | |
| Expenses | |||||||||||||
| Payroll | $0 | $0 | $0 | $0 | $0 | $0 | $0 | $0 | $0 | $0 | $0 | $0 | |
| Sales & Marketing & Other Expenses | $1,000 | $500 | $500 | $500 | $500 | $500 | $500 | $500 | $500 | $500 | $500 | $500 | |
| Depreciation | $100 | $100 | $100 | $100 | $100 | $100 | $100 | $100 | $100 | $100 | $100 | $100 | |
| Annual web and Assoc fees | $100 | $100 | $100 | $100 | $100 | $100 | $100 | $100 | $100 | $100 | $100 | $100 | |
| Utilities | $600 | $600 | $600 | $600 | $600 | $600 | $600 | $600 | $600 | $600 | $600 | $600 | |
| Payroll Tax | 15% | $0 | $0 | $0 | $0 | $0 | $0 | $0 | $0 | $0 | $0 | $0 | $0 |
| Insurance | $300 | $300 | $300 | $300 | $300 | $300 | $300 | $300 | $300 | $300 | $300 | $300 | |
| Total Operating Expenses | $2,100 | $1,600 | $1,600 | $1,600 | $1,600 | $1,600 | $1,600 | $1,600 | $1,600 | $1,600 | $1,600 | $1,600 | |
| Profit Before Interest and Taxes | $676 | $1,617 | $2,101 | $2,634 | $3,221 | $3,866 | $4,575 | $5,356 | $6,215 | $7,159 | $8,198 | $9,341 | |
| EBITDA | $776 | $1,717 | $2,201 | $2,734 | $3,321 | $3,966 | $4,675 | $5,456 | $6,315 | $7,259 | $8,298 | $9,441 | |
| Interest Expense | $403 | $400 | $397 | $394 | $391 | $388 | $385 | $382 | $379 | $376 | $373 | $370 | |
| Taxes Incurred | $35 | $158 | $222 | $291 | $368 | $452 | $545 | $647 | $759 | $882 | $1,017 | $1,166 | |
| Net Profit | $237 | $1,058 | $1,483 | $1,949 | $2,462 | $3,026 | $3,646 | $4,327 | $5,077 | $5,901 | $6,808 | $7,805 | |
| Net Profit/Sales | 5.39% | 21.84% | 27.81% | 33.24% | 38.16% | 42.64% | 46.71% | 50.40% | 53.76% | 56.80% | 59.57% | 62.08% | |
| Pro Forma Cash Flow | |||||||||||||
| Month 1 | Month 2 | Month 3 | Month 4 | Month 5 | Month 6 | Month 7 | Month 8 | Month 9 | Month 10 | Month 11 | Month 12 | ||
| Cash Received | |||||||||||||
| Cash from Operations | |||||||||||||
| Cash Sales | $4,406 | $4,847 | $5,331 | $5,864 | $6,451 | $7,096 | $7,805 | $8,586 | $9,445 | $10,389 | $11,428 | $12,571 | |
| Subtotal Cash from Operations | $4,406 | $4,847 | $5,331 | $5,864 | $6,451 | $7,096 | $7,805 | $8,586 | $9,445 | $10,389 | $11,428 | $12,571 | |
| Additional Cash Received | |||||||||||||
| Sales Tax, VAT, HST/GST Received | 13.00% | $573 | $630 | $693 | $762 | $839 | $922 | $1,015 | $1,116 | $1,228 | $1,351 | $1,486 | $1,634 |
| New Current Borrowing | $0 | $0 | $0 | $0 | $0 | $0 | $0 | $0 | $0 | $0 | $0 | $0 | |
| New Other Liabilities (interest-free) | $0 | $0 | $0 | $0 | $0 | $0 | $0 | $0 | $0 | $0 | $0 | $0 | |
| New Long-term Liabilities | $0 | $0 | $0 | $0 | $0 | $0 | $0 | $0 | $0 | $0 | $0 | $0 | |
| Sales of Other Current Assets | $0 | $0 | $0 | $0 | $0 | $0 | $0 | $0 | $0 | $0 | $0 | $0 | |
| Sales of Long-term Assets | $0 | $0 | $0 | $0 | $0 | $0 | $0 | $0 | $0 | $0 | $0 | $0 | |
| New Investment Received | $0 | $0 | $0 | $0 | $0 | $0 | $0 | $0 | $0 | $0 | $0 | $0 | |
| Subtotal Cash Received | $4,979 | $5,477 | $6,024 | $6,627 | $7,289 | $8,018 | $8,820 | $9,702 | $10,672 | $11,740 | $12,914 | $14,205 | |
| Expenditures | Month 1 | Month 2 | Month 3 | Month 4 | Month 5 | Month 6 | Month 7 | Month 8 | Month 9 | Month 10 | Month 11 | Month 12 | |
| Expenditures from Operations | |||||||||||||
| Cash Spending | $0 | $0 | $0 | $0 | $0 | $0 | $0 | $0 | $0 | $0 | $0 | $0 | |
| Bill Payments | $1,649 | $3,108 | $3,277 | $3,725 | $3,852 | $3,930 | $4,015 | $4,109 | $4,213 | $4,328 | $4,454 | $4,593 | |
| Subtotal Spent on Operations | $1,649 | $3,108 | $3,277 | $3,725 | $3,852 | $3,930 | $4,015 | $4,109 | $4,213 | $4,328 | $4,454 | $4,593 | |
| Additional Cash Spent | |||||||||||||
| Sales Tax, VAT, HST/GST Paid Out | $573 | $630 | $693 | $762 | $839 | $922 | $1,015 | $1,116 | $1,228 | $1,351 | $1,486 | $1,634 | |
| Principal Repayment of Current Borrowing | $0 | $0 | $0 | $0 | $0 | $0 | $0 | $0 | $0 | $0 | $0 | $0 | |
| Other Liabilities Principal Repayment | $0 | $0 | $0 | $0 | $0 | $0 | $0 | $0 | $0 | $0 | $0 | $0 | |
| Long-term Liabilities Principal Repayment | $600 | $600 | $600 | $600 | $600 | $600 | $600 | $600 | $600 | $600 | $600 | $600 | |
| Purchase Other Current Assets | $0 | $0 | $0 | $0 | $0 | $0 | $0 | $0 | $0 | $0 | $0 | $0 | |
| Purchase Long-term Assets | $0 | $0 | $0 | $0 | $0 | $0 | $0 | $0 | $0 | $0 | $0 | $0 | |
| Dividends | $0 | $0 | $0 | $0 | $0 | $0 | $0 | $0 | $0 | $0 | $0 | $0 | |
| Subtotal Cash Spent | $2,822 | $4,338 | $4,570 | $5,088 | $5,291 | $5,452 | $5,630 | $5,825 | $6,041 | $6,278 | $6,540 | $6,827 | |
| Net Cash Flow | $2,157 | $1,138 | $1,454 | $1,539 | $1,999 | $2,566 | $3,191 | $3,877 | $4,631 | $5,461 | $6,374 | $7,378 | |
| Cash Balance | $26,157 | $27,295 | $28,749 | $30,288 | $32,287 | $34,853 | $38,044 | $41,921 | $46,552 | $52,013 | $58,387 | $65,765 | |
| Pro Forma Balance Sheet | |||||||||||||
| Month 1 | Month 2 | Month 3 | Month 4 | Month 5 | Month 6 | Month 7 | Month 8 | Month 9 | Month 10 | Month 11 | Month 12 | ||
| Assets | Starting Balances | ||||||||||||
| Current Assets | |||||||||||||
| Cash | $24,000 | $26,157 | $27,295 | $28,749 | $30,288 | $32,287 | $34,853 | $38,044 | $41,921 | $46,552 | $52,013 | $58,387 | $65,765 |
| Inventory | $2,500 | $1,730 | $960 | $847 | $847 | $847 | $847 | $847 | $847 | $847 | $847 | $847 | $847 |
| Other Current Assets | $13,667 | $13,667 | $13,667 | $13,667 | $13,667 | $13,667 | $13,667 | $13,667 | $13,667 | $13,667 | $13,667 | $13,667 | $13,667 |
| Total Current Assets | $40,167 | $41,554 | $41,922 | $43,263 | $44,802 | $46,801 | $49,367 | $52,558 | $56,435 | $61,066 | $66,527 | $72,901 | $80,279 |
| Long-term Assets | |||||||||||||
| Long-term Assets | $56,000 | $56,000 | $56,000 | $56,000 | $56,000 | $56,000 | $56,000 | $56,000 | $56,000 | $56,000 | $56,000 | $56,000 | $56,000 |
| Accumulated Depreciation | $0 | $100 | $200 | $300 | $400 | $500 | $600 | $700 | $800 | $900 | $1,000 | $1,100 | $1,200 |
| Total Long-term Assets | $56,000 | $55,900 | $55,800 | $55,700 | $55,600 | $55,500 | $55,400 | $55,300 | $55,200 | $55,100 | $55,000 | $54,900 | $54,800 |
| Total Assets | $96,167 | $97,454 | $97,722 | $98,963 | $100,402 | $102,301 | $104,767 | $107,858 | $111,635 | $116,166 | $121,527 | $127,801 | $135,079 |
| Liabilities and Capital | Month 1 | Month 2 | Month 3 | Month 4 | Month 5 | Month 6 | Month 7 | Month 8 | Month 9 | Month 10 | Month 11 | Month 12 | |
| Current Liabilities | |||||||||||||
| Accounts Payable | $0 | $1,649 | $1,459 | $1,818 | $1,908 | $1,944 | $1,985 | $2,030 | $2,079 | $2,134 | $2,194 | $2,260 | $2,333 |
| Current Borrowing | $0 | $0 | $0 | $0 | $0 | $0 | $0 | $0 | $0 | $0 | $0 | $0 | $0 |
| Other Current Liabilities | $0 | $0 | $0 | $0 | $0 | $0 | $0 | $0 | $0 | $0 | $0 | $0 | $0 |
| Subtotal Current Liabilities | $0 | $1,649 | $1,459 | $1,818 | $1,908 | $1,944 | $1,985 | $2,030 | $2,079 | $2,134 | $2,194 | $2,260 | $2,333 |
| Long-term Liabilities | $81,210 | $80,610 | $80,010 | $79,410 | $78,810 | $78,210 | $77,610 | $77,010 | $76,410 | $75,810 | $75,210 | $74,610 | $74,010 |
| Total Liabilities | $81,210 | $82,259 | $81,469 | $81,228 | $80,718 | $80,154 | $79,595 | $79,040 | $78,489 | $77,944 | $77,404 | $76,870 | $76,343 |
| Paid-in Capital | $24,840 | $24,840 | $24,840 | $24,840 | $24,840 | $24,840 | $24,840 | $24,840 | $24,840 | $24,840 | $24,840 | $24,840 | $24,840 |
| Retained Earnings | ($9,883) | ($9,883) | ($9,883) | ($9,883) | ($9,883) | ($9,883) | ($9,883) | ($9,883) | ($9,883) | ($9,883) | ($9,883) | ($9,883) | ($9,883) |
| Earnings | $0 | $237 | $1,296 | $2,779 | $4,728 | $7,190 | $10,215 | $13,861 | $18,188 | $23,265 | $29,167 | $35,974 | $43,779 |
| Total Capital | $14,957 | $15,194 | $16,253 | $17,736 | $19,685 | $22,147 | $25,172 | $28,818 | $33,145 | $38,222 | $44,124 | $50,931 | $58,736 |
| Total Liabilities and Capital | $96,167 | $97,454 | $97,722 | $98,963 | $100,402 | $102,301 | $104,767 | $107,858 | $111,635 | $116,166 | $121,527 | $127,801 | $135,079 |
| Net Worth | $14,957 | $15,194 | $16,253 | $17,736 | $19,685 | $22,147 | $25,172 | $28,818 | $33,145 | $38,222 | $44,124 | $50,931 | $58,736 |
| Personnel Plan | |||||||||||||
| Month 1 | Month 2 | Month 3 | Month 4 | Month 5 | Month 6 | Month 7 | Month 8 | Month 9 | Month 10 | Month 11 | Month 12 | ||
| Kayman | 0% | $0 | $0 | $0 | $0 | $0 | $0 | $0 | $0 | $0 | $0 | $0 | $0 |
| Jenne | 0% | $0 | $0 | $0 | $0 | $0 | $0 | $0 | $0 | $0 | $0 | $0 | $0 |
| Housekeeping/Grounds Maintenance | 0% | $0 | $0 | $0 | $0 | $0 | $0 | $0 | $0 | $0 | $0 | $0 | $0 |
| Total People | 0 | 0 | 0 | 0 | 0 | 0 | 0 | 0 | 0 | 0 | 0 | 0 | |
| Total Payroll | $0 | $0 | $0 | $0 | $0 | $0 | $0 | $0 | $0 | $0 | $0 | $0 | |


