
Foosball Hall
Executive Summary
Foosball Hall is a new gaming hall and bar serving the Madison, Wisconsin community. Foosball or table soccer is an exciting table game originating from 1920’s Germany. The game involves two to four people in an exciting match that tests skill, strategy, and willingness to have fun. People, primarily male students, play foosball as an exciting alternative to pool. They are looking for skill oriented game that they can play in the social setting of a bar. While there are many different pool hall bars in Madison, there are no foosball bars even though the demand is quite apparent. Demand can be witnessed anywhere there is a foosball table. There are always lines of people waiting to play, and it is extremely rare to be able to walk up to an unused foosball table. Foosball Hall will meet the unmet demand in Madison, Wisconsin with a bar offering beer, food, beverages and plenty of foosball tables for casual play as well as tournaments.
Keys to Success
Foosball Hall has identified three keys that will be critical for their success. The first is the need to design and implement strict financial controls. This is particularly important for an establishment that serves alcohol, as employee theft is one of the largest drains on this type of business. The financial controls will help minimize this risk. The second key is the behavior of all employees toward customers – that each customer is treated as if they were the most important customer of Foosball Hall. The last key to success will be the constant analysis for improvement of the business model. It will be management’s task to continually analyze the business model looking for ways that it can be adjusted to increase profitability for the business. Foosball Hall will not assume that this business model is static, rather, they believe that in order to improve it must be dynamic.
Target Market Customers
Foosball Hall has identified two population target segments. The first segment is casual players of table games. This segment enjoys playing table games such as foosball or pool in a bar setting. They appreciate the opportunity to play a fun game while they consume beverages (alcoholic or not) and socialize with friends or strangers. This group is growing at the annual rate of 8% with 54,889 potential customers. The second segment of the population that will be targeted is competitive players. These people appreciate foosball for the same reasons as the casual players, however, this group is also quite competitive. They play foosball to win, either with friends or in a tournament and continually work on their skills to become better players. This segment has an annual growth rate of 7% and 12,445 potential customers.
Management
Foosball Hall will be lead by Stan Spinner. Stan received his undergraduate degree in Philosophy from University of Wisconsin-Stevens Point. While in college, Stan managed a pool hall. This was Stan’s first experience in a retail establishment and provided him with invaluable experience in tavern operations, as well as insight into customer habits and preferences. Recognizing that one day he wanted to run his own business, but was not comfortable with his incomplete skill set, Stan enrolled in the University of Wisconsin’s MBA Entrepreneurship Program. Stan went through the two year program with the intention of opening a foosball bar upon graduation. Having this goal in his head while taking the course work proved to be quite valuable as it became a lens through which Stan studied all the new material.
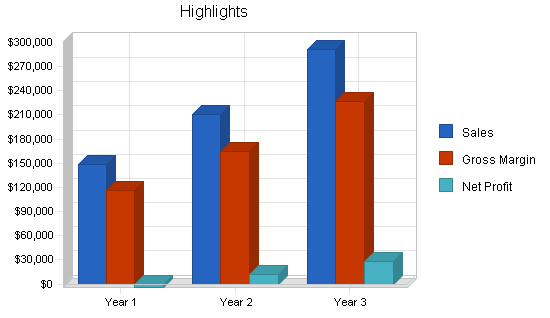
Foosball Hall is a start-up gaming (foosball) bar primarily serving the students of Madison. Sales have been forecast to be approximately $200,000 for year two, increasing to approximately $290,000 in year three. Net profit will be negative in year one, rising to a positive % in years two and three.
1.1 Keys to Success
Foosball Hall has identified several business elements that must be implemented in order to succeed in this competitive market.
- Employ strict financial controls. This is especially important for a bar where, without financial controls, employ theft could bring the business to bankruptcy.
- Treat every customer as though they are the most important customer to Foosball Hall.
- Continually look for improvements in the business model as well as operating systems.
1.2 Mission
It is Foosball Hall’s mission to become a premier night spot for Madison students and locals who are interested in playing table games and drinking. Foosball Hall will accomplish this by offering abundant foosball tables, beer, and food at reasonable prices. By providing the Madison market with the opportunity to participate in this increasingly popular table game, Foosball Hall will become a Madison favorite. The business will be operated on the premise that satisfied customers are imperative to a sustainable business.
1.3 Objectives
- To become one of the premier venues in Madison that offers table games (in this case specifically foosball), beer and food.
- To grow the game of foosball in Madison, adding legitimacy to the game and increasing the number and participation levels of the tournaments.
- Reach the point of sustainable profitability by year two.
Company Summary
Foosball Hall, a start-up business has been formed as a Wisconsin Limited Liability Corporation (L.L.C.) with the main purpose as a table game (foosball) operation that offers soft drinks, beer, and light food.
2.1 Company Ownership
Foosball Hall is an L.L.C. registered in Wisconsin. The L.L.C. business formation structure was chosen as a personal liability shield for the owner Stan Spinner. While Stan has outside investors who possess a note securing their investment, Stan is the majority owner.
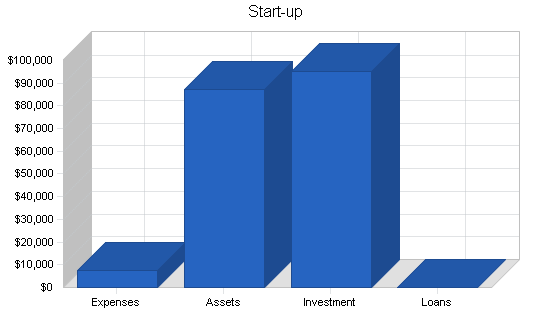
2.2 Start-up Summary
The following list details the expenses associated with the start up of this organization:
- Foosball tables: There are 10 U.S.-based manufacturers of tables. The specific vendor will be chosen soon based on a competitive bidding process. All of the manufacturers produce high quality tables and compete primarily on price. Foosball Hall is in need of 10 tables @ approximately $3,000 each. In addition to the tables, two large white boards will be needed for tournament play.
- Lighting: While the chosen space has lights for the area in general, additional lighting will need to be set up for proper table play.
- Stools, tables, counter top and chairs: These items will be purchased to provide a place for non-players to relax and socialize.
- Kitchen equipment: These are the items necessary for serving a bar menu and liquid refreshments. Needed items include: glasses, silverware, plates, microwave, convection oven, refrigerator and freezer, serving/cooking utensils, a beer tap system, a fountain dispenser for soft drinks.
- Attorney fees: The needed legal services include business formation advice and assistance, basic contract reviews, and general business advice.
- Consultants: A business consultant will be utilized for assistance in setting up various operating systems for the entity.
- Various marketing information such as brochures, stationery, etc.
- Website: The website will be developed as a form of communication regarding the activities of Foosball Hall and the game of foosball. This includes disseminating information regarding tournaments as well as advertising the fact that there is a place that offers foosball. There are numerous foosball associations that will then link Foosball Hall’s site to theirs for general game promotion.
Brought to you by
Create a professional business plan
Using AI and step-by-step instructions
Create Your PlanSecure funding
Validate ideas
Build a strategy
| Start-up | |
| Requirements | |
| Start-up Expenses | |
| Legal | $200 |
| Stationery etc. | $300 |
| Brochures | $200 |
| Consultants | $2,000 |
| Insurance | $0 |
| Rent | $0 |
| Research and Development | $0 |
| Expensed Equipment | $5,000 |
| Other | $0 |
| Total Start-up Expenses | $7,700 |
| Start-up Assets | |
| Cash Required | $44,300 |
| Other Current Assets | $3,000 |
| Long-term Assets | $40,000 |
| Total Assets | $87,300 |
| Total Requirements | $95,000 |
| Start-up Funding | |
| Start-up Expenses to Fund | $7,700 |
| Start-up Assets to Fund | $87,300 |
| Total Funding Required | $95,000 |
| Assets | |
| Non-cash Assets from Start-up | $43,000 |
| Cash Requirements from Start-up | $44,300 |
| Additional Cash Raised | $0 |
| Cash Balance on Starting Date | $44,300 |
| Total Assets | $87,300 |
| Liabilities and Capital | |
| Liabilities | |
| Current Borrowing | $0 |
| Long-term Liabilities | $0 |
| Accounts Payable (Outstanding Bills) | $0 |
| Other Current Liabilities (interest-free) | $0 |
| Total Liabilities | $0 |
| Capital | |
| Planned Investment | |
| Stan Spinner | $75,000 |
| Investor 2 | $20,000 |
| Other | $0 |
| Additional Investment Requirement | $0 |
| Total Planned Investment | $95,000 |
| Loss at Start-up (Start-up Expenses) | ($7,700) |
| Total Capital | $87,300 |
| Total Capital and Liabilities | $87,300 |
| Total Funding | $95,000 |
Products
Foosball
Foosball, or table soccer is a popular table game that looks sort of like a soccer game. The name is derived from the German word for field soccer which is fubball. The adopted name in the States is foosball or table soccer. The game itself originated in Germany during the late 1920’s and early 1930’s.
A fact that may come as a surprise to many is that foosball is played on a competitive (professional) level. There are several tours which exist with regional, national and international competitions. Within the U.S. there are two well established associations, United States Table Soccer Association and the American Table Soccer Federation. So while most participants are recreational players, there are many people who play foosball at a competitive level. The bulk of Foosball Hall customers are the recreational players.
Foosball Hall offers 10 different tables for foosball. Five days a week the tables are open to first-come/first-served play. Two days a week half of the tables will be reserved for league/tournament play. Customers are able to play foosball by paying an hourly rate. Players can either play games with people within their party or have pickup opponents. Foosball Hall serves a rotating tap of three beers as well as several bottled varieties. Other beverages include fountain soft drinks. Foosball Hall offers a light bar food menu of sandwiches and several different appetizer items.
So while foosball is the main attraction, i.e. why customers would choose Foosball Hall over another bar, the main source of revenue is from the offered food and beverages. The foosball revenue, both from individual play and from tournaments will help supplement the business, profitability depends on selling sufficient levels of food and drinks.
Offering foosball is an attractive service as many people enjoy participating in some sort of game while they are at a bar drinking and socializing. Foosball provides this entertainment, similar to pool and darts. Foosball offers the same challenge in terms of strategy and skill as pool and darts but makes the experience more fun and action oriented. So foosball can be said to be the best of both worlds, requiring skill and thought but at the same time being fun, fast paced action.
Market Analysis Summary
Foosball Hall has identified two target customer segments which are particularly attractive. The first segment customers are the more casual players who are looking for some sort of activity (such as foosball, pool, darts) to occupy their time as they socialize and drink. The second group comprises the competitive foosball players. This group travels to where ever there are tables.
While the two groups share the same interest in foosball, they are distinct groups and each one will need to be reached via different methods. Foosball Hall participates within the general pool hall industry, businesses that offer beer and pool typically. The foosball parlor industry is too small and new to have its own industry classification. While foosball is a very popular table game, there are just not enough foosball dedicated halls to have its own industry. Here lies the attractiveness of the industry, most of the foosball playing occurs on college campuses, there are few outside establishments that offer a pool-like foosball hall.
4.1 Market Segmentation
Foosball Hall has identified two distinct customer segments that they will target:
Casual players
This segment is typically made up of college men who enjoy playing foosball with their colleagues. This group of individuals typically plays to pass time and have fun as opposed to playing at a competitive level in tournaments. Characteristics of the individuals that make up this group are:
- Gender 85% male.
- Ages 17- 28.
- College students- 74% of the participants are in college or recently graduated from college.
- 69% play pool but prefer foosball because it combines similar levels of skill but at a much faster, exciting pace.
Competitive players
This group plays to win. Foosball is not about a fun way to pass time but a serious game at which they work hard, developing competitive skills. This group is far smaller but the individuals are active participants. There are two different manufacturer based associations for foosball and numerous different player based associations. In fact, as a testament to the level of seriousness, size and participation levels of these players, almost all states in the U.S. have their own associations. It is this group of people that will be the most active participants in the offered tournaments.
- Generally male- 89%.
- Ages 25-48.
The bulk of Foosball Hall’s customers are casual recreational players.

| Market Analysis | |||||||
| Year 1 | Year 2 | Year 3 | Year 4 | Year 5 | |||
| Potential Customers | Growth | CAGR | |||||
| Casual players | 8% | 54,889 | 59,280 | 64,022 | 69,144 | 74,676 | 8.00% |
| Competitive players | 7% | 12,445 | 13,316 | 14,248 | 15,245 | 16,312 | 7.00% |
| Total | 7.82% | 67,334 | 72,596 | 78,270 | 84,389 | 90,988 | 7.82% |
4.2 Target Market Segment Strategy
Foosball Hall will successfully target two distinct segments of the market. While both groups play foosball, the reasons that they play are different. Understanding this will help Foosball Hall accurately target the specific group. The first group while smaller in size is far more organized and will therefore be much easier to reach. Although seriously competitive players are growing in number, it is a select group of people that compete in foosball. With the advent of the Internet, this group has become quite organized in terms of associations, tournaments, and general awareness of each other. This being said, it is easy to reach this group through advertisements and networking with the different associations. The competitive players are always looking for new places to play, there are generally not enough tables to accommodate them. This will be the easiest group to reach. This group is talkative amongst themselves and always looking for new places and new tournaments.
The casual players will be more difficult to target. This group of people comes from a fairly large cross section of the population, people that like some sort of table game while they hang out with friends and drink beer. The obvious group to try to reach are college students. Madison was chosen in part because of its population of foosball players as well as the huge student population to draw off of. Students are the perfect segment of the population that likes to drink, play games, has disposable income, and has extra time for leisure activities. Additionally, foosball is a social game that requires two- four players. Even beyond the requirement for multiple players, when people play foosball it is typically in a social setting with socializing occurring during play. While there are some other casual players, most are or recently were college students.
4.3 Industry Analysis
Foosball is an untapped game market. While it is not uncommon to have a foosball table in a fraternity house, it is far less common to have one in a public place such as a bar. Most bar owners rationalize that not a lot of people really know how or care to play, therefore if they have to come up with a large capital expense of several thousand dollars, they would rather spend it on something that will appeal to a larger population. It is this mentality that has created the current state where there are many active players that play in one or two places all the time, and generally do not have other options of playing venues. The situation can be seen from a microlevel if you observe party goers at a party that has a foosball table. With one table at the entire party, the table is always in use. There are always more people that want to play than can play. It is a popular, fun game and there are never enough tables available.
Brought to you by
Create a professional business plan
Using AI and step-by-step instructions
Create Your PlanSecure funding
Validate ideas
Build a strategy
There are few commercial playing areas for foosball. Most foosball tables reside in private settings, either a home, fraternity house, etc. The real competitor in terms of industry are pool halls. While the games themselves are not similar, the reason people play and the type of people that play are quite similar. As mentioned previously, people play either as a source of game competition, or they play as a way to have fun and socialize. The users are quite similar as well, however, pool tends to attract an older crowd, or at least some older people. The pool hall/ table game hall industry operates primarily by selling beer and alcoholic beverages. Food and fountain drinks generate supplemental income. Most business occurs in the evening/ night time, as people use the occasions as a way to relax.
4.3.1 Competition and Buying Patterns
Competition is predominantly from pool halls and foosball tournaments.
Pool Halls
The pool halls are the alternative places, other than typical bars, that people go to to socialize and play games to pass the time. There are many different pool halls that serve the Madison student population. They are typically grouped by some sort of theme, maybe concentrating on the lower price point beer selection, maybe on the music, sometimes on the quality of the pool and billiards tables (typically a function of the skill level of the players and the use of the tables for tournaments). The pool halls are competitors for the casual players, people that are playing as a way to socialize, have fun, and pass the time.
Foosball Tournaments
Currently, the several tournaments that are held for the Madison area players take place in a community center recreation room that has six tables. There are no other public or semi-public areas that have more than a couple of tables available for play. So while the community center will still have tournaments, the facilities at Foosball Hall will be nicer and have more things to offer such as food and beer. By virtue of more and better tables, Foosball Hall will be able to attract plenty of people for the tournaments.
Indirect competition comes from other evening recreation activities, such as bars, movies, theatres, bowling alleys, etc.
Strategy and Implementation Summary
Foosball Hall will leverage the fact that they offer the finest (as well as the only) facility of numerous, nice, good condition foosball tables. This will be especially useful when competing for customers against the pool halls. Foosball has the same draw as pool, a game that is fun, social, and requires some skill, but is much more fun than pool. To be competitive at foosball, players must develop a strong skill set, however, the level of fun is accessible to all skill levels. Therefore, foosball generates more fun than pool, a distinction that is valuable to a hall that is attracting people to come play games, eat, and drink.
The marketing effort will rely on advertisements and sponsorships to reach the desired market segments. For the casual users the venue will be advertised as a place to eat, drink, and play fun games. To reach the competitive players, Foosball Hall will have to generate visibility among the different individuals and groups that compete. This will be done with advertising as well as sponsoring tournaments, arguably the best way to get this segment introduced to Foosball Hall.
The sales strategy is formulated on the hypothesis that there are a large number of people that will try Foosball Hall once, and that a successful sales effort will be one that captures the people and turns them into repeat customers. This philosophy is grounded in the solid marketing maxim that it is more costly to attract new customers than it is to maintain current ones.
5.1 Competitive Edge
Foosball Hall will rely on their competitive edge of offering a large number of foosball tables to patrons. Pool halls are relatively popular. They offer patrons a source of self entertainment (based on skill and strategy) while they drink and socialize. Foosball takes this value one step further by offering a game that has similar skill requirements, but injects much more fun and thrill into the game. Currently, there are no other public places that offer more than one or two foosball tables for play. This competitive edge could diminish if it becomes so popular that competitors take notice and offer similar game options. However, Foosball Hall will enjoy the market leader position and will not rest on its laurels, continually looking for new ways to add value for their customers. Foosball Hall will be always looking for new ways to appeal to their target market by both secondary research, and through primary research in the form of observation of their customers.
5.2 Marketing Strategy
Foosball Hall will use two different forms of marketing communication as a way to reach the target market and raise their awareness of Foosball Hall and their product offerings. The casual users will be reached through a series of advertisements, generally in the student newspapers. The student rags are a source of information that most students consult in determining activities and events. There are two main student papers, each with a slightly different readership demographic. The advertising space in the papers is fairly inexpensive and is targeted to reach the right audience.
In order to reach the competitive users, Foosball Hall will rely on a tournament sponsorship strategy to attract the serious players. Foosball Hall will sponsor several different tournaments, at least two days a week that will be a haven for the competitive players. The beauty (for Foosball Hall) of the competitive tournaments is that most players require practice to remain competitive or improve and the large number of tables at Foosball Hall will encourage this customer segment to use Foosball Hall as a place to train as well as compete. The tournament sponsorship will generate visibility on the local (city as well as state) foosball association websites. The visibility will take the form of activity by members of the Foosball Hall staff in association based activities. Becoming active within this association of people is valuable networking that is likely to bring many new customers to the Hall. Foosball Hall believes that this grassroots approach will be particularly effective for this unusual but tight knit group of people.
5.3 Sales Strategy
The sales strategy is based on the belief that there will a regular flow of first time customers. The real sales effort must concentrate on the conversion of each first-time customer into a long-term customer relationship where the customer comes regularly to Foosball Hall and also brings new friends to share the experience. This focus recognizes the fact that it costs Foosball Hall less money to convert a customer into a long-term relationship than it does to attract another new customer. With this in mind, sales activities concentrate on keeping existing customers happy.
Brought to you by
Create a professional business plan
Using AI and step-by-step instructions
Create Your PlanSecure funding
Validate ideas
Build a strategy
Consistent, customer-centric service is the requirement for Foosball Hall employees. Every employee will have the idea drilled into them that they cannot let a customer leave dissatisfied. Employees will be empowered to remedy most situations that come up. Problem solving will be encouraged throughout the organization. It would also be fair to say that everyone within the organization is part of the sales staff.
5.3.1 Sales Forecast
The sales forecast is a conservative projection. It has been kept conservative to ensure that, with the worst case scenario, we are able to cover our expenses. The first three months have a sales forecast that is pretty grim (relative to the standard month). This can be explained by the fact that the first few months will be slow, a function of being a start-up business, fighting to become more visible within the community, going from nothing to achieving a regular clientele. A slow but steady growth cycle with occur as the months toll. Profitability is projected to occur during the later half of the second year. As a rule of thumb for this industry, if profitability occurs before the second year than it is unlikely to be a sustainable profit, and if it does not occur by the end of the second year than the chance of it ever happening is pretty slim.
The following table and charts represent the breakdown of the sales for the first year as well as graphical representations of sales by month and year.


| Sales Forecast | |||
| Year 1 | Year 2 | Year 3 | |
| Sales | |||
| Alcohol | $67,537 | $95,778 | $132,545 |
| Soft drinks | $36,470 | $51,720 | $71,574 |
| Food | $31,742 | $45,016 | $62,296 |
| Table fees | $12,832 | $18,198 | $25,184 |
| Total Sales | $148,581 | $210,712 | $291,599 |
| Direct Cost of Sales | Year 1 | Year 2 | Year 3 |
| Alcohol | $16,884 | $23,945 | $33,136 |
| Soft drinks | $5,457 | $7,758 | $10,736 |
| Food | $10,475 | $14,855 | $20,558 |
| Table fees | $0 | $0 | $0 |
| Subtotal Direct Cost of Sales | $32,816 | $46,558 | $64,430 |
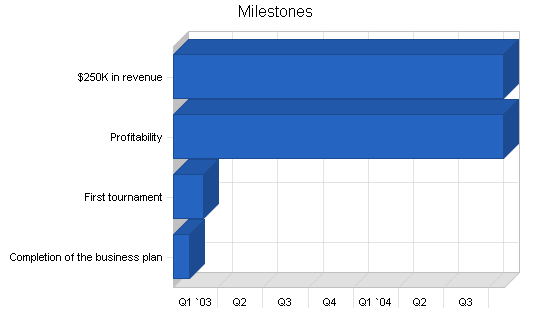
5.4 Milestones
Foosball Hall has identified several different milestones that will act as obtainable goals, providing the organization with benchmarks that they must reach. The following table details the different milestones, the timeline for them and the responsible party.
| Milestones | |||||
| Milestone | Start Date | End Date | Budget | Manager | Department |
| Completion of the business plan | 1/1/2003 | 2/1/2003 | $0 | SS | Bus. Dev. |
| First tournament | 1/1/2003 | 3/1/2003 | $0 | HP | Marketing |
| Profitability | 1/1/2003 | 10/30/2004 | $0 | BK | Accounting |
| $250K in revenue | 1/1/2003 | 10/30/2004 | $0 | SS | Sales |
| Totals | $0 | ||||
Web Plan Summary
The website will be used as a form of communication aimed primarily at the competitive players. The competitive players are those that use the Internet to stay in touch with the rest of the foosball community. This community, as perviously mentioned, is somewhat small but close knit. The Internet provides the perfect communication medium. The casual players are unlikely to use the website much, they will be looking for a casual place to have fun and pass the time and an Internet search is usually not used to find new places.
The website will provide viewers with information regarding the services and products offered by Foosball Hall. In addition to providing information, the website will be linked into the different associations websites as a venue for tournament play.
6.1 Website Marketing Strategy
The website will be marketed in two ways. The first will be submissions to popular search engines such as Google. This will allow people who are searching for Madison based foosball to reach Foosball Hall’s website. The second marketing strategy is the complimentary linking of sites with the local and regional foosball associations. With complimentary links used, surfers who are already on a complimentary website such as the associations website will be guided to Foosball Hall’s site and hopefully made aware of the new venue for foosball play.
6.2 Development Requirements
The development requirements for the site will be met by a computer science student. This type of student will be used for two reasons: the typical below market rates, and the technical expertise that they offer.
Management Summary
Foosball Hall is being led by Stan Spinner. Stan received his undergraduate degree in philosophy from University of Wisconsin-Stevens Point. It was here that Stan was first introduced to foosball. His fraternity had a table and he immediately enjoyed the game. At his fraternity there were always people lined up waiting to play.
During his undergraduate days, Stan managed a pool hall. This was valuable because it taught him general business skills, paid well, and required his time at night, preventing a conflict with his schooling. Stan recognized that his ultimate dream was to create his own business, to be his own boss. With this in mind, and recognizing his reasonable assessment that his business skill set was not totally complete, Stan decided to enroll in The University of Wisconsin’s MBA Entrepreneurship Program.
At this point Stan was aware that having a foosball hall was a viable business opportunity. While the immediacy of starting it as soon as possible to be the first to market was valuable, he recognized his deficiencies in his skill set and ultimately decided to continue school and begin his business after his degree was completed. Having this insight as to his work passion and how to execute it was invaluable to Stan as he went through all his course work with the goal of starting his own business when he graduated.
7.1 Personnel Plan
Stan will be the driving force behind Foosball Hall. His responsibilities include but not limited to: vendor relations and product procurement, marketing, sales, accounting (initially), tournament formation and management, and bar tending. In addition to Stan the following positions will need to be filled:
- Bartender: In addition to tending bar and serving drinks, this position will help with the cleaning and busing of tables as well as opening and closing activities. When it is slow the position will also assist in the limited food preparation. There will be multiple bartenders, typically having part-time shifts.
- Bartender assistant: This position will back up the bartender in any activities that are needed such as cleaning, busing tables, assistance will table rental. This position will also help out with many of the back-end activities. There will be multiple people holding this position.
- Bookkeeper: This position will be filled during month five when business begins to pick up. Initially Stan will be taking care of these functions, however once business picks up there is no value added for Stan to do these functions so he will hire someone on a part-time basis.
| Personnel Plan | |||
| Year 1 | Year 2 | Year 3 | |
| Stan | $24,000 | $26,000 | $33,000 |
| Bartenders | $17,800 | $36,000 | $56,000 |
| Bartender assistants | $14,500 | $18,600 | $20,000 |
| Bookkeeper | $7,200 | $6,000 | $12,000 |
| Total People | 8 | 8 | 8 |
| Total Payroll | $63,500 | $86,600 | $121,000 |
Financial Plan
The following sections outline important financial information.
8.1 Important Assumptions
The following table details important Financial Assumptions.
| General Assumptions | |||
| Year 1 | Year 2 | Year 3 | |
| Plan Month | 1 | 2 | 3 |
| Current Interest Rate | 10.00% | 10.00% | 10.00% |
| Long-term Interest Rate | 10.00% | 10.00% | 10.00% |
| Tax Rate | 30.00% | 30.00% | 30.00% |
| Other | 0 | 0 | 0 |
8.2 Break-even Analysis
The Break-even Analysis indicates that monthly revenue of approximately $12,000 will be needed to reach the break-even point.

| Break-even Analysis | |
| Monthly Revenue Break-even | $12,837 |
| Assumptions: | |
| Average Percent Variable Cost | 22% |
| Estimated Monthly Fixed Cost | $10,001 |
8.3 Projected Profit and Loss
The following table and charts show the Projected Profit and Loss.


| Pro Forma Profit and Loss | |||
| Year 1 | Year 2 | Year 3 | |
| Sales | $148,581 | $210,712 | $291,599 |
| Direct Cost of Sales | $32,816 | $46,558 | $64,430 |
| Other Costs of Goods | $0 | $0 | $0 |
| Total Cost of Sales | $32,816 | $46,558 | $64,430 |
| Gross Margin | $115,765 | $164,154 | $227,169 |
| Gross Margin % | 77.91% | 77.90% | 77.90% |
| Expenses | |||
| Payroll | $63,500 | $86,600 | $121,000 |
| Sales and Marketing and Other Expenses | $4,800 | $4,000 | $4,000 |
| Depreciation | $7,992 | $7,992 | $7,992 |
| Rent | $14,400 | $15,000 | $16,000 |
| Utilities | $4,200 | $4,200 | $4,200 |
| Insurance | $9,600 | $9,600 | $9,600 |
| Payroll Taxes | $9,525 | $12,990 | $18,150 |
| Other | $6,000 | $6,000 | $6,000 |
| Total Operating Expenses | $120,017 | $146,382 | $186,942 |
| Profit Before Interest and Taxes | ($4,252) | $17,772 | $40,227 |
| EBITDA | $3,740 | $25,764 | $48,219 |
| Interest Expense | $0 | $0 | $0 |
| Taxes Incurred | $0 | $5,332 | $12,068 |
| Net Profit | ($4,252) | $12,440 | $28,159 |
| Net Profit/Sales | -2.86% | 5.90% | 9.66% |
8.4 Projected Cash Flow
The following chart and table display Projected Cash Flow.

| Pro Forma Cash Flow | |||
| Year 1 | Year 2 | Year 3 | |
| Cash Received | |||
| Cash from Operations | |||
| Cash Sales | $148,581 | $210,712 | $291,599 |
| Subtotal Cash from Operations | $148,581 | $210,712 | $291,599 |
| Additional Cash Received | |||
| Sales Tax, VAT, HST/GST Received | $0 | $0 | $0 |
| New Current Borrowing | $0 | $0 | $0 |
| New Other Liabilities (interest-free) | $0 | $0 | $0 |
| New Long-term Liabilities | $0 | $0 | $0 |
| Sales of Other Current Assets | $0 | $0 | $0 |
| Sales of Long-term Assets | $0 | $0 | $0 |
| New Investment Received | $0 | $0 | $0 |
| Subtotal Cash Received | $148,581 | $210,712 | $291,599 |
| Expenditures | Year 1 | Year 2 | Year 3 |
| Expenditures from Operations | |||
| Cash Spending | $63,500 | $86,600 | $121,000 |
| Bill Payments | $74,171 | $102,328 | $131,919 |
| Subtotal Spent on Operations | $137,671 | $188,928 | $252,919 |
| Additional Cash Spent | |||
| Sales Tax, VAT, HST/GST Paid Out | $0 | $0 | $0 |
| Principal Repayment of Current Borrowing | $0 | $0 | $0 |
| Other Liabilities Principal Repayment | $0 | $0 | $0 |
| Long-term Liabilities Principal Repayment | $0 | $0 | $0 |
| Purchase Other Current Assets | $0 | $0 | $0 |
| Purchase Long-term Assets | $0 | $0 | $0 |
| Dividends | $0 | $0 | $0 |
| Subtotal Cash Spent | $137,671 | $188,928 | $252,919 |
| Net Cash Flow | $10,910 | $21,784 | $38,680 |
| Cash Balance | $55,210 | $76,994 | $115,674 |
8.5 Projected Balance Sheet
The following table presents the Projected Balance Sheet.
| Pro Forma Balance Sheet | |||
| Year 1 | Year 2 | Year 3 | |
| Assets | |||
| Current Assets | |||
| Cash | $55,210 | $76,994 | $115,674 |
| Other Current Assets | $3,000 | $3,000 | $3,000 |
| Total Current Assets | $58,210 | $79,994 | $118,674 |
| Long-term Assets | |||
| Long-term Assets | $40,000 | $40,000 | $40,000 |
| Accumulated Depreciation | $7,992 | $15,984 | $23,976 |
| Total Long-term Assets | $32,008 | $24,016 | $16,024 |
| Total Assets | $90,218 | $104,010 | $134,698 |
| Liabilities and Capital | Year 1 | Year 2 | Year 3 |
| Current Liabilities | |||
| Accounts Payable | $7,170 | $8,522 | $11,051 |
| Current Borrowing | $0 | $0 | $0 |
| Other Current Liabilities | $0 | $0 | $0 |
| Subtotal Current Liabilities | $7,170 | $8,522 | $11,051 |
| Long-term Liabilities | $0 | $0 | $0 |
| Total Liabilities | $7,170 | $8,522 | $11,051 |
| Paid-in Capital | $95,000 | $95,000 | $95,000 |
| Retained Earnings | ($7,700) | ($11,952) | $488 |
| Earnings | ($4,252) | $12,440 | $28,159 |
| Total Capital | $83,048 | $95,488 | $123,647 |
| Total Liabilities and Capital | $90,218 | $104,010 | $134,698 |
| Net Worth | $83,048 | $95,488 | $123,647 |
8.6 Business Ratios
Foosball Hall’s Business Ratios. SIC industry class: Pool parlor – 7999.0403.
| Ratio Analysis | ||||
| Year 1 | Year 2 | Year 3 | Industry Profile | |
| Sales Growth | 0.00% | 41.82% | 38.39% | 5.73% |
| Percent of Total Assets | ||||
| Other Current Assets | 3.33% | 2.88% | 2.23% | 33.26% |
| Total Current Assets | 64.52% | 76.91% | 88.10% | 43.21% |
| Long-term Assets | 35.48% | 23.09% | 11.90% | 56.79% |
| Total Assets | 100.00% | 100.00% | 100.00% | 100.00% |
| Current Liabilities | 7.95% | 8.19% | 8.20% | 21.91% |
| Long-term Liabilities | 0.00% | 0.00% | 0.00% | 28.81% |
| Total Liabilities | 7.95% | 8.19% | 8.20% | 50.72% |
| Net Worth | 92.05% | 91.81% | 91.80% | 49.28% |
| Percent of Sales | ||||
| Sales | 100.00% | 100.00% | 100.00% | 100.00% |
| Gross Margin | 77.91% | 77.90% | 77.90% | 100.00% |
| Selling, General & Administrative Expenses | 80.78% | 72.00% | 68.25% | 76.43% |
| Advertising Expenses | 0.00% | 0.00% | 0.00% | 2.77% |
| Profit Before Interest and Taxes | -2.86% | 8.43% | 13.80% | 1.89% |
| Main Ratios | ||||
| Current | 8.12 | 9.39 | 10.74 | 1.18 |
| Quick | 8.12 | 9.39 | 10.74 | 0.80 |
| Total Debt to Total Assets | 7.95% | 8.19% | 8.20% | 1.76% |
| Pre-tax Return on Net Worth | -5.12% | 18.61% | 32.53% | 61.12% |
| Pre-tax Return on Assets | -4.71% | 17.09% | 29.86% | 4.52% |
| Additional Ratios | Year 1 | Year 2 | Year 3 | |
| Net Profit Margin | -2.86% | 5.90% | 9.66% | n.a |
| Return on Equity | -5.12% | 13.03% | 22.77% | n.a |
| Activity Ratios | ||||
| Accounts Payable Turnover | 11.34 | 12.17 | 12.17 | n.a |
| Payment Days | 27 | 28 | 27 | n.a |
| Total Asset Turnover | 1.65 | 2.03 | 2.16 | n.a |
| Debt Ratios | ||||
| Debt to Net Worth | 0.09 | 0.09 | 0.09 | n.a |
| Current Liab. to Liab. | 1.00 | 1.00 | 1.00 | n.a |
| Liquidity Ratios | ||||
| Net Working Capital | $51,040 | $71,472 | $107,623 | n.a |
| Interest Coverage | 0.00 | 0.00 | 0.00 | n.a |
| Additional Ratios | ||||
| Assets to Sales | 0.61 | 0.49 | 0.46 | n.a |
| Current Debt/Total Assets | 8% | 8% | 8% | n.a |
| Acid Test | 8.12 | 9.39 | 10.74 | n.a |
| Sales/Net Worth | 1.79 | 2.21 | 2.36 | n.a |
| Dividend Payout | 0.00 | 0.00 | 0.00 | n.a |
Appendix
| Sales Forecast | |||||||||||||
| Month 1 | Month 2 | Month 3 | Month 4 | Month 5 | Month 6 | Month 7 | Month 8 | Month 9 | Month 10 | Month 11 | Month 12 | ||
| Sales | |||||||||||||
| Alcohol | 0% | $2,511 | $2,787 | $3,254 | $4,587 | $4,354 | $5,656 | $3,877 | $6,141 | $8,454 | $8,654 | $9,848 | $7,414 |
| Soft drinks | 0% | $1,356 | $1,505 | $1,757 | $2,477 | $2,351 | $3,054 | $2,094 | $3,316 | $4,565 | $4,673 | $5,318 | $4,004 |
| Food | 0% | $1,180 | $1,310 | $1,529 | $2,156 | $2,046 | $2,658 | $1,822 | $2,886 | $3,973 | $4,067 | $4,629 | $3,485 |
| Table fees | 0% | $477 | $530 | $618 | $872 | $827 | $1,075 | $737 | $1,167 | $1,606 | $1,644 | $1,871 | $1,409 |
| Total Sales | $5,524 | $6,131 | $7,159 | $10,091 | $9,579 | $12,443 | $8,529 | $13,510 | $18,599 | $19,039 | $21,666 | $16,311 | |
| Direct Cost of Sales | Month 1 | Month 2 | Month 3 | Month 4 | Month 5 | Month 6 | Month 7 | Month 8 | Month 9 | Month 10 | Month 11 | Month 12 | |
| Alcohol | $628 | $697 | $814 | $1,147 | $1,089 | $1,414 | $969 | $1,535 | $2,114 | $2,164 | $2,462 | $1,854 | |
| Soft drinks | $339 | $376 | $439 | $619 | $588 | $764 | $523 | $829 | $241 | $247 | $281 | $211 | |
| Food | $389 | $432 | $505 | $711 | $675 | $877 | $601 | $952 | $1,311 | $1,342 | $1,527 | $1,150 | |
| Table fees | $0 | $0 | $0 | $0 | $0 | $0 | $0 | $0 | $0 | $0 | $0 | $0 | |
| Subtotal Direct Cost of Sales | $1,356 | $1,505 | $1,757 | $2,477 | $2,352 | $3,055 | $2,094 | $3,317 | $3,666 | $3,752 | $4,270 | $3,215 | |
| Personnel Plan | |||||||||||||
| Month 1 | Month 2 | Month 3 | Month 4 | Month 5 | Month 6 | Month 7 | Month 8 | Month 9 | Month 10 | Month 11 | Month 12 | ||
| Stan | 0% | $2,000 | $2,000 | $2,000 | $2,000 | $2,000 | $2,000 | $2,000 | $2,000 | $2,000 | $2,000 | $2,000 | $2,000 |
| Bartenders | 0% | $0 | $0 | $1,500 | $1,500 | $1,700 | $1,700 | $1,900 | $1,900 | $1,900 | $1,900 | $1,900 | $1,900 |
| Bartender assistants | 0% | $0 | $0 | $1,200 | $1,200 | $1,400 | $1,400 | $1,550 | $1,550 | $1,550 | $1,550 | $1,550 | $1,550 |
| Bookkeeper | 0% | $0 | $0 | $0 | $0 | $900 | $900 | $900 | $900 | $900 | $900 | $900 | $900 |
| Total People | 1 | 1 | 6 | 6 | 6 | 7 | 8 | 8 | 8 | 8 | 8 | 8 | |
| Total Payroll | $2,000 | $2,000 | $4,700 | $4,700 | $6,000 | $6,000 | $6,350 | $6,350 | $6,350 | $6,350 | $6,350 | $6,350 | |
| General Assumptions | |||||||||||||
| Month 1 | Month 2 | Month 3 | Month 4 | Month 5 | Month 6 | Month 7 | Month 8 | Month 9 | Month 10 | Month 11 | Month 12 | ||
| Plan Month | 1 | 2 | 3 | 4 | 5 | 6 | 7 | 8 | 9 | 10 | 11 | 12 | |
| Current Interest Rate | 10.00% | 10.00% | 10.00% | 10.00% | 10.00% | 10.00% | 10.00% | 10.00% | 10.00% | 10.00% | 10.00% | 10.00% | |
| Long-term Interest Rate | 10.00% | 10.00% | 10.00% | 10.00% | 10.00% | 10.00% | 10.00% | 10.00% | 10.00% | 10.00% | 10.00% | 10.00% | |
| Tax Rate | 30.00% | 30.00% | 30.00% | 30.00% | 30.00% | 30.00% | 30.00% | 30.00% | 30.00% | 30.00% | 30.00% | 30.00% | |
| Other | 0 | 0 | 0 | 0 | 0 | 0 | 0 | 0 | 0 | 0 | 0 | 0 | |
| Pro Forma Profit and Loss | |||||||||||||
| Month 1 | Month 2 | Month 3 | Month 4 | Month 5 | Month 6 | Month 7 | Month 8 | Month 9 | Month 10 | Month 11 | Month 12 | ||
| Sales | $5,524 | $6,131 | $7,159 | $10,091 | $9,579 | $12,443 | $8,529 | $13,510 | $18,599 | $19,039 | $21,666 | $16,311 | |
| Direct Cost of Sales | $1,356 | $1,505 | $1,757 | $2,477 | $2,352 | $3,055 | $2,094 | $3,317 | $3,666 | $3,752 | $4,270 | $3,215 | |
| Other Costs of Goods | $0 | $0 | $0 | $0 | $0 | $0 | $0 | $0 | $0 | $0 | $0 | $0 | |
| Total Cost of Sales | $1,356 | $1,505 | $1,757 | $2,477 | $2,352 | $3,055 | $2,094 | $3,317 | $3,666 | $3,752 | $4,270 | $3,215 | |
| Gross Margin | $4,168 | $4,626 | $5,401 | $7,614 | $7,227 | $9,388 | $6,435 | $10,193 | $14,933 | $15,286 | $17,396 | $13,096 | |
| Gross Margin % | 75.45% | 75.45% | 75.45% | 75.45% | 75.45% | 75.45% | 75.45% | 75.45% | 80.29% | 80.29% | 80.29% | 80.29% | |
| Expenses | |||||||||||||
| Payroll | $2,000 | $2,000 | $4,700 | $4,700 | $6,000 | $6,000 | $6,350 | $6,350 | $6,350 | $6,350 | $6,350 | $6,350 | |
| Sales and Marketing and Other Expenses | $400 | $400 | $400 | $400 | $400 | $400 | $400 | $400 | $400 | $400 | $400 | $400 | |
| Depreciation | $666 | $666 | $666 | $666 | $666 | $666 | $666 | $666 | $666 | $666 | $666 | $666 | |
| Rent | $1,200 | $1,200 | $1,200 | $1,200 | $1,200 | $1,200 | $1,200 | $1,200 | $1,200 | $1,200 | $1,200 | $1,200 | |
| Utilities | $350 | $350 | $350 | $350 | $350 | $350 | $350 | $350 | $350 | $350 | $350 | $350 | |
| Insurance | $800 | $800 | $800 | $800 | $800 | $800 | $800 | $800 | $800 | $800 | $800 | $800 | |
| Payroll Taxes | 15% | $300 | $300 | $705 | $705 | $900 | $900 | $953 | $953 | $953 | $953 | $953 | $953 |
| Other | $500 | $500 | $500 | $500 | $500 | $500 | $500 | $500 | $500 | $500 | $500 | $500 | |
| Total Operating Expenses | $6,216 | $6,216 | $9,321 | $9,321 | $10,816 | $10,816 | $11,219 | $11,219 | $11,219 | $11,219 | $11,219 | $11,219 | |
| Profit Before Interest and Taxes | ($2,048) | ($1,590) | ($3,920) | ($1,707) | ($3,589) | ($1,428) | ($4,783) | ($1,025) | $3,715 | $4,068 | $6,177 | $1,878 | |
| EBITDA | ($1,382) | ($924) | ($3,254) | ($1,041) | ($2,923) | ($762) | ($4,117) | ($359) | $4,381 | $4,734 | $6,843 | $2,544 | |
| Interest Expense | $0 | $0 | $0 | $0 | $0 | $0 | $0 | $0 | $0 | $0 | $0 | $0 | |
| Taxes Incurred | $0 | $0 | $0 | $0 | $0 | $0 | $0 | $0 | $0 | $0 | $0 | $0 | |
| Net Profit | ($2,048) | ($1,590) | ($3,920) | ($1,707) | ($3,589) | ($1,428) | ($4,783) | ($1,025) | $3,715 | $4,068 | $6,177 | $1,878 | |
| Net Profit/Sales | -37.07% | -25.93% | -54.75% | -16.92% | -37.47% | -11.47% | -56.08% | -7.59% | 19.97% | 21.37% | 28.51% | 11.51% | |
| Pro Forma Cash Flow | |||||||||||||
| Month 1 | Month 2 | Month 3 | Month 4 | Month 5 | Month 6 | Month 7 | Month 8 | Month 9 | Month 10 | Month 11 | Month 12 | ||
| Cash Received | |||||||||||||
| Cash from Operations | |||||||||||||
| Cash Sales | $5,524 | $6,131 | $7,159 | $10,091 | $9,579 | $12,443 | $8,529 | $13,510 | $18,599 | $19,039 | $21,666 | $16,311 | |
| Subtotal Cash from Operations | $5,524 | $6,131 | $7,159 | $10,091 | $9,579 | $12,443 | $8,529 | $13,510 | $18,599 | $19,039 | $21,666 | $16,311 | |
| Additional Cash Received | |||||||||||||
| Sales Tax, VAT, HST/GST Received | 0.00% | $0 | $0 | $0 | $0 | $0 | $0 | $0 | $0 | $0 | $0 | $0 | $0 |
| New Current Borrowing | $0 | $0 | $0 | $0 | $0 | $0 | $0 | $0 | $0 | $0 | $0 | $0 | |
| New Other Liabilities (interest-free) | $0 | $0 | $0 | $0 | $0 | $0 | $0 | $0 | $0 | $0 | $0 | $0 | |
| New Long-term Liabilities | $0 | $0 | $0 | $0 | $0 | $0 | $0 | $0 | $0 | $0 | $0 | $0 | |
| Sales of Other Current Assets | $0 | $0 | $0 | $0 | $0 | $0 | $0 | $0 | $0 | $0 | $0 | $0 | |
| Sales of Long-term Assets | $0 | $0 | $0 | $0 | $0 | $0 | $0 | $0 | $0 | $0 | $0 | $0 | |
| New Investment Received | $0 | $0 | $0 | $0 | $0 | $0 | $0 | $0 | $0 | $0 | $0 | $0 | |
| Subtotal Cash Received | $5,524 | $6,131 | $7,159 | $10,091 | $9,579 | $12,443 | $8,529 | $13,510 | $18,599 | $19,039 | $21,666 | $16,311 | |
| Expenditures | Month 1 | Month 2 | Month 3 | Month 4 | Month 5 | Month 6 | Month 7 | Month 8 | Month 9 | Month 10 | Month 11 | Month 12 | |
| Expenditures from Operations | |||||||||||||
| Cash Spending | $2,000 | $2,000 | $4,700 | $4,700 | $6,000 | $6,000 | $6,350 | $6,350 | $6,350 | $6,350 | $6,350 | $6,350 | |
| Bill Payments | $164 | $4,911 | $5,077 | $5,736 | $6,435 | $6,525 | $7,175 | $6,337 | $7,531 | $7,871 | $7,972 | $8,437 | |
| Subtotal Spent on Operations | $2,164 | $6,911 | $9,777 | $10,436 | $12,435 | $12,525 | $13,525 | $12,687 | $13,881 | $14,221 | $14,322 | $14,787 | |
| Additional Cash Spent | |||||||||||||
| Sales Tax, VAT, HST/GST Paid Out | $0 | $0 | $0 | $0 | $0 | $0 | $0 | $0 | $0 | $0 | $0 | $0 | |
| Principal Repayment of Current Borrowing | $0 | $0 | $0 | $0 | $0 | $0 | $0 | $0 | $0 | $0 | $0 | $0 | |
| Other Liabilities Principal Repayment | $0 | $0 | $0 | $0 | $0 | $0 | $0 | $0 | $0 | $0 | $0 | $0 | |
| Long-term Liabilities Principal Repayment | $0 | $0 | $0 | $0 | $0 | $0 | $0 | $0 | $0 | $0 | $0 | $0 | |
| Purchase Other Current Assets | $0 | $0 | $0 | $0 | $0 | $0 | $0 | $0 | $0 | $0 | $0 | $0 | |
| Purchase Long-term Assets | $0 | $0 | $0 | $0 | $0 | $0 | $0 | $0 | $0 | $0 | $0 | $0 | |
| Dividends | $0 | $0 | $0 | $0 | $0 | $0 | $0 | $0 | $0 | $0 | $0 | $0 | |
| Subtotal Cash Spent | $2,164 | $6,911 | $9,777 | $10,436 | $12,435 | $12,525 | $13,525 | $12,687 | $13,881 | $14,221 | $14,322 | $14,787 | |
| Net Cash Flow | $3,361 | ($780) | ($2,618) | ($345) | ($2,856) | ($82) | ($4,995) | $823 | $4,718 | $4,818 | $7,343 | $1,523 | |
| Cash Balance | $47,661 | $46,881 | $44,263 | $43,917 | $41,062 | $40,980 | $35,985 | $36,808 | $41,525 | $46,343 | $53,687 | $55,210 | |
| Pro Forma Balance Sheet | |||||||||||||
| Month 1 | Month 2 | Month 3 | Month 4 | Month 5 | Month 6 | Month 7 | Month 8 | Month 9 | Month 10 | Month 11 | Month 12 | ||
| Assets | Starting Balances | ||||||||||||
| Current Assets | |||||||||||||
| Cash | $44,300 | $47,661 | $46,881 | $44,263 | $43,917 | $41,062 | $40,980 | $35,985 | $36,808 | $41,525 | $46,343 | $53,687 | $55,210 |
| Other Current Assets | $3,000 | $3,000 | $3,000 | $3,000 | $3,000 | $3,000 | $3,000 | $3,000 | $3,000 | $3,000 | $3,000 | $3,000 | $3,000 |
| Total Current Assets | $47,300 | $50,661 | $49,881 | $47,263 | $46,917 | $44,062 | $43,980 | $38,985 | $39,808 | $44,525 | $49,343 | $56,687 | $58,210 |
| Long-term Assets | |||||||||||||
| Long-term Assets | $40,000 | $40,000 | $40,000 | $40,000 | $40,000 | $40,000 | $40,000 | $40,000 | $40,000 | $40,000 | $40,000 | $40,000 | $40,000 |
| Accumulated Depreciation | $0 | $666 | $1,332 | $1,998 | $2,664 | $3,330 | $3,996 | $4,662 | $5,328 | $5,994 | $6,660 | $7,326 | $7,992 |
| Total Long-term Assets | $40,000 | $39,334 | $38,668 | $38,002 | $37,336 | $36,670 | $36,004 | $35,338 | $34,672 | $34,006 | $33,340 | $32,674 | $32,008 |
| Total Assets | $87,300 | $89,995 | $88,549 | $85,265 | $84,253 | $80,732 | $79,984 | $74,323 | $74,480 | $78,531 | $82,683 | $89,361 | $90,218 |
| Liabilities and Capital | Month 1 | Month 2 | Month 3 | Month 4 | Month 5 | Month 6 | Month 7 | Month 8 | Month 9 | Month 10 | Month 11 | Month 12 | |
| Current Liabilities | |||||||||||||
| Accounts Payable | $0 | $4,743 | $4,887 | $5,522 | $6,218 | $6,285 | $6,965 | $6,087 | $7,269 | $7,606 | $7,690 | $8,190 | $7,170 |
| Current Borrowing | $0 | $0 | $0 | $0 | $0 | $0 | $0 | $0 | $0 | $0 | $0 | $0 | $0 |
| Other Current Liabilities | $0 | $0 | $0 | $0 | $0 | $0 | $0 | $0 | $0 | $0 | $0 | $0 | $0 |
| Subtotal Current Liabilities | $0 | $4,743 | $4,887 | $5,522 | $6,218 | $6,285 | $6,965 | $6,087 | $7,269 | $7,606 | $7,690 | $8,190 | $7,170 |
| Long-term Liabilities | $0 | $0 | $0 | $0 | $0 | $0 | $0 | $0 | $0 | $0 | $0 | $0 | $0 |
| Total Liabilities | $0 | $4,743 | $4,887 | $5,522 | $6,218 | $6,285 | $6,965 | $6,087 | $7,269 | $7,606 | $7,690 | $8,190 | $7,170 |
| Paid-in Capital | $95,000 | $95,000 | $95,000 | $95,000 | $95,000 | $95,000 | $95,000 | $95,000 | $95,000 | $95,000 | $95,000 | $95,000 | $95,000 |
| Retained Earnings | ($7,700) | ($7,700) | ($7,700) | ($7,700) | ($7,700) | ($7,700) | ($7,700) | ($7,700) | ($7,700) | ($7,700) | ($7,700) | ($7,700) | ($7,700) |
| Earnings | $0 | ($2,048) | ($3,638) | ($7,558) | ($9,265) | ($12,853) | ($14,281) | ($19,064) | ($20,089) | ($16,374) | ($12,307) | ($6,130) | ($4,252) |
| Total Capital | $87,300 | $85,252 | $83,662 | $79,742 | $78,035 | $74,447 | $73,019 | $68,236 | $67,211 | $70,926 | $74,993 | $81,170 | $83,048 |
| Total Liabilities and Capital | $87,300 | $89,995 | $88,549 | $85,265 | $84,253 | $80,732 | $79,984 | $74,323 | $74,480 | $78,531 | $82,683 | $89,361 | $90,218 |
| Net Worth | $87,300 | $85,252 | $83,662 | $79,742 | $78,035 | $74,447 | $73,019 | $68,236 | $67,211 | $70,926 | $74,993 | $81,170 | $83,048 |


