
Phaethon's Chariot Restorations
Executive Summary
Phaethon’s Chariot is a start-up auto restoration shop. The company is engaged in the restoration of old American cars, and the designing and building of hot rods, and street rods. Body work and rust repair is the majority of our work. Phaethon’s Chariot has recently rented a new state-of-the-art restoration shop, located at 510 W. 200th Terrace Circle Boulevard, Centerton, Ohmstate. The company is dedicated to providing the highest quality workmanship. Phaethon’s Chariot keeps up on all the latest tools and techniques of the trade to perform the highest quality work possible today.
Phaethon’s Chariot is located in Centerton, Ohmstate. Our company and employees are dedicated to doing each job right the first time, and retaining each car owner as a lifetime customer of our shop.
The company is a state chartered corporation in Ohmstate, owned by Isoroku Tarnmaclahan. The has owner worked for other shops in the Highland Valley area for the past 20 years, and is committed to excellence every day. This new space allows the company retain more work. The office area is comprised of 500 square feet and the shop area where the day-to-day work on the cars is performed is 5,000 sq.ft.
The population of the seven communities in close proximity to Phaethon’s Chariot Restorations is estimated at 918,279. Roughly, this would mean that this area comprises a total restoration market in excess of $2.0 million annually. The company’s goal is to a acquire a comfortable minority share of this nearby market.
The marketing research and tailored marketing strategy described in this business plan will result in modest after-tax profits of in year 1, quadrupling after-tax profits within three years. It is estimated that by year 3, revenues will reflect a healthy market share of the local restoration market.
Within the next twelve months it is the objective of the company to market to the local area to promote our business in the Highland Valley and surrounding areas. Our market segment will be 30- to 65-year old owners of old American cars. After year three we plan to expand our business to the Carahge City, Mythtate area. Our studies indicate that the Carahge area doesn’t have a lot of competition for our business.

1.1 Objectives
- Penetrate the automotive restoration market here in the Highland Valley. Within the next twelve months, it is the objective of the company to market to the local area to promote our business in the Highland Valley and surrounding areas, our market segment will be 30 to 65 years old men and women who own old American cars. After year two we plan to expand our business to the Carahge City, Mythtate area. Our studies indicate that the Carahge City area doesn’t have a lot of competition for our business.
- Substantially increase profitability. We will encourage price-sensitive jobs to go elsewhere by normalizing the pricing structure. This will allow for more high-end custom work to be performed for the less price-sensitive restoration market sector. This pricing will insure a quadrupling of net profits during the third year.
- To improve the administrative processes of the company. This will allow a reduction in the owner’s involvement in simple administrative tasks from 50% of his time to 20%, thereby allowing him more time for sales and marketing tasks.
1.2 Mission
Our mission at Phaethon’s Chariot is to always perform the highest quality work at the best price around.
- We can achieve this by only using the best of everything to do our restoration.
- We produce high-quality work using the best parts and supplies available in the market place today.
- We only employ the most knowledgeable people to work for our shop.
- We have a metal fabricator who will build any part that we can’t locate for your car.
- All of our restoration technicians go through a rigorous application process before we hire them. We employ only the best people to do our work.
At Phaethon’s Chariot Restorations you will get only the best quality work done on your car.
1.3 Keys to Success
Keys to success for the company will include:
- Maintaining an untarnished reputation in the community.
- Quality care.
- Competitive pricing.
- Flexible hours.
Company Summary
Phaethon’s Chariot is an auto restoration shop located in Centerton, Ohmstate. The company is engaged in the restoration of 1970 and earlier American cars, and the building of custom hot rods. Body work and rust repair is the majority of our work. The total market for auto restoration in the communities which the company targets is approximately $2.7 million. The share of this market channeled through auto restoration shops and word of mouth is directly proportional to disposable income.
Phaethon’s Chariot Restorations is best suited to serving the high-end customer share of the auto restoration market because clients of auto restoration can afford expensive materials and custom solutions. The company is unable to compete with large shops geared to mass production runs, nor can it’s pricing compete with the many “insurance job” body repair shops. The company is dedicated to providing the highest quality workmanship, meeting the agreed delivery dates, and executing the custom work exactly in accordance with the customers concept.
2.1 Company Ownership
The company, Phaethon’s Chariot Restorations, is a corporation registered in Ohmstate, owned by Isoroku Tarnmaclahan.
2.2 Start-up Summary
The company founder, Mr. Isoroku Tarnmaclahan, will manage day-to-day operations of the business and will work collaboratively with all employees to ensure that this business venture is a success.
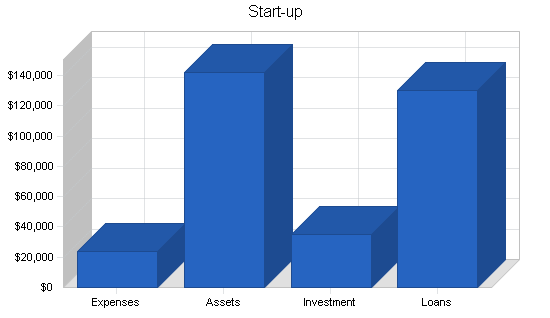
It is estimated that the start-up costs will include legal costs, advertising, one month’s rent and utilities, and related expenses. An additional amount will be required as start-up assets, including heavy equipment and cash on hand. The owner’s existing tools comprise part of the current assets. Total Start-up Requirements are detailed in the table below.
Some of the heavy equipment long-term assets that will be acquired include:
- Air Compressor System
- Air Filtration System
- Air Powered Tools
- Car Lift/Hoist
- Computerized Engine Diagnostic Equipment
- Fixtures
- Hand Tools
- Jigs and Work Stands
- Auto Hand Tools
- Spray Painting Equipment
Inventory will consist of restoration materials. Custom panels, parts, seats, fabrics, instruments, etc. will be purchased either by the car owners, or by Phaethon’s Chariot on a just-in-time, as needed basis.
| Start-up | |
| Requirements | |
| Start-up Expenses | |
| Legal | $1,000 |
| Logo Design – Artwork | $3,000 |
| Stationery etc. | $500 |
| Sales Literature | $4,000 |
| Insurance | $1,500 |
| Rent | $1,800 |
| Utilities | $1,200 |
| Computer Network – Office/Shop | $6,000 |
| Website Development | $700 |
| Office Furniture | $3,000 |
| Fixtures | $800 |
| Total Start-up Expenses | $23,500 |
| Start-up Assets | |
| Cash Required | $10,000 |
| Start-up Inventory | $2,000 |
| Other Current Assets | $30,000 |
| Long-term Assets | $100,000 |
| Total Assets | $142,000 |
| Total Requirements | $165,500 |
Products and Services
Phaethon’s Chariot Restorations will sell classic car restoration services to the general public at a shop rate of $45 per hour. This will include complete frame off restoration work for all makes of American classic cars and muscle cars. We will perform tasks such as mechanical repairs on older American cars, body and paint restoration including rust repair, electrical repair, as well as custom engine building, custom paint and metal fabrication.
We specialize in pre-1970 American cars and trucks, and average frame off restoration will take 600 hours of labor, therefore our average labor charge for a complete restoration is approximately $27,000. There are additional charges for any parts that we have to get for the job. Phaethon’s Chariot will perform any kind of work on pre 1970 American cars including, but not limited to regular mechanical service, and body and paint work.

Market Analysis Summary
TARGET MARKET
The type of customer who will be interested in the services of Phaethon’s Chariot are predominantly male, and in the age range from 30 to 65 years. The majority will have an income in the $100,000 and up range. Some customers in the lower income ranges are interested in specific services, interior restoration, or paint work and parts sales rather than full restorations.
The customers who Phaethon’s Chariot plans to target want :
- Quality full restoration or custom services, including engine, custom body work and paint.
- Timely completion of the work on their cars.
- Competitive rates.
- Close attention to detail, and commitment to quality.
- Ability to offer ideas for alternatives and close customer services.
Phaethon’s Chariot has the ability to meet all these demands. The owner has a long work history in this field, and has extremely high standards in regards to the shop’s work. The owner and the foreman will make sure that the shop’s employees meet these standards. The owner also understands that, not only quality work, but the attention and care bestowed on the customer and their cars will result in a good reputation.
LOCATION
There is no specific geographical location for potential customers. They are located all over the United States. They send their cars to whom and where they feel will do the best job, based on reputation. This reputation comes largely from “word of mouth”, i.e. seeing the quality of a car that was restored by Phaethon’s Chariot at a show, and referrals by others in the business. We feel that eventually 50% of Phaethon’s Chariot’s customers will come from out of state.
INDUSTRY TRENDS
This is a large market that has seen an upturn in the last few years. All indications are that this will continue for many years until leveling off at possibly double or triple the current market. One company in this area, Car Barn Renewals, has a waiting list of three years. They not taking any new business at this time. The owner of this shop is well acquainted with the quality of work that will be preformed by Phaethon’s Chariot and has indicated to Mr. Isoroku Tarnmaclahan that he would refer anyone inquiring about new services to Phaethon’s Chariot. This will not only increase the number of potential customers for Phaethon’s Chariot in the start-up phase, but will provide a valuable word-of-mouth reputation for them.
COMPETITION
There are two other companies in the Centerton area that offer services similar to Phaethon’s Chariot’s. One has been in business for 40 years and has an extremely high reputation within the restoration community. They currently have more work than the shop can handle and has a waiting list of three years. They are not taking any new customers. They also usually has one or more cars in most shows. The owner of Phaethon’s Chariot worked for them while learning his trade.
The other shop has been in business 15 years. They currently have a wait of 160 days for any new work. However most of their work is new business (first time customers) as their reputation in the community is not good and they rarely have repeat business.
PRICING
Phaethon’s Chariot’s labor rates will be $45 per hour. Both of the other shops charge $65 per/hr. Phaethon’s Chariot feels that this is a competitive rate and will not impact the bottom line in a negative manner.
ADVERTISING
Phaethon’s Chariot has a modest program of marketing its services that include the following:
- Flyers
- Discounts
- Newspaper and magazines ads
- Press releases and magazines articles
- Car shows
- Local radio stations
- Website
- Calendars
Each of these marketing approaches has the advantage of being low cost and creating service awareness. The company is also considering the possibility of having a grand opening program that would feature discounts, food, a local radio disc jockey and other promotional ideas.
We feel that the company website is one of our best marketing strategies. It is linked to City Search.com and many other classic car restoration oriented websites and portals. The site has news about our business, answers to FAQ’s and pictures of cars we’ve restored and the process of the restoration.
4.1 Market Segmentation
The market for auto restoration reflects the buyer’s income bracket and standard of living in much the same way that the restoration market is segmented. Below are listed market segments based on size of pocketbook and quality of production:
- Material Outlets. Suppliers of auto body and paint supplies, interior supplies and mechanical parts.
- Simple jobs. Simple repair jobs and service are the next level in our sales chain.
- Paint. Custom paint work such as murals and flames, will provide some income.
- Restoration. Complete restoration jobs, and complete paint work.
- Custom Work. Custom body work such as, top chops and channels, this would be considered our high end of work.
The average age of our customers is 30 to 65 years old with an average income is $60,000 per year, with most full restoration customers having incomes of over $100,000. The gender is predominantly male, with a college education, and coming from Centerton county and surrounding areas. Some of the more recent trends come from the increasing coverage of our industry on television, with shows such as American Muscle Car, Dream Car Garage and the like. These types of shows have helped auto restoration to grow to a billion dollar a year industry in the United States.

| Market Analysis | |||||||
| Year 1 | Year 2 | Year 3 | Year 4 | Year 5 | |||
| Potential Customers | Growth | CAGR | |||||
| Males 30 to 65 years old | 70% | 20 | 34 | 58 | 99 | 168 | 70.24% |
| Other | 30% | 10 | 10 | 10 | 13 | 17 | 14.19% |
| Total | 57.58% | 30 | 44 | 68 | 112 | 185 | 57.58% |
4.2 Target Market Segment Strategy
Our target market segment strategy includes the use of local radio and television stations to convey the word about our business. We also plan on using advertising in publications such as Hot Rod and Super Chevy magazines. These publications are distributed to a wide variety of people who are all interested in old American cars, and muscle cars. Our strategy includes using people’s emotions to persuade them to restore an old car if they have one. We’re not limited to just a couple of different types of advertising, we also us flyers, discounts, newspapers, press releases and magazine articles. Our website, which is a well designed, and cost effective way to tell people about our shop and it’s services, Phaethon’s Chariot will use every way within it’s means to convey our message to the public.
Our market strategy is to flood the magazines and air waves with our shop’s advertisements, doing radio ads during morning and afternoon drive times. This is due to the fact that more people listen to the radio during these time frames, so if you have a really catchy ad during these time it’s probable that you will gain some customers from it. The magazine publications go out to hundreds of thousands of people every month, so all we need is to convert a small percentage to sales and we’ll achieve our success. But we don’t stop there, we are also joining the chamber of commerce to network our business. We will use flyers at the car shows to promote or shop, and of course business cards.
4.3 Service Business Analysis
In setting a foundation on which to build a suitable market strategy for Phaethon’s Chariot, some of the other local industry players were contacted by phone. These players are located in the greater Centerton area.
We called Classy Chassis and posed as a potential customer with a 1969 Z/28 Camaro for a full restoration project, and from this call we discovered that their labor rate runs at $65 per hour, and it would take about 600 hours of labor to restore the car plus parts. The labor before parts were added worked out to $39,000. This is for a frame off restoration, rebuilding the entire car from ground up. We also discovered that it would take about 160 days to get the car into their shop to start the project.
We have also talked to Khamm Zhaapht from Car Barn Renewals, and have discovered that he’s running the same shop rates as Classy Chassis, but he has a three year waiting list for his shop services, Khamm only does the highest quality work, having cars in most of the shows at one time or another, Car Barn Renewals is very well known both in and out of Ohmstate.
4.3.1 Competition and Buying Patterns
The general nature of competition in this business, and how the customers seem to choose one shop over another can be measured by customer loyalty and positive word of mouth. Customer loyalty and shop preference come from developing a trust between the customer and the business. To be successful in the automotive restoration business, one must truly believe in the old American cars and love them. The customer must truly be made to feel welcome and cared for. The trust that a customer feels, is based upon the business’ ability to recognize what it takes to please a customer, and then is built upon by continuously delivering to that customer at, or above, the that they expect.
The level of attention and care that our staff bestow upon our customers sets us far above our competition. We also have extremely high standards for professionalism in the shop. Cleanliness, adherence to all shop rules, and efficiency are constantly applied. Prices are reasonable, and are perceived as being an exceptional value. Our shop offers the highest quality restoration work available today, we use only the highest quality parts and supplies on all of our jobs. All of this can be found in a professional shop environment, and very comfortable for our customers.
Strategy and Implementation Summary
Image is a key factor in making inroads into the higher echelons of auto restoration. Phaethon’s Chariot’s strategy is to lift its image, through advertising in prestigious trade publications, networking with a Chamber of Commerce membership, and actively marketing to a select group of people located in and around the company’s target market area.
5.1 Competitive Edge
The company seeks to establish a competitive edge in its new target market segment by increasing the level of customer contact and service that other competitors seem to oftentimes lack. Additionally, Phaethon’s Chariot Restorations possesses the necessary skills to produce the high quality restorations that are needed in this field. The establishment of the previously mentioned work processes that will ensure greater service will strengthen the contacts that promote word-of-mouth marketing and networking.
Our competitive edge will come from hard work and customer satisfaction, we will only produce top quality work that is show ready when it leaves the shop. This will spawn good word of mouth, which will in turn generate work from past and present customers of our shop.
5.2 Marketing Strategy
As mentioned in the previous section, it is important to the marketing strategy to develop an attractive image to the trade. This can be done in a number of ways:
- Advertising. Most restoration shops interviewed suggested Hemmings Motor News as the best place to advertise. In the regional telephone directory Yellow Pages two classification are possible: Auto Restoration–Antique & Classic, or Auto Body Repair & Paint. These two publications both have directories. In Hemmings, a color 1/4 page ad would run $1,700 per month for a year if signed by December 1, 2004, which provides a 15% discount. This averages out to $1,411 per insertion, even less for black and white. A quarter page ad in the Yellow Pages runs $1,200 a year.
- Join The Chamber of Commerce. The image of Phaethon’s Chariot Restorations would be elevated by joining the Chamber of Commerce. This would cost only $300 per year. Advertising on their electronic sign alongside the Interstate is free for 90 days. At present the sign would give 100 impressions per day to the shop. We expect this to increase Phaethon’s income by about 10% during that 90-day period.
- Advertising. Development of a top quality logo and photography which can be used in ads, brochures, name cards, etc. Not counting printing costs, which vary by quantity and quality of paper chosen, the design costs for this would run about $1,500. A day’s photography would be an additional $850-$1,600.
- Participation in Car Shows. Another image-building marketing tactic is participating in local car shows. These car shows are held just for the fun of it. This would require time and effort, but not much in the way of money. This should be coordinated to insure compatibility with the show’s concept and our image. If we attend a show out of the local area, costs would increase due to the expense of food, lodging, and protected transportation of a finished car to the show. A photo album can never compete with the real hardware.
In addition to the above-mentioned activities designed to elevate the company’s image, it is essential to market directly to the selected target clients who all go to local car shows. Success in making inroads into these names would set the stage for entry into the more prestigious auto restorers guild.
Marketing these prime prospects must be carried out in a thoughtful organized way. Color literature including the newly designed logo should be completed as a first step. When marketing these prospects it will be important to present a portfolio of Phaethon’s Chariot’s most innovative work. A relaxed face-to-face meeting, resulting in good communication between Phaethon’s Chariot and the project car’s owners, should be all that’s needed to generate a first order.
Networking is also very useful. It is important, once the logo and artwork materials have been completed, for the owner to make a point of introducing herself to important players in the restoration world surrounding Centerton. Good contacts include hot rod businesses, parts stores, custom car clubs, suppliers of paint, etc.
5.3 Sales Strategy
The marketing strategy discussed previously in this business plan will generate the desired sales. These sales will begin with our website, and the Chamber of Commerce. It is a stated objective to transfer the administrative burden away from the owner, freeing up his time to meet with clients, to network at car shows and events, and to market the shop to prospective clients. This means that someone else will be answering the incoming calls. This person must be carefully trained to recognize who must be called back immediately by the owner. The shop owner needs–and expects–close contact with the shop foreman. The shop is under pressure to produce the highest quality work possible, for example, a car that’s going to shows is going to foster sales. The owner must be armed with a cell phone and a pager. The important caller should be told that the owner will “call right back.” The more successful the marketing strategy is in making inroads into our share of the restoration market, the more important this communication response will become.
In respect to the prospect list of clients, it is essential that a “salesman’s” approach be adopted to insure an organized, orderly approach to each prospect. Notes need to be kept on each client. Follow-up and persistence will pay off.
5.3.1 Sales Forecast
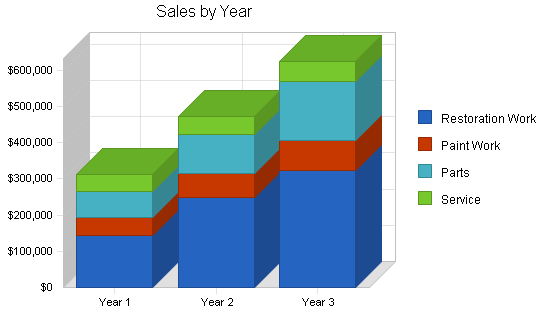
The Sales Forecast is divided up into the major categories of restoration work, paint work and service. Unit sales includes the yearly forecast of each per category, based on an average of 40 labor hours per item and forecasted capacity given the personnel changes mentioned in the Personnel Section. The category prices reflect the average cost per category, based on past pricing strategies. Since the company deals with providing custom services, this can vary wildly between jobs. Due to target market, estimated increase in category price is reflected in years 2004 and 2005. Direct category costs reflect direct costs in producing the items but does not including labor.
It is estimated that by FY 2006, revenues will reflect a 10% market share of the local restoration market, and that we will be completing one full restoration each month. As our market share becomes established we believe we can raise our shop rates from $45 to $50 and then to $55 per hour in years two and three of this plan. We will still be priced below the current rate charged by other area shops.
| Sales Forecast | |||
| Year 1 | Year 2 | Year 3 | |
| Sales | |||
| Restoration Work | $145,008 | $250,000 | $324,000 |
| Paint Work | $49,236 | $64,007 | $83,209 |
| Parts | $72,399 | $108,599 | $162,899 |
| Service | $44,400 | $48,800 | $53,600 |
| Total Sales | $311,044 | $471,406 | $623,707 |
| Direct Cost of Sales | Year 1 | Year 2 | Year 3 |
| Restoration Work | $26,717 | $50,000 | $64,800 |
| Paint Work | $9,063 | $12,801 | $16,642 |
| Parts | $13,000 | $19,548 | $29,322 |
| Service | $17,760 | $19,520 | $21,440 |
| Subtotal Direct Cost of Sales | $66,540 | $101,869 | $132,203 |
5.4 Milestones
The milestone table is set up as a flow-chart. The milestone table is specific in detail, allowing for the smooth flow of functions that are necessary to set up the restoration shop on schedule for the Grand Opening. Each function is timed to coincide with the proper execution and time needed to complete each task. Each manager has specific duties assigned specifically to his area of expertise. The end of the milestone table also shows the beginning of the 2005 marketing plan.

| Milestones | |||||
| Milestone | Start Date | End Date | Budget | Manager | Department |
| Company Identity | 7/10/2004 | 9/15/2004 | $7,500 | Isoroku | Marketing |
| Business Plan Review | 5/1/2004 | 8/1/2004 | $0 | Isoroku | Finance |
| Advertising | 12/1/2004 | 12/1/2005 | $42,000 | Isoroku | Marketing |
| Car Shows | 11/1/2004 | 5/1/2006 | $4,800 | Isoroku | Marketing |
| Employee Hired | 11/20/2004 | 11/16/2005 | $20,800 | Jane | HR |
| Grand Opening | 8/30/2004 | 10/15/2004 | $1,000 | Jane | Marketing |
| Totals | $76,100 | ||||
Web Plan Summary
Our website, is an opportunity to offer current information on our services, showcase some of our recent restorations, upcoming car shows, and special events.
Our website will be promoted on all major search engines. We will link to City Search.com® and many other classic car restoration oriented web sites and portals.
Also we promote to all of the blog directories, and on-line malls, and news outlets.
The owner has developed the company website. It offers the customer looking at it news about our business, and reasons why to restore their old cars, it also tells about the warranty on our work. The home page is a basic summarization of what our shop is all about, the overview page contains our mission statement.
The services page will tell you about the services that we offer, our news page will tell you about upcoming events and car shows. It also tells you about the car shows that we will sponsor at or shop.
Management Summary
Phaethon’s Chariot Restorations is currently made up of two employees who will put in a standard 40 hours of work per week, we intend that our shop will use no sub-contractors, and will hire new people as the volume of work demands.
7.1 Personnel Plan
All work is produced by our restoration staff and one shop foreman. All employees put in full 40-hour weeks. Additional technicians will be added where necessary and in line with success in penetrating the plan’s target market. By the end of March 2005, it is assumed that increased business volume will require two techs to put in a full 40-hour week. By the end of June 2005, increased volume will require hiring a new painter / body man working a 30-hour/week, and increasing to 40 hour/week by end of September. By the end 2006, Phaethon’s Chariot Restorations will have five techs working full-time. It is assumed that a sixth tech will be added in either FY 2007 or 2008, depending on demand volume.
| Personnel Plan | |||
| Year 1 | Year 2 | Year 3 | |
| Owner | $21,000 | $40,000 | $45,000 |
| Foreman | $17,400 | $22,400 | $30,000 |
| Sheet Metal & Body Technician(s) | $12,831 | $45,000 | $50,000 |
| Automotive Mechanic(s) | $15,162 | $52,000 | $58,000 |
| Painting Technician | $6,750 | $24,000 | $27,000 |
| Admin Asst. | $9,000 | $20,800 | $22,800 |
| Total People | 6 | 8 | 8 |
| Total Payroll | $82,143 | $204,200 | $232,800 |
Financial Plan
The business of Phaethon’s Chariot Restorations does not require substantial outlays for inventory and virtually all sales are on a cash/credit card basis, so increases in sales will not be accompanied by initial cash-flow deficits.
8.1 Start-up Funding
The start-up costs are to be financed by the owner’s personal investment and by a 7-year loan.
| Start-up Funding | |
| Start-up Expenses to Fund | $23,500 |
| Start-up Assets to Fund | $142,000 |
| Total Funding Required | $165,500 |
| Assets | |
| Non-cash Assets from Start-up | $132,000 |
| Cash Requirements from Start-up | $10,000 |
| Additional Cash Raised | $0 |
| Cash Balance on Starting Date | $10,000 |
| Total Assets | $142,000 |
| Liabilities and Capital | |
| Liabilities | |
| Current Borrowing | $0 |
| Long-term Liabilities | $119,000 |
| Accounts Payable (Outstanding Bills) | $6,000 |
| Other Current Liabilities (interest-free) | $5,500 |
| Total Liabilities | $130,500 |
| Capital | |
| Planned Investment | |
| Owner | $35,000 |
| Investor | $0 |
| Additional Investment Requirement | $0 |
| Total Planned Investment | $35,000 |
| Loss at Start-up (Start-up Expenses) | ($23,500) |
| Total Capital | $11,500 |
| Total Capital and Liabilities | $142,000 |
| Total Funding | $165,500 |
8.2 Break-even Analysis
The Break-even Analysis is based on the average of the first-year figures for total sales and average cost of sales, and by the averaged annual monthly operating expenses. These conservative assumptions make for a more accurate estimate of real risk, showing that we need to have the monthly sales shown in the table and chart below.

| Break-even Analysis | |
| Monthly Revenue Break-even | $20,506 |
| Assumptions: | |
| Average Percent Variable Cost | 21% |
| Estimated Monthly Fixed Cost | $16,120 |
8.3 Projected Profit and Loss
As the Profit and Loss table shows, the company expects to continue its steady growth in profitability over the next three years of operations.


| Pro Forma Profit and Loss | |||
| Year 1 | Year 2 | Year 3 | |
| Sales | $311,044 | $471,406 | $623,707 |
| Direct Cost of Sales | $66,540 | $101,869 | $132,203 |
| Other Costs of Sales | $0 | $0 | $0 |
| Total Cost of Sales | $66,540 | $101,869 | $132,203 |
| Gross Margin | $244,504 | $369,537 | $491,504 |
| Gross Margin % | 78.61% | 78.39% | 78.80% |
| Expenses | |||
| Payroll | $82,143 | $204,200 | $232,800 |
| Marketing/Promotion | $22,500 | $22,500 | $22,500 |
| Depreciation | $19,992 | $20,000 | $20,000 |
| Rent | $21,600 | $15,200 | $24,000 |
| Utilities | $15,200 | $24,000 | $0 |
| Insurance | $24,000 | $0 | $0 |
| Payroll Taxes | $0 | $0 | $0 |
| Fixtures | $8,000 | $0 | $0 |
| Total Operating Expenses | $193,435 | $285,900 | $299,300 |
| Profit Before Interest and Taxes | $51,069 | $83,637 | $192,204 |
| EBITDA | $71,061 | $103,637 | $212,204 |
| Interest Expense | $6,672 | $5,852 | $4,720 |
| Taxes Incurred | $13,319 | $23,335 | $56,245 |
| Net Profit | $31,078 | $54,449 | $131,239 |
| Net Profit/Sales | 9.99% | 11.55% | 21.04% |
8.4 Projected Cash Flow
As can be seen from the Cash Flow chart and table below, Phaethon’s Chariot Restorations has a number of advantages that provide for a large amount of growth in the company’s cash account. Because it is the company’s policy that the clients to provide the parts for the the restoration, the company has a very low cost of goods sold account and therefore a high gross margin. Clients can purchase the parts themselves, or if they prefer to have us make the purchase, we will locate the part, charge the customer’s credit card, and then purchase the part from the supplier/vendor.
Furthermore, the custom nature of the business means that there is no inventory cost to speak of or accounts payable. With the ability to generate so much cash flow, it is assumed that the company will seek to use this asset to expand its markets and production capacity in the near future.

| Pro Forma Cash Flow | |||
| Year 1 | Year 2 | Year 3 | |
| Cash Received | |||
| Cash from Operations | |||
| Cash Sales | $311,044 | $471,406 | $623,707 |
| Subtotal Cash from Operations | $311,044 | $471,406 | $623,707 |
| Additional Cash Received | |||
| Sales Tax, VAT, HST/GST Received | $20,716 | $31,396 | $41,539 |
| New Current Borrowing | $5,000 | $7,500 | $5,000 |
| New Other Liabilities (interest-free) | $0 | $0 | $0 |
| New Long-term Liabilities | $0 | $0 | $0 |
| Sales of Other Current Assets | $0 | $0 | $0 |
| Sales of Long-term Assets | $0 | $0 | $0 |
| New Investment Received | $0 | $0 | $0 |
| Subtotal Cash Received | $336,759 | $510,301 | $670,246 |
| Expenditures | Year 1 | Year 2 | Year 3 |
| Expenditures from Operations | |||
| Cash Spending | $82,143 | $204,200 | $232,800 |
| Bill Payments | $176,173 | $209,073 | $244,046 |
| Subtotal Spent on Operations | $258,316 | $413,273 | $476,846 |
| Additional Cash Spent | |||
| Sales Tax, VAT, HST/GST Paid Out | $20,716 | $31,396 | $41,539 |
| Principal Repayment of Current Borrowing | $3,500 | $6,000 | $7,500 |
| Other Liabilities Principal Repayment | $0 | $0 | $0 |
| Long-term Liabilities Principal Repayment | $16,476 | $17,492 | $18,570 |
| Purchase Other Current Assets | $0 | $0 | $0 |
| Purchase Long-term Assets | $2,400 | $4,000 | $4,000 |
| Dividends | $9,000 | $0 | $0 |
| Subtotal Cash Spent | $310,408 | $472,160 | $548,455 |
| Net Cash Flow | $26,352 | $38,141 | $121,792 |
| Cash Balance | $36,352 | $74,493 | $196,284 |
8.5 Projected Balance Sheet
The following table presents the Balance Sheet.
| Pro Forma Balance Sheet | |||
| Year 1 | Year 2 | Year 3 | |
| Assets | |||
| Current Assets | |||
| Cash | $36,352 | $74,493 | $196,284 |
| Inventory | $17,818 | $27,279 | $35,402 |
| Other Current Assets | $30,000 | $30,000 | $30,000 |
| Total Current Assets | $84,170 | $131,772 | $261,686 |
| Long-term Assets | |||
| Long-term Assets | $102,400 | $106,400 | $110,400 |
| Accumulated Depreciation | $19,992 | $39,992 | $59,992 |
| Total Long-term Assets | $82,408 | $66,408 | $50,408 |
| Total Assets | $166,578 | $198,180 | $312,094 |
| Liabilities and Capital | Year 1 | Year 2 | Year 3 |
| Current Liabilities | |||
| Accounts Payable | $23,476 | $16,621 | $20,366 |
| Current Borrowing | $1,500 | $3,000 | $500 |
| Other Current Liabilities | $5,500 | $5,500 | $5,500 |
| Subtotal Current Liabilities | $30,476 | $25,121 | $26,366 |
| Long-term Liabilities | $102,524 | $85,032 | $66,462 |
| Total Liabilities | $133,000 | $110,153 | $92,828 |
| Paid-in Capital | $35,000 | $35,000 | $35,000 |
| Retained Earnings | ($32,500) | ($1,422) | $53,027 |
| Earnings | $31,078 | $54,449 | $131,239 |
| Total Capital | $33,578 | $88,027 | $219,266 |
| Total Liabilities and Capital | $166,578 | $198,180 | $312,094 |
| Net Worth | $33,578 | $88,027 | $219,266 |
8.6 Business Ratios
Business ratios for the years of this plan are shown below. Industry profile ratios based on the Industry Standards, Antique and Classic Automobile Restoration services, SIC code 7532 are shown for comparison.
| Ratio Analysis | ||||
| Year 1 | Year 2 | Year 3 | Industry Profile | |
| Sales Growth | 0.00% | 51.56% | 32.31% | 1.55% |
| Percent of Total Assets | ||||
| Inventory | 10.70% | 13.76% | 11.34% | 9.44% |
| Other Current Assets | 18.01% | 15.14% | 9.61% | 29.30% |
| Total Current Assets | 50.53% | 66.49% | 83.85% | 52.30% |
| Long-term Assets | 49.47% | 33.51% | 16.15% | 47.70% |
| Total Assets | 100.00% | 100.00% | 100.00% | 100.00% |
| Current Liabilities | 18.30% | 12.68% | 8.45% | 20.70% |
| Long-term Liabilities | 61.55% | 42.91% | 21.30% | 28.94% |
| Total Liabilities | 79.84% | 55.58% | 29.74% | 49.64% |
| Net Worth | 20.16% | 44.42% | 70.26% | 50.36% |
| Percent of Sales | ||||
| Sales | 100.00% | 100.00% | 100.00% | 100.00% |
| Gross Margin | 78.61% | 78.39% | 78.80% | 100.00% |
| Selling, General & Administrative Expenses | 68.62% | 66.84% | 57.76% | 73.48% |
| Advertising Expenses | 6.43% | 1.40% | 1.40% | 1.33% |
| Profit Before Interest and Taxes | 16.42% | 17.74% | 30.82% | 0.60% |
| Main Ratios | ||||
| Current | 2.76 | 5.25 | 9.92 | 1.95 |
| Quick | 2.18 | 4.16 | 8.58 | 1.31 |
| Total Debt to Total Assets | 79.84% | 55.58% | 29.74% | 55.95% |
| Pre-tax Return on Net Worth | 132.22% | 88.36% | 85.51% | 1.18% |
| Pre-tax Return on Assets | 26.65% | 39.25% | 60.07% | 2.67% |
| Additional Ratios | Year 1 | Year 2 | Year 3 | |
| Net Profit Margin | 9.99% | 11.55% | 21.04% | n.a |
| Return on Equity | 92.55% | 61.86% | 59.85% | n.a |
| Activity Ratios | ||||
| Inventory Turnover | 5.98 | 4.52 | 4.22 | n.a |
| Accounts Payable Turnover | 8.25 | 12.17 | 12.17 | n.a |
| Payment Days | 28 | 36 | 27 | n.a |
| Total Asset Turnover | 1.87 | 2.38 | 2.00 | n.a |
| Debt Ratios | ||||
| Debt to Net Worth | 3.96 | 1.25 | 0.42 | n.a |
| Current Liab. to Liab. | 0.23 | 0.23 | 0.28 | n.a |
| Liquidity Ratios | ||||
| Net Working Capital | $53,694 | $106,651 | $235,320 | n.a |
| Interest Coverage | 7.65 | 14.29 | 40.72 | n.a |
| Additional Ratios | ||||
| Assets to Sales | 0.54 | 0.42 | 0.50 | n.a |
| Current Debt/Total Assets | 18% | 13% | 8% | n.a |
| Acid Test | 2.18 | 4.16 | 8.58 | n.a |
| Sales/Net Worth | 9.26 | 5.36 | 2.84 | n.a |
| Dividend Payout | 0.29 | 0.00 | 0.00 | n.a |
Appendix
| Sales Forecast | |||||||||||||
| Month 1 | Month 2 | Month 3 | Month 4 | Month 5 | Month 6 | Month 7 | Month 8 | Month 9 | Month 10 | Month 11 | Month 12 | ||
| Sales | |||||||||||||
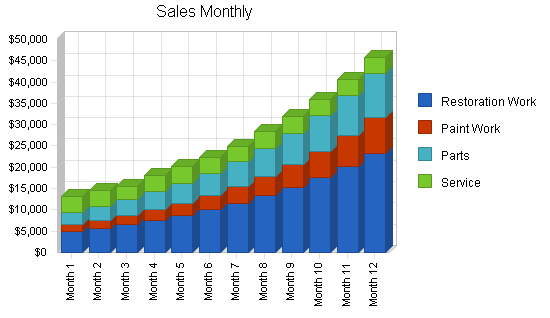
| Restoration Work | 0% | $5,000 | $5,750 | $6,613 | $7,604 | $8,745 | $10,057 | $11,565 | $13,300 | $15,295 | $17,589 | $20,228 | $23,262 |
| Paint Work | 0% | $1,500 | $1,755 | $2,053 | $2,402 | $2,811 | $3,289 | $3,848 | $4,502 | $5,267 | $6,163 | $7,210 | $8,436 |
| Parts | 0% | $3,000 | $3,360 | $3,763 | $4,215 | $4,721 | $5,287 | $5,921 | $6,632 | $7,428 | $8,319 | $9,318 | $10,436 |
| Service | 0% | $3,600 | $3,600 | $3,000 | $3,900 | $3,900 | $3,600 | $3,600 | $3,900 | $3,900 | $3,900 | $3,900 | $3,600 |
| Total Sales | $13,100 | $14,465 | $15,429 | $18,122 | $20,176 | $22,232 | $24,935 | $28,334 | $31,890 | $35,971 | $40,656 | $45,734 | |
| Direct Cost of Sales | Month 1 | Month 2 | Month 3 | Month 4 | Month 5 | Month 6 | Month 7 | Month 8 | Month 9 | Month 10 | Month 11 | Month 12 | |
| Restoration Work | 0% | $675 | $810 | $972 | $1,166 | $1,400 | $1,680 | $2,016 | $2,419 | $2,902 | $3,483 | $4,179 | $5,015 |
| Paint Work | 0% | $313 | $359 | $413 | $475 | $547 | $629 | $723 | $831 | $956 | $1,099 | $1,264 | $1,454 |
| Parts | 0% | $0 | $3,000 | $1,000 | $1,000 | $1,000 | $1,000 | $1,000 | $1,000 | $1,000 | $1,000 | $1,000 | $1,000 |
| Service | 0% | $1,440 | $1,440 | $1,200 | $1,560 | $1,560 | $1,440 | $1,440 | $1,560 | $1,560 | $1,560 | $1,560 | $1,440 |
| Subtotal Direct Cost of Sales | $2,428 | $5,609 | $3,585 | $4,202 | $4,506 | $4,748 | $5,178 | $5,810 | $6,418 | $7,142 | $8,004 | $8,909 | |
| Personnel Plan | |||||||||||||
| Month 1 | Month 2 | Month 3 | Month 4 | Month 5 | Month 6 | Month 7 | Month 8 | Month 9 | Month 10 | Month 11 | Month 12 | ||
| Owner | 0% | $1,000 | $1,000 | $1,000 | $2,000 | $2,000 | $2,000 | $2,000 | $2,000 | $2,000 | $2,000 | $2,000 | $2,000 |
| Foreman | 0% | $0 | $1,000 | $1,000 | $1,000 | $1,500 | $1,500 | $1,700 | $1,700 | $2,000 | $2,000 | $2,000 | $2,000 |
| Sheet Metal & Body Technician(s) | 0% | $0 | $0 | $0 | $0 | $0 | $1,833 | $1,833 | $1,833 | $1,833 | $1,833 | $1,833 | $1,833 |
| Automotive Mechanic(s) | 0% | $0 | $0 | $0 | $0 | $0 | $2,166 | $2,166 | $2,166 | $2,166 | $2,166 | $2,166 | $2,166 |
| Painting Technician | 0% | $0 | $0 | $0 | $0 | $0 | $0 | $0 | $0 | $1,500 | $1,500 | $1,750 | $2,000 |
| Admin Asst. | 0% | $0 | $0 | $0 | $1,000 | $1,000 | $1,000 | $1,000 | $1,000 | $1,000 | $1,000 | $1,000 | $1,000 |
| Total People | 1 | 2 | 2 | 3 | 3 | 5 | 5 | 5 | 6 | 6 | 6 | 6 | |
| Total Payroll | $1,000 | $2,000 | $2,000 | $4,000 | $4,500 | $8,499 | $8,699 | $8,699 | $10,499 | $10,499 | $10,749 | $10,999 | |
| Pro Forma Profit and Loss | |||||||||||||
| Month 1 | Month 2 | Month 3 | Month 4 | Month 5 | Month 6 | Month 7 | Month 8 | Month 9 | Month 10 | Month 11 | Month 12 | ||
| Sales | $13,100 | $14,465 | $15,429 | $18,122 | $20,176 | $22,232 | $24,935 | $28,334 | $31,890 | $35,971 | $40,656 | $45,734 | |
| Direct Cost of Sales | $2,428 | $5,609 | $3,585 | $4,202 | $4,506 | $4,748 | $5,178 | $5,810 | $6,418 | $7,142 | $8,004 | $8,909 | |
| Other Costs of Sales | $0 | $0 | $0 | $0 | $0 | $0 | $0 | $0 | $0 | $0 | $0 | $0 | |
| Total Cost of Sales | $2,428 | $5,609 | $3,585 | $4,202 | $4,506 | $4,748 | $5,178 | $5,810 | $6,418 | $7,142 | $8,004 | $8,909 | |
| Gross Margin | $10,673 | $8,856 | $11,844 | $13,920 | $15,670 | $17,484 | $19,756 | $22,524 | $25,472 | $28,829 | $32,652 | $36,824 | |
| Gross Margin % | 81.47% | 61.22% | 76.76% | 76.81% | 77.67% | 78.64% | 79.23% | 79.49% | 79.87% | 80.14% | 80.31% | 80.52% | |
| Expenses | |||||||||||||
| Payroll | $1,000 | $2,000 | $2,000 | $4,000 | $4,500 | $8,499 | $8,699 | $8,699 | $10,499 | $10,499 | $10,749 | $10,999 | |
| Marketing/Promotion | $0 | $1,000 | $1,000 | $1,500 | $1,500 | $2,500 | $2,500 | $2,500 | $2,500 | $2,500 | $2,500 | $2,500 | |
| Depreciation | $1,666 | $1,666 | $1,666 | $1,666 | $1,666 | $1,666 | $1,666 | $1,666 | $1,666 | $1,666 | $1,666 | $1,666 | |
| Rent | $1,800 | $1,800 | $1,800 | $1,800 | $1,800 | $1,800 | $1,800 | $1,800 | $1,800 | $1,800 | $1,800 | $1,800 | |
| Utilities | $2,000 | $1,200 | $1,200 | $1,200 | $1,200 | $1,200 | $1,200 | $1,200 | $1,200 | $1,200 | $1,200 | $1,200 | |
| Insurance | $2,000 | $2,000 | $2,000 | $2,000 | $2,000 | $2,000 | $2,000 | $2,000 | $2,000 | $2,000 | $2,000 | $2,000 | |
| Payroll Taxes | 15% | $0 | $0 | $0 | $0 | $0 | $0 | $0 | $0 | $0 | $0 | $0 | $0 |
| Fixtures | $1,000 | $1,000 | $1,200 | $300 | $300 | $300 | $300 | $300 | $300 | $1,000 | $1,000 | $1,000 | |
| Total Operating Expenses | $9,466 | $10,666 | $10,866 | $12,466 | $12,966 | $17,965 | $18,165 | $18,165 | $19,965 | $20,665 | $20,915 | $21,165 | |
| Profit Before Interest and Taxes | $1,207 | ($1,810) | $978 | $1,454 | $2,704 | ($481) | $1,591 | $4,359 | $5,507 | $8,164 | $11,737 | $15,659 | |
| EBITDA | $2,873 | ($144) | $2,644 | $3,120 | $4,370 | $1,185 | $3,257 | $6,025 | $7,173 | $9,830 | $13,403 | $17,325 | |
| Interest Expense | $588 | $590 | $587 | $572 | $561 | $554 | $548 | $549 | $534 | $527 | $536 | $525 | |
| Taxes Incurred | $185 | ($720) | $117 | $264 | $643 | ($311) | $313 | $1,143 | $1,492 | $2,291 | $3,360 | $4,540 | |
| Net Profit | $433 | ($1,680) | $273 | $617 | $1,500 | ($725) | $731 | $2,667 | $3,481 | $5,346 | $7,840 | $10,594 | |
| Net Profit/Sales | 3.30% | -11.62% | 1.77% | 3.41% | 7.43% | -3.26% | 2.93% | 9.41% | 10.92% | 14.86% | 19.28% | 23.16% | |
| Pro Forma Cash Flow | |||||||||||||
| Month 1 | Month 2 | Month 3 | Month 4 | Month 5 | Month 6 | Month 7 | Month 8 | Month 9 | Month 10 | Month 11 | Month 12 | ||
| Cash Received | |||||||||||||
| Cash from Operations | |||||||||||||
| Cash Sales | $13,100 | $14,465 | $15,429 | $18,122 | $20,176 | $22,232 | $24,935 | $28,334 | $31,890 | $35,971 | $40,656 | $45,734 | |
| Subtotal Cash from Operations | $13,100 | $14,465 | $15,429 | $18,122 | $20,176 | $22,232 | $24,935 | $28,334 | $31,890 | $35,971 | $40,656 | $45,734 | |
| Additional Cash Received | |||||||||||||
| Sales Tax, VAT, HST/GST Received | 6.66% | $872 | $963 | $1,028 | $1,207 | $1,344 | $1,481 | $1,661 | $1,887 | $2,124 | $2,396 | $2,708 | $3,046 |
| New Current Borrowing | $0 | $1,000 | $1,000 | $0 | $0 | $0 | $0 | $1,000 | $0 | $0 | $2,000 | $0 | |
| New Other Liabilities (interest-free) | $0 | $0 | $0 | $0 | $0 | $0 | $0 | $0 | $0 | $0 | $0 | $0 | |
| New Long-term Liabilities | $0 | $0 | $0 | $0 | $0 | $0 | $0 | $0 | $0 | $0 | $0 | $0 | |
| Sales of Other Current Assets | $0 | $0 | $0 | $0 | $0 | $0 | $0 | $0 | $0 | $0 | $0 | $0 | |
| Sales of Long-term Assets | $0 | $0 | $0 | $0 | $0 | $0 | $0 | $0 | $0 | $0 | $0 | $0 | |
| New Investment Received | $0 | $0 | $0 | $0 | $0 | $0 | $0 | $0 | $0 | $0 | $0 | $0 | |
| Subtotal Cash Received | $13,972 | $16,428 | $17,457 | $19,328 | $21,520 | $23,713 | $26,595 | $31,221 | $34,014 | $38,367 | $45,363 | $48,779 | |
| Expenditures | Month 1 | Month 2 | Month 3 | Month 4 | Month 5 | Month 6 | Month 7 | Month 8 | Month 9 | Month 10 | Month 11 | Month 12 | |
| Expenditures from Operations | |||||||||||||
| Cash Spending | $1,000 | $2,000 | $2,000 | $4,000 | $4,500 | $8,499 | $8,699 | $8,699 | $10,499 | $10,499 | $10,749 | $10,999 | |
| Bill Payments | $6,429 | $13,056 | $18,478 | $8,061 | $12,625 | $13,125 | $13,323 | $14,762 | $16,595 | $17,542 | $19,982 | $22,195 | |
| Subtotal Spent on Operations | $7,429 | $15,056 | $20,478 | $12,061 | $17,125 | $21,624 | $22,022 | $23,461 | $27,094 | $28,041 | $30,731 | $33,194 | |
| Additional Cash Spent | |||||||||||||
| Sales Tax, VAT, HST/GST Paid Out | $872 | $963 | $1,028 | $1,207 | $1,344 | $1,481 | $1,661 | $1,887 | $2,124 | $2,396 | $2,708 | $3,046 | |
| Principal Repayment of Current Borrowing | $0 | $0 | $500 | $1,000 | $500 | $0 | $0 | $0 | $1,000 | $0 | $0 | $500 | |
| Other Liabilities Principal Repayment | $0 | $0 | $0 | $0 | $0 | $0 | $0 | $0 | $0 | $0 | $0 | $0 | |
| Long-term Liabilities Principal Repayment | $1,336 | $1,342 | $1,349 | $1,356 | $1,363 | $1,370 | $1,376 | $1,383 | $1,390 | $1,397 | $1,404 | $1,410 | |
| Purchase Other Current Assets | $0 | $0 | $0 | $0 | $0 | $0 | $0 | $0 | $0 | $0 | $0 | $0 | |
| Purchase Long-term Assets | $200 | $200 | $200 | $200 | $200 | $200 | $200 | $200 | $200 | $200 | $200 | $200 | |
| Dividends | $0 | $0 | $0 | $1,000 | $1,000 | $1,000 | $1,000 | $1,000 | $1,000 | $1,000 | $1,000 | $1,000 | |
| Subtotal Cash Spent | $9,837 | $17,561 | $23,555 | $16,824 | $21,532 | $25,674 | $26,259 | $27,931 | $32,808 | $33,034 | $36,042 | $39,350 | |
| Net Cash Flow | $4,135 | ($1,133) | ($6,098) | $2,504 | ($12) | ($1,961) | $336 | $3,290 | $1,206 | $5,333 | $9,321 | $9,429 | |
| Cash Balance | $14,135 | $13,003 | $6,904 | $9,409 | $9,397 | $7,435 | $7,772 | $11,062 | $12,268 | $17,601 | $26,922 | $36,352 | |
| Pro Forma Balance Sheet | |||||||||||||
| Month 1 | Month 2 | Month 3 | Month 4 | Month 5 | Month 6 | Month 7 | Month 8 | Month 9 | Month 10 | Month 11 | Month 12 | ||
| Assets | Starting Balances | ||||||||||||
| Current Assets | |||||||||||||
| Cash | $10,000 | $14,135 | $13,003 | $6,904 | $9,409 | $9,397 | $7,435 | $7,772 | $11,062 | $12,268 | $17,601 | $26,922 | $36,352 |
| Inventory | $2,000 | $4,855 | $11,219 | $7,633 | $8,403 | $9,012 | $9,496 | $10,357 | $11,620 | $12,837 | $14,284 | $16,007 | $17,818 |
| Other Current Assets | $30,000 | $30,000 | $30,000 | $30,000 | $30,000 | $30,000 | $30,000 | $30,000 | $30,000 | $30,000 | $30,000 | $30,000 | $30,000 |
| Total Current Assets | $42,000 | $48,990 | $54,221 | $44,538 | $47,812 | $48,409 | $46,932 | $48,128 | $52,682 | $55,105 | $61,886 | $72,929 | $84,170 |
| Long-term Assets | |||||||||||||
| Long-term Assets | $100,000 | $100,200 | $100,400 | $100,600 | $100,800 | $101,000 | $101,200 | $101,400 | $101,600 | $101,800 | $102,000 | $102,200 | $102,400 |
| Accumulated Depreciation | $0 | $1,666 | $3,332 | $4,998 | $6,664 | $8,330 | $9,996 | $11,662 | $13,328 | $14,994 | $16,660 | $18,326 | $19,992 |
| Total Long-term Assets | $100,000 | $98,534 | $97,068 | $95,602 | $94,136 | $92,670 | $91,204 | $89,738 | $88,272 | $86,806 | $85,340 | $83,874 | $82,408 |
| Total Assets | $142,000 | $147,524 | $151,289 | $140,140 | $141,948 | $141,079 | $138,136 | $137,866 | $140,954 | $141,911 | $147,226 | $156,803 | $166,578 |
| Liabilities and Capital | Month 1 | Month 2 | Month 3 | Month 4 | Month 5 | Month 6 | Month 7 | Month 8 | Month 9 | Month 10 | Month 11 | Month 12 | |
| Current Liabilities | |||||||||||||
| Accounts Payable | $6,000 | $12,428 | $18,215 | $7,641 | $12,188 | $12,682 | $12,833 | $14,209 | $16,013 | $16,879 | $19,244 | $21,386 | $23,476 |
| Current Borrowing | $0 | $0 | $1,000 | $1,500 | $500 | $0 | $0 | $0 | $1,000 | $0 | $0 | $2,000 | $1,500 |
| Other Current Liabilities | $5,500 | $5,500 | $5,500 | $5,500 | $5,500 | $5,500 | $5,500 | $5,500 | $5,500 | $5,500 | $5,500 | $5,500 | $5,500 |
| Subtotal Current Liabilities | $11,500 | $17,928 | $24,715 | $14,641 | $18,188 | $18,182 | $18,333 | $19,709 | $22,513 | $22,379 | $24,744 | $28,886 | $30,476 |
| Long-term Liabilities | $119,000 | $117,664 | $116,322 | $114,973 | $113,617 | $112,254 | $110,884 | $109,508 | $108,125 | $106,735 | $105,338 | $103,934 | $102,524 |
| Total Liabilities | $130,500 | $135,592 | $141,037 | $129,614 | $131,805 | $130,436 | $129,217 | $129,217 | $130,638 | $129,114 | $130,082 | $132,820 | $133,000 |
| Paid-in Capital | $35,000 | $35,000 | $35,000 | $35,000 | $35,000 | $35,000 | $35,000 | $35,000 | $35,000 | $35,000 | $35,000 | $35,000 | $35,000 |
| Retained Earnings | ($23,500) | ($23,500) | ($23,500) | ($23,500) | ($24,500) | ($25,500) | ($26,500) | ($27,500) | ($28,500) | ($29,500) | ($30,500) | ($31,500) | ($32,500) |
| Earnings | $0 | $433 | ($1,247) | ($974) | ($357) | $1,143 | $418 | $1,149 | $3,816 | $7,297 | $12,643 | $20,484 | $31,078 |
| Total Capital | $11,500 | $11,933 | $10,253 | $10,526 | $10,143 | $10,643 | $8,918 | $8,649 | $10,316 | $12,797 | $17,143 | $23,984 | $33,578 |
| Total Liabilities and Capital | $142,000 | $147,524 | $151,289 | $140,140 | $141,948 | $141,079 | $138,136 | $137,866 | $140,954 | $141,911 | $147,226 | $156,803 | $166,578 |
| Net Worth | $11,500 | $11,933 | $10,253 | $10,526 | $10,143 | $10,643 | $8,918 | $8,649 | $10,316 | $12,797 | $17,143 | $23,984 | $33,578 |


