
Business Cashflow Solutions, Inc.
Executive Summary
Business Cashflow Solutions, Inc. offers small- and medium-sized businesses services that reduce invoicing expenses, speed receipt of monies, and allow authorization and recovery of paper drafts.

1.1 Objectives
- Total receivables of $38,000 in Year 1.
- Monthly receivables of $3,000 by the sixth month of operation.
- Minimum of 10% increase in receivables per month.
- Receivables of $10,000 per month by the eighteenth month of operation.
1.2 Mission
Business Cashflow Solutions, Inc., offers small- and medium-sized businesses access to services that increase available operating funds by automating accounts receivable for more timely payment, and allowing merchants to accept paper checks with confidence.
As a service company, we pledge to our customers:
- Exceptional value for all services rendered.
- Timely response to questions and concerns.
- Total honesty and integrity.
1.3 Keys to Success
- Direct, person-to-person marketing.
- Participation in professional business organizations.
- Frequent follow-up and reselling the value of our services.
Company Summary
Business Cashflow Solutions, Inc. is a new company that provides “instant cash flow for small- and medium-sized businesses” and reduces expenses associated with invoicing with the following services:
- Pre-Authorized Checking: Insures that monthly payments are received on time and therefore reduces invoicing costs.
- Electronic Payments: Offers timely funds settlements and a built-in recovery for NSF items, thereby keeping invoicing costs reduced.
- Electronic Check Conversion: Converts paper check into an electronic item at point-of-sale, saving time and money while reducing the risks of NSF checks.
- Electronic Check Recovery: NSF checks are submitted electronically via the ACH network, allowing fast and convenient collection of funds.
- Telephone Checks: Allows merchants to accept checks by telephone or fax.
2.1 Company Ownership
Business Cashflow Solutions is a Virginia corporation, subchapter S, based in Chesterfield County.
2.2 Start-up Summary
Our start-up costs come to $33,634. Start-up assets required include $5,885 in short-term assets (office furniture, office equipment, specialized printer, etc.) and $5,500 in initial cash to handle the first 6 months of expenses. The details are included in the following chart and table.
After planned owner investment of $10,000, you will find that we have $23,364 left to finance. The purpose of this plan is to secure financing for that amount.
Later in this plan, when you view the Balance Sheet, Cash Flow, and the Profit and Loss, you will notice that we have included debt and interest expenses based on an assumed $23,364 loan, financed at 9.5% for a 3-year term.

| Start-up | |
| Requirements | |
| Start-up Expenses | |
| License/Business Package | $19,990 |
| Stationery etc. | $350 |
| Apparel | $400 |
| Insurance | $207 |
| Computer (Internet, File Transfer) | $0 |
| Color Inkjet Printer | $0 |
| MICR Toner | $325 |
| Copier Toner | $89 |
| Software (Microsoft Office, Graphics, Internet Publishing, etc.) | $0 |
| Miscellaneous Office Supplies | $200 |
| Telephone Connections | $128 |
| Setup Answering Service | $20 |
| Pager | $40 |
| Cellular Phone | $150 |
| Web Site Hosting Setup | $25 |
| Chamber of Commerce Membership | $325 |
| Other | $0 |
| Total Start-up Expenses | $22,249 |
| Start-up Assets | |
| Cash Required | $5,500 |
| Other Current Assets | $5,885 |
| Long-term Assets | $0 |
| Total Assets | $11,385 |
| Total Requirements | $33,634 |
| Start-up Funding | |
| Start-up Expenses to Fund | $22,249 |
| Start-up Assets to Fund | $11,385 |
| Total Funding Required | $33,634 |
| Assets | |
| Non-cash Assets from Start-up | $5,885 |
| Cash Requirements from Start-up | $5,500 |
| Additional Cash Raised | $0 |
| Cash Balance on Starting Date | $5,500 |
| Total Assets | $11,385 |
| Liabilities and Capital | |
| Liabilities | |
| Current Borrowing | $23,634 |
| Long-term Liabilities | $0 |
| Accounts Payable (Outstanding Bills) | $0 |
| Other Current Liabilities (interest-free) | $0 |
| Total Liabilities | $23,634 |
| Capital | |
| Planned Investment | |
| XYXY | $10,000 |
| Other | $0 |
| Additional Investment Requirement | $0 |
| Total Planned Investment | $10,000 |
| Loss at Start-up (Start-up Expenses) | ($22,249) |
| Total Capital | ($12,249) |
| Total Capital and Liabilities | $11,385 |
| Total Funding | $33,634 |
2.3 Company Locations and Facilities
The office will be located in the residence of XYXY. There is a 200 square foot office area which will house the computer systems and laser printers that are utilized in providing our services.
Services
Business Cashflow Solutions, Inc. offers small- and medium-sized businesses services that reduce invoicing expenses, speed receipt of monies, allow for more payment options, and allow acceptance of paper checks.
3.1 Service Description
- Pre-authorized Checking: This service automatically drafts a customer’s monthly payments. This service is useful to businesses that provide monthly services, such as pest control companies, health clubs, child care facilities, apartment complexes, etc. Business owners save on expenses associated with billing and avoid delays in receivables, and their customers save time because their paper drafts are automatically generated and delivered to the merchant.
- Electronic Payments: This service allows business owners to process electronic payments through the Automated Clearing House (ACH) system. This benefits the customer with timely funds settlement, built-in recovery of NSF items, no cost for NSF items, and reliable cash flow. It also saves money versus mailing invoices, and allows for check acceptance via telephone.
- Electronic Check Conversion: This service converts a traditional paper check into an electronic item at point-of-sale and processes through the ACH. This saves time and money while reducing the risks of NSF checks. Checks are electronically deposited to the business owner’s account, and check verification is available at no additional cost.
- Electronic Check Recovery: This service enters NSF items into a database and re-submits them electronically via the ACH network. The business owner receives 100% face value of the check paid the week following collection and release of the funds. There is no cost to the business owner for this service.
- Telephone Checks: This service allows business owners to accept checks over the telephone. This allows credit card convenience to checking account customers, and saves the business owner versus accepting credit cards. Funds are deposited into the business owner’s account within 24 hours.
- Professional Billing Services: This service can save the business owner money, time, and the aggravation of trying to “do-it- yourself.” This service also gives an improved professional image and better control over slow payments. Promotional mailing pieces can be produced and enclosed with your bill.
- e-commerce: This service features ZZZZ, which allows online merchants to easily accept and process electronic check payments directly from their website. We can help plan, design, and implement a reliable, secure, and affordable e-commerce solution for the business owner.
3.2 Competitive Comparison
In the greater Richmond area there are approximately 6 licensees of ZZZZ. These range from inactive owners to established companies, with most being home-based. We believe that superior marketing and customer service will give us an edge on these competitors.
Nationwide, ZZZZ currently has approximately #### licensees. Of these, approximately 16 maintain a comprehensive website to market their services nationwide. Our website will be of the highest quality, and certainly competitive.
In addition, there are several large companies which offer similar services. TeleCheck® and Equifax® are two examples. Mostly, these companies offer check guarantee services, and are not as economical a solution for check acceptance to the small- and medium-sized businesses.
3.3 Sales Literature
Professional brochures are designed by and available from ZZZZ. As a licensee of ZZZZ, a complete set of copyrighted marketing materials and business forms are provided.
Examples of the sales literature are included with this business plan.
**Sales literature examples are not available with this sample plan.
3.4 Fulfillment
The key fulfillment and delivery will be provided by the principals of the business. The real core value is the combination of hard work, attention to detail, and strong sense of service.
3.5 Technology
Business Cashflow Solutions, Inc. will maintain several key systems including:
- Secure computer for maintenance of all customer files and fulfillment of services.
- Secondary computer with complete email facilities on the Internet and all necessary website development and publishing software for maintenance of our website which will allow customer prospecting, customer support, and contact.
- High-speed laser printer for creation of pre-authorized checks and marketing and sales literature.
3.6 Future Services
As a licensee of ZZZZ, Business Cashflow Solutions, Inc., will be able to offer all expanded services offered by ZZZZ. In the 5 years that ZZZZ has been in business, they have increased their services from only Pre-Authorized Checking to the current seven services described in section 3.1.

Market Analysis Summary
Business Cashflow Solutions, Inc. will be focusing on service companies that have regular, ongoing billings. In addition, we will be marketing our complete line of check acceptance products to all retail establishments.
For the purpose of this analysis, we have only included the Richmond-Petersburg MSA potential market. We believe this shows the huge potential market for these services in a quite conservative way, and allows for our success utilizing only this market. However, we will not be limiting our marketing efforts to the Richmond-Petersburg area. Other areas of direct marketing will be all areas of the state of Virginia. In addition, our Internet marketing allows potential customers from any area of the United States.
4.1 Market Segmentation
- Retail: our highest revenue producing segment will be large local businesses, such as grocery stores, that use check acceptance services. But all retail segments have a potential need for at least one of our services.
- Service: the biggest concentration of business will be service companies, such as pest control, alarm monitoring, lawn care, child care facilities, etc., that can utilize our pre-authorized checking and electronic payments services. All service companies represent potential customers for one or more of our services.

| Market Analysis | |||||||
| Year 1 | Year 2 | Year 3 | Year 4 | Year 5 | |||
| Potential Customers | Growth | CAGR | |||||
| Retail (Richmond-Petersburg MSA) | 1% | 5,126 | 5,182 | 5,239 | 5,297 | 5,355 | 1.10% |
| Services (Richmond-Petersburg MSA) | 3% | 10,633 | 10,963 | 11,303 | 11,653 | 12,014 | 3.10% |
| Other | 0% | 0 | 0 | 0 | 0 | 0 | 0.00% |
| Total | 2.46% | 15,759 | 16,145 | 16,542 | 16,950 | 17,369 | 2.46% |
4.2 Target Market Segment Strategy
Our target market is comprised of service and retail businesses because of the nature of the services we provide.
We need to focus our marketing efforts at a local level, allowing growth in other areas to be a source of additional revenues that we will not be dependent on for success.
4.2.1 Market Trends
Trends are in our favor. According to an article in Business Week’s June 22, 1998 issue, “there was a 100% increase in the number of checks cut since 1992 due to small-biz growth.”
The service and retail industries have experienced strong growth historically; and consumer spending and confidence are at all-time highs, and are continuing to grow.
The trend to outsource services is established for businesses, and will see increases as finding employees to staff positions continues to become more difficult.
4.2.2 Market Growth
Limiting ourselves to the Richmond-Petersburg MSA, we see more than 400 retail and service businesses per year, according to information gathered from the Greater Richmond Partnership and the U.S. Census Bureau. These numbers allow for new customer acquisition sufficient to sustain Business Cashflow Solution, Inc.’s ongoing operating objectives.
4.2.3 Market Needs
Since our target is the small- and medium-sized business, one of the underlying needs is for increased cash flow. The key points of our services is that they allow for the expedition of receivables, while saving the business money in invoicing expenses.
4.3 Service Business Analysis
The licensee base of ZZZZ consists of over #### nationwide. While a licensee is not assigned a territory and is free to operate his business anywhere, ZZZZ is committed to establishing only a select number of payment processing centers in any geographic area, to reach their goal of 2.5% of the market.
4.3.1 Business Participants
At the highest level are the few well-established names in point-of-sale check authorization. Most of these offer similar but different services, revolving around a high fee to guarantee checks against return.
4.3.2 Competition and Buying Patterns
In many respects, competition is non-existent for our services. Small- and medium-sized businesses generally cannot utilize pre-authorized checks and electronic payments on their own. These options are mostly reserved for large organizations such as insurance companies and banks.
Pricing for these services is well below what most businesses spend to invoice customers, and these services have met with wide approval throughout the United States.
The most important element of general competition is what it takes to retain customers, as these services are highly price competitive. It is worth making great efforts to maintain personal relationships with our customer base so that we are able to make concessions where necessary to retain customers.
Strategy and Implementation Summary
Business Cashflow Solutions, Inc. will focus its marketing and sales on the Richmond-Petersburg area. In addition, we will make sales calls throughout Virginia, and maintain a website for nationwide sales prospecting.
The target customers are retail stores and service industries.
5.1 Strategy Pyramid
Our marketing will revolve around direct targeted mailings, Internet marketing to retail and service businesses, and speaking opportunities at the local level.
- Direct mailing: We will retain the services of a local company that specializes in direct mail promotions. Mailings will be targeted to business types and geographic areas.
- Internet marketing: A comprehensive website will feature services, pricing, and contact information. We will contract the services of The Omni Group, who specializes in driving targeted traffic to Internet storefronts, to promote our site.
- Speaking opportunities: We will seek out and solicit opportunities to speak at industry association meetings, business seminars, etc.
5.2 Sales Strategy
Our pricing will follow the models set out by ZZZZ. Some services are a set rate which pay a commission to our company (such is the case with Electronic Check Recovery, for example). Example pricing is included as an attachment to this business plan.
**Attachments not available for this sample plan.
5.3 Promotion Strategy
We will be contracting with a local agency to provide direct mailings. Promotional items will be left at sales calls to keep our name in front of the prospect. We will also focus on speaking opportunities at local organizations.
5.4 Value Proposition
The sales in our business will revolve around the direct efforts of XYXY. Initially, XYXY will be spending 20 hours per week cold-calling businesses to develop customer relationships.
Additional sales efforts will be directed to leads generated by our website and direct mailings. It is important that we respond promptly to these leads, as these customers will be ready to make a buying decision.
5.4.1 Sales Forecast
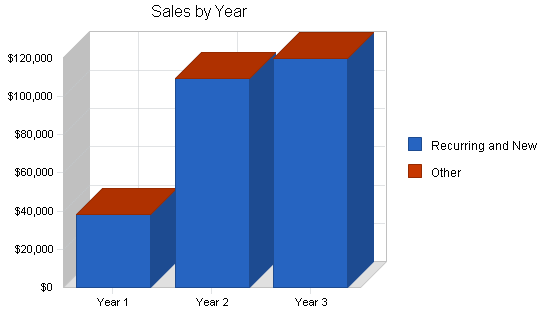
The following chart and table give a run-down on forecasted sales. We expect a minimum growth of 10% per month for the first 18 months, leveling off at $10,000 per month during the third year.
In our business, the services we provide also have recurring monthly fees included. The sales forecast incorporates in these recurring fee into the new sales for the total sales volume. In the following table, we refer to all sales as one group.

| Sales Forecast | |||
| Year 1 | Year 2 | Year 3 | |
| Sales | |||
| Recurring and New | $38,000 | $109,700 | $120,000 |
| Other | $0 | $0 | $0 |
| Total Sales | $38,000 | $109,700 | $120,000 |
| Direct Cost of Sales | Year 1 | Year 2 | Year 3 |
| Recurring and New | $0 | $0 | $0 |
| Other | $0 | $0 | $0 |
| Subtotal Direct Cost of Sales | $0 | $0 | $0 |
Management Summary
We are a small company, owned and operated by XYXY, as a subchapter S corporation.
XYXY- President
XYXY will be the salesperson. He will also be responsible for marketing and promotion of services. He will develop and maintain the company website. He will be responsible for desktop publishing for the company. He will lecture at speaking engagements. He will assist in bookkeeping and clerical functions.
XXXX- Secretary-Treasurer
XXXX will maintain all the company records and be in direct contact with the accountant. She will be responsible for data entry of all customer files. She will assist in desktop publishing of marketing materials.
The management team consists entirely of the founders themselves.
6.1 Personnel Plan
Our plan is for the owners to hold unsalaried positions until January 2001. At that point, they will each receive a salary of $28,000 per year, increasing to $40,800 per year in 2002. These figures are reflected in the following table as well as in the Profit and Loss table.
| Personnel Plan | |||
| Year 1 | Year 2 | Year 3 | |
| XYXY | $2,400 | $28,800 | $40,800 |
| XXXX | $2,400 | $28,800 | $40,800 |
| Other | $0 | $0 | $0 |
| Total People | 0 | 0 | 0 |
| Total Payroll | $4,800 | $57,600 | $81,600 |
6.2 Management Team
XYXY will be directly responsible for administration and sales. XXXX will be responsible for clerical and bookkeeping.
As soon as a positive cash flow of $3,000 per month is achieved, 2 commissioned salespeople will be hired as independent contractors. Our plan is to recruit these 2 salespeople in major metropolitan areas outside of Virginia.
6.3 Management Team Gaps
The owner has been working in an environment in which decisions about marketing and advertising sources were made by upper management. ZZZZ will be our source for marketing materials, brochures, and advertising materials. They offer a comprehensive support system for their licensees in all aspects of day-to-day business, and we will rely heavily on this support system.
Another task that is not an area of expertise is accounting and tax issues. XYXY’s CPA will be contracted to oversee our bookkeeping and cash management.
Financial Plan
Business Cashflow Solutions, Inc. is seeking a $23,634 financial package, based on assumptions of a loan financed at 9.5% interest for a 3-year term. The following projections reflect this loan amount.
7.1 Important Assumptions
General assumptions for this plan are on the following table.
| General Assumptions | |||
| Year 1 | Year 2 | Year 3 | |
| Plan Month | 1 | 2 | 3 |
| Current Interest Rate | 9.50% | 9.50% | 9.50% |
| Long-term Interest Rate | 9.50% | 9.50% | 9.50% |
| Tax Rate | 25.42% | 25.00% | 25.42% |
| Other | 0 | 0 | 0 |
7.2 Break-even Analysis
Our Break-even Analysis is shown below.

| Break-even Analysis | |
| Monthly Revenue Break-even | $1,198 |
| Assumptions: | |
| Average Percent Variable Cost | 0% |
| Estimated Monthly Fixed Cost | $1,198 |
7.3 Key Financial Indicators
The following benchmark chart indicates our key financial indicators for the first three years. We foresee major growth in sales, with only the normal inflation rates affecting our day to day operating expenses. There is a significant increase in operating costs for the Fiscal Years 2001 and 2002, attributed to the start of payroll for the principals.

7.4 Projected Profit and Loss
The financial plan depends on carefully researched operating expenses. Actual cost was used in calculating these expenses.
It is important to note that the Projected Profit and loss does not reflect any cost of sales. These costs are included in our actual operating expenses. The main reason this is so is that many of the services we provide have virtually no direct cost, as they are paid to our company as commissions.


| Pro Forma Profit and Loss | |||
| Year 1 | Year 2 | Year 3 | |
| Sales | $38,000 | $109,700 | $120,000 |
| Direct Cost of Sales | $0 | $0 | $0 |
| Other | $0 | $0 | $0 |
| Total Cost of Sales | $0 | $0 | $0 |
| Gross Margin | $38,000 | $109,700 | $120,000 |
| Gross Margin % | 100.00% | 100.00% | 100.00% |
| Expenses | |||
| Payroll | $4,800 | $57,600 | $81,600 |
| Sales and Marketing and Other Expenses | $9,312 | $10,350 | $13,950 |
| Depreciation | $0 | $0 | $0 |
| Leased Equipment | $0 | $0 | $0 |
| Utilities | $0 | $0 | $0 |
| Insurance | $207 | $228 | $261 |
| Rent | $0 | $0 | $0 |
| Payroll Taxes | $60 | $720 | $1,020 |
| Other | $0 | $0 | $0 |
| Total Operating Expenses | $14,379 | $68,898 | $96,831 |
| Profit Before Interest and Taxes | $23,621 | $40,802 | $23,169 |
| EBITDA | $23,621 | $40,802 | $23,169 |
| Interest Expense | $1,778 | $951 | $260 |
| Taxes Incurred | $5,403 | $9,963 | $5,823 |
| Net Profit | $16,441 | $29,888 | $17,087 |
| Net Profit/Sales | 43.26% | 27.25% | 14.24% |
7.5 Projected Cash Flow
The following table shows cash flow for the first three years, and the chart illustrates monthly cash flow in the first year. Monthly cash flow projections are included in the appendix.

| Pro Forma Cash Flow | |||
| Year 1 | Year 2 | Year 3 | |
| Cash Received | |||
| Cash from Operations | |||
| Cash Sales | $38,000 | $109,700 | $120,000 |
| Cash from Receivables | $0 | $0 | $0 |
| Subtotal Cash from Operations | $38,000 | $109,700 | $120,000 |
| Additional Cash Received | |||
| Sales Tax, VAT, HST/GST Received | $0 | $0 | $0 |
| New Current Borrowing | $0 | $0 | $0 |
| New Other Liabilities (interest-free) | $0 | $0 | $0 |
| New Long-term Liabilities | $0 | $0 | $0 |
| Sales of Other Current Assets | $0 | $0 | $0 |
| Sales of Long-term Assets | $0 | $0 | $0 |
| New Investment Received | $0 | $0 | $0 |
| Subtotal Cash Received | $38,000 | $109,700 | $120,000 |
| Expenditures | Year 1 | Year 2 | Year 3 |
| Expenditures from Operations | |||
| Cash Spending | $4,800 | $57,600 | $81,600 |
| Bill Payments | $15,780 | $21,366 | $21,387 |
| Subtotal Spent on Operations | $20,580 | $78,966 | $102,987 |
| Additional Cash Spent | |||
| Sales Tax, VAT, HST/GST Paid Out | $0 | $0 | $0 |
| Principal Repayment of Current Borrowing | $9,084 | $9,084 | $5,466 |
| Other Liabilities Principal Repayment | $0 | $0 | $0 |
| Long-term Liabilities Principal Repayment | $0 | $0 | $0 |
| Purchase Other Current Assets | $0 | $0 | $0 |
| Purchase Long-term Assets | $0 | $0 | $0 |
| Dividends | $0 | $0 | $0 |
| Subtotal Cash Spent | $29,664 | $88,050 | $108,453 |
| Net Cash Flow | $8,336 | $21,650 | $11,547 |
| Cash Balance | $13,836 | $35,487 | $47,033 |
7.6 Projected Balance Sheet
The balance sheet in the following table shows a healthy increase in total capital and net worth. The monthly estimates are included in the appendix.
| Pro Forma Balance Sheet | |||
| Year 1 | Year 2 | Year 3 | |
| Assets | |||
| Current Assets | |||
| Cash | $13,836 | $35,487 | $47,033 |
| Accounts Receivable | $0 | $0 | $0 |
| Other Current Assets | $5,885 | $5,885 | $5,885 |
| Total Current Assets | $19,721 | $41,372 | $52,918 |
| Long-term Assets | |||
| Long-term Assets | $0 | $0 | $0 |
| Accumulated Depreciation | $0 | $0 | $0 |
| Total Long-term Assets | $0 | $0 | $0 |
| Total Assets | $19,721 | $41,372 | $52,918 |
| Liabilities and Capital | Year 1 | Year 2 | Year 3 |
| Current Liabilities | |||
| Accounts Payable | $980 | $1,826 | $1,752 |
| Current Borrowing | $14,550 | $5,466 | $0 |
| Other Current Liabilities | $0 | $0 | $0 |
| Subtotal Current Liabilities | $15,530 | $7,292 | $1,752 |
| Long-term Liabilities | $0 | $0 | $0 |
| Total Liabilities | $15,530 | $7,292 | $1,752 |
| Paid-in Capital | $10,000 | $10,000 | $10,000 |
| Retained Earnings | ($22,249) | ($5,808) | $24,080 |
| Earnings | $16,441 | $29,888 | $17,087 |
| Total Capital | $4,192 | $34,080 | $51,167 |
| Total Liabilities and Capital | $19,721 | $41,372 | $52,918 |
| Net Worth | $4,192 | $34,080 | $51,167 |
7.7 Business Ratios
The following table shows the projected businesses ratios. We expect to maintain healthy ratios for profitability, risk, and return. These ratios have been determined by the 7389 industry, as found in the Standard Industry Code (SIC) Index.
| Ratio Analysis | ||||
| Year 1 | Year 2 | Year 3 | Industry Profile | |
| Sales Growth | 0.00% | 188.68% | 9.39% | 8.20% |
| Percent of Total Assets | ||||
| Accounts Receivable | 0.00% | 0.00% | 0.00% | 26.30% |
| Other Current Assets | 29.84% | 14.22% | 11.12% | 44.20% |
| Total Current Assets | 100.00% | 100.00% | 100.00% | 74.30% |
| Long-term Assets | 0.00% | 0.00% | 0.00% | 25.70% |
| Total Assets | 100.00% | 100.00% | 100.00% | 100.00% |
| Current Liabilities | 78.75% | 17.62% | 3.31% | 49.00% |
| Long-term Liabilities | 0.00% | 0.00% | 0.00% | 13.80% |
| Total Liabilities | 78.75% | 17.62% | 3.31% | 62.80% |
| Net Worth | 21.25% | 82.38% | 96.69% | 37.20% |
| Percent of Sales | ||||
| Sales | 100.00% | 100.00% | 100.00% | 100.00% |
| Gross Margin | 100.00% | 100.00% | 100.00% | 0.00% |
| Selling, General & Administrative Expenses | 56.89% | 78.17% | 92.59% | 81.40% |
| Advertising Expenses | 11.21% | 4.56% | 6.67% | 1.70% |
| Profit Before Interest and Taxes | 62.16% | 37.19% | 19.31% | 2.10% |
| Main Ratios | ||||
| Current | 1.27 | 5.67 | 30.21 | 1.49 |
| Quick | 1.27 | 5.67 | 30.21 | 1.17 |
| Total Debt to Total Assets | 78.75% | 17.62% | 3.31% | 62.80% |
| Pre-tax Return on Net Worth | 521.11% | 116.93% | 44.77% | 4.20% |
| Pre-tax Return on Assets | 110.76% | 96.32% | 43.29% | 11.30% |
| Additional Ratios | Year 1 | Year 2 | Year 3 | |
| Net Profit Margin | 43.26% | 27.25% | 14.24% | n.a |
| Return on Equity | 392.22% | 87.70% | 33.39% | n.a |
| Activity Ratios | ||||
| Accounts Receivable Turnover | 0.00 | 0.00 | 0.00 | n.a |
| Collection Days | 0 | 0 | 0 | n.a |
| Accounts Payable Turnover | 17.11 | 12.17 | 12.17 | n.a |
| Payment Days | 27 | 23 | 31 | n.a |
| Total Asset Turnover | 1.93 | 2.65 | 2.27 | n.a |
| Debt Ratios | ||||
| Debt to Net Worth | 3.70 | 0.21 | 0.03 | n.a |
| Current Liab. to Liab. | 1.00 | 1.00 | 1.00 | n.a |
| Liquidity Ratios | ||||
| Net Working Capital | $4,192 | $34,080 | $51,167 | n.a |
| Interest Coverage | 13.29 | 42.92 | 89.24 | n.a |
| Additional Ratios | ||||
| Assets to Sales | 0.52 | 0.38 | 0.44 | n.a |
| Current Debt/Total Assets | 79% | 18% | 3% | n.a |
| Acid Test | 1.27 | 5.67 | 30.21 | n.a |
| Sales/Net Worth | 9.07 | 3.22 | 2.35 | n.a |
| Dividend Payout | 0.00 | 0.00 | 0.00 | n.a |
Appendix
| Sales Forecast | |||||||||||||
| Month 1 | Month 2 | Month 3 | Month 4 | Month 5 | Month 6 | Month 7 | Month 8 | Month 9 | Month 10 | Month 11 | Month 12 | ||
| Sales | |||||||||||||
| Recurring and New | 0% | $0 | $500 | $1,500 | $2,000 | $2,500 | $3,000 | $3,500 | $4,000 | $4,500 | $5,000 | $5,500 | $6,000 |
| Other | 0% | $0 | $0 | $0 | $0 | $0 | $0 | $0 | $0 | $0 | $0 | $0 | $0 |
| Total Sales | $0 | $500 | $1,500 | $2,000 | $2,500 | $3,000 | $3,500 | $4,000 | $4,500 | $5,000 | $5,500 | $6,000 | |
| Direct Cost of Sales | Month 1 | Month 2 | Month 3 | Month 4 | Month 5 | Month 6 | Month 7 | Month 8 | Month 9 | Month 10 | Month 11 | Month 12 | |
| Recurring and New | $0 | $0 | $0 | $0 | $0 | $0 | $0 | $0 | $0 | $0 | $0 | $0 | |
| Other | $0 | $0 | $0 | $0 | $0 | $0 | $0 | $0 | $0 | $0 | $0 | $0 | |
| Subtotal Direct Cost of Sales | $0 | $0 | $0 | $0 | $0 | $0 | $0 | $0 | $0 | $0 | $0 | $0 | |
| General Assumptions | |||||||||||||
| Month 1 | Month 2 | Month 3 | Month 4 | Month 5 | Month 6 | Month 7 | Month 8 | Month 9 | Month 10 | Month 11 | Month 12 | ||
| Plan Month | 1 | 2 | 3 | 4 | 5 | 6 | 7 | 8 | 9 | 10 | 11 | 12 | |
| Current Interest Rate | 9.50% | 9.50% | 9.50% | 9.50% | 9.50% | 9.50% | 9.50% | 9.50% | 9.50% | 9.50% | 9.50% | 9.50% | |
| Long-term Interest Rate | 9.50% | 9.50% | 9.50% | 9.50% | 9.50% | 9.50% | 9.50% | 9.50% | 9.50% | 9.50% | 9.50% | 9.50% | |
| Tax Rate | 30.00% | 25.00% | 25.00% | 25.00% | 25.00% | 25.00% | 25.00% | 25.00% | 25.00% | 25.00% | 25.00% | 25.00% | |
| Other | 0 | 0 | 0 | 0 | 0 | 0 | 0 | 0 | 0 | 0 | 0 | 0 | |
| Pro Forma Profit and Loss | |||||||||||||
| Month 1 | Month 2 | Month 3 | Month 4 | Month 5 | Month 6 | Month 7 | Month 8 | Month 9 | Month 10 | Month 11 | Month 12 | ||
| Sales | $0 | $500 | $1,500 | $2,000 | $2,500 | $3,000 | $3,500 | $4,000 | $4,500 | $5,000 | $5,500 | $6,000 | |
| Direct Cost of Sales | $0 | $0 | $0 | $0 | $0 | $0 | $0 | $0 | $0 | $0 | $0 | $0 | |
| Other | $0 | $0 | $0 | $0 | $0 | $0 | $0 | $0 | $0 | $0 | $0 | $0 | |
| Total Cost of Sales | $0 | $0 | $0 | $0 | $0 | $0 | $0 | $0 | $0 | $0 | $0 | $0 | |
| Gross Margin | $0 | $500 | $1,500 | $2,000 | $2,500 | $3,000 | $3,500 | $4,000 | $4,500 | $5,000 | $5,500 | $6,000 | |
| Gross Margin % | 0.00% | 100.00% | 100.00% | 100.00% | 100.00% | 100.00% | 100.00% | 100.00% | 100.00% | 100.00% | 100.00% | 100.00% | |
| Expenses | |||||||||||||
| Payroll | $0 | $0 | $0 | $0 | $0 | $0 | $0 | $0 | $0 | $0 | $0 | $4,800 | |
| Sales and Marketing and Other Expenses | $776 | $776 | $776 | $776 | $776 | $776 | $776 | $776 | $776 | $776 | $776 | $776 | |
| Depreciation | $0 | $0 | $0 | $0 | $0 | $0 | $0 | $0 | $0 | $0 | $0 | $0 | |
| Leased Equipment | $0 | $0 | $0 | $0 | $0 | $0 | $0 | $0 | $0 | $0 | $0 | $0 | |
| Utilities | $0 | $0 | $0 | $0 | $0 | $0 | $0 | $0 | $0 | $0 | $0 | $0 | |
| Insurance | $207 | $0 | $0 | $0 | $0 | $0 | $0 | $0 | $0 | $0 | $0 | $0 | |
| Rent | $0 | $0 | $0 | $0 | $0 | $0 | $0 | $0 | $0 | $0 | $0 | $0 | |
| Payroll Taxes | 1% | $0 | $0 | $0 | $0 | $0 | $0 | $0 | $0 | $0 | $0 | $0 | $60 |
| Other | $0 | $0 | $0 | $0 | $0 | $0 | $0 | $0 | $0 | $0 | $0 | $0 | |
| Total Operating Expenses | $983 | $776 | $776 | $776 | $776 | $776 | $776 | $776 | $776 | $776 | $776 | $5,636 | |
| Profit Before Interest and Taxes | ($983) | ($276) | $724 | $1,224 | $1,724 | $2,224 | $2,724 | $3,224 | $3,724 | $4,224 | $4,724 | $364 | |
| EBITDA | ($983) | ($276) | $724 | $1,224 | $1,724 | $2,224 | $2,724 | $3,224 | $3,724 | $4,224 | $4,724 | $364 | |
| Interest Expense | $181 | $175 | $169 | $163 | $157 | $151 | $145 | $139 | $133 | $127 | $121 | $115 | |
| Taxes Incurred | ($349) | ($113) | $139 | $265 | $392 | $518 | $645 | $771 | $898 | $1,024 | $1,151 | $62 | |
| Net Profit | ($815) | ($338) | $416 | $796 | $1,175 | $1,555 | $1,934 | $2,314 | $2,693 | $3,073 | $3,452 | $187 | |
| Net Profit/Sales | 0.00% | -67.67% | 27.74% | 39.78% | 47.01% | 51.82% | 55.26% | 57.84% | 59.85% | 61.45% | 62.77% | 3.11% | |
| Pro Forma Cash Flow | |||||||||||||
| Month 1 | Month 2 | Month 3 | Month 4 | Month 5 | Month 6 | Month 7 | Month 8 | Month 9 | Month 10 | Month 11 | Month 12 | ||
| Cash Received | |||||||||||||
| Cash from Operations | |||||||||||||
| Cash Sales | $0 | $500 | $1,500 | $2,000 | $2,500 | $3,000 | $3,500 | $4,000 | $4,500 | $5,000 | $5,500 | $6,000 | |
| Cash from Receivables | $0 | $0 | $0 | $0 | $0 | $0 | $0 | $0 | $0 | $0 | $0 | $0 | |
| Subtotal Cash from Operations | $0 | $500 | $1,500 | $2,000 | $2,500 | $3,000 | $3,500 | $4,000 | $4,500 | $5,000 | $5,500 | $6,000 | |
| Additional Cash Received | |||||||||||||
| Sales Tax, VAT, HST/GST Received | 0.00% | $0 | $0 | $0 | $0 | $0 | $0 | $0 | $0 | $0 | $0 | $0 | $0 |
| New Current Borrowing | $0 | $0 | $0 | $0 | $0 | $0 | $0 | $0 | $0 | $0 | $0 | $0 | |
| New Other Liabilities (interest-free) | $0 | $0 | $0 | $0 | $0 | $0 | $0 | $0 | $0 | $0 | $0 | $0 | |
| New Long-term Liabilities | $0 | $0 | $0 | $0 | $0 | $0 | $0 | $0 | $0 | $0 | $0 | $0 | |
| Sales of Other Current Assets | $0 | $0 | $0 | $0 | $0 | $0 | $0 | $0 | $0 | $0 | $0 | $0 | |
| Sales of Long-term Assets | $0 | $0 | $0 | $0 | $0 | $0 | $0 | $0 | $0 | $0 | $0 | $0 | |
| New Investment Received | $0 | $0 | $0 | $0 | $0 | $0 | $0 | $0 | $0 | $0 | $0 | $0 | |
| Subtotal Cash Received | $0 | $500 | $1,500 | $2,000 | $2,500 | $3,000 | $3,500 | $4,000 | $4,500 | $5,000 | $5,500 | $6,000 | |
| Expenditures | Month 1 | Month 2 | Month 3 | Month 4 | Month 5 | Month 6 | Month 7 | Month 8 | Month 9 | Month 10 | Month 11 | Month 12 | |
| Expenditures from Operations | |||||||||||||
| Cash Spending | $0 | $0 | $0 | $0 | $0 | $0 | $0 | $0 | $0 | $0 | $0 | $4,800 | |
| Bill Payments | $27 | $816 | $847 | $1,088 | $1,208 | $1,329 | $1,449 | $1,570 | $1,690 | $1,811 | $1,931 | $2,013 | |
| Subtotal Spent on Operations | $27 | $816 | $847 | $1,088 | $1,208 | $1,329 | $1,449 | $1,570 | $1,690 | $1,811 | $1,931 | $6,813 | |
| Additional Cash Spent | |||||||||||||
| Sales Tax, VAT, HST/GST Paid Out | $0 | $0 | $0 | $0 | $0 | $0 | $0 | $0 | $0 | $0 | $0 | $0 | |
| Principal Repayment of Current Borrowing | $757 | $757 | $757 | $757 | $757 | $757 | $757 | $757 | $757 | $757 | $757 | $757 | |
| Other Liabilities Principal Repayment | $0 | $0 | $0 | $0 | $0 | $0 | $0 | $0 | $0 | $0 | $0 | $0 | |
| Long-term Liabilities Principal Repayment | $0 | $0 | $0 | $0 | $0 | $0 | $0 | $0 | $0 | $0 | $0 | $0 | |
| Purchase Other Current Assets | $0 | $0 | $0 | $0 | $0 | $0 | $0 | $0 | $0 | $0 | $0 | $0 | |
| Purchase Long-term Assets | $0 | $0 | $0 | $0 | $0 | $0 | $0 | $0 | $0 | $0 | $0 | $0 | |
| Dividends | $0 | $0 | $0 | $0 | $0 | $0 | $0 | $0 | $0 | $0 | $0 | $0 | |
| Subtotal Cash Spent | $784 | $1,573 | $1,604 | $1,845 | $1,965 | $2,086 | $2,206 | $2,327 | $2,447 | $2,568 | $2,688 | $7,570 | |
| Net Cash Flow | ($784) | ($1,073) | ($104) | $155 | $535 | $914 | $1,294 | $1,673 | $2,053 | $2,432 | $2,812 | ($1,570) | |
| Cash Balance | $4,716 | $3,643 | $3,540 | $3,695 | $4,229 | $5,144 | $6,437 | $8,110 | $10,163 | $12,595 | $15,407 | $13,836 | |
| Pro Forma Balance Sheet | |||||||||||||
| Month 1 | Month 2 | Month 3 | Month 4 | Month 5 | Month 6 | Month 7 | Month 8 | Month 9 | Month 10 | Month 11 | Month 12 | ||
| Assets | Starting Balances | ||||||||||||
| Current Assets | |||||||||||||
| Cash | $5,500 | $4,716 | $3,643 | $3,540 | $3,695 | $4,229 | $5,144 | $6,437 | $8,110 | $10,163 | $12,595 | $15,407 | $13,836 |
| Accounts Receivable | $0 | $0 | $0 | $0 | $0 | $0 | $0 | $0 | $0 | $0 | $0 | $0 | $0 |
| Other Current Assets | $5,885 | $5,885 | $5,885 | $5,885 | $5,885 | $5,885 | $5,885 | $5,885 | $5,885 | $5,885 | $5,885 | $5,885 | $5,885 |
| Total Current Assets | $11,385 | $10,601 | $9,528 | $9,425 | $9,580 | $10,114 | $11,029 | $12,322 | $13,995 | $16,048 | $18,480 | $21,292 | $19,721 |
| Long-term Assets | |||||||||||||
| Long-term Assets | $0 | $0 | $0 | $0 | $0 | $0 | $0 | $0 | $0 | $0 | $0 | $0 | $0 |
| Accumulated Depreciation | $0 | $0 | $0 | $0 | $0 | $0 | $0 | $0 | $0 | $0 | $0 | $0 | $0 |
| Total Long-term Assets | $0 | $0 | $0 | $0 | $0 | $0 | $0 | $0 | $0 | $0 | $0 | $0 | $0 |
| Total Assets | $11,385 | $10,601 | $9,528 | $9,425 | $9,580 | $10,114 | $11,029 | $12,322 | $13,995 | $16,048 | $18,480 | $21,292 | $19,721 |
| Liabilities and Capital | Month 1 | Month 2 | Month 3 | Month 4 | Month 5 | Month 6 | Month 7 | Month 8 | Month 9 | Month 10 | Month 11 | Month 12 | |
| Current Liabilities | |||||||||||||
| Accounts Payable | $0 | $788 | $810 | $1,048 | $1,164 | $1,281 | $1,397 | $1,514 | $1,630 | $1,747 | $1,863 | $1,980 | $980 |
| Current Borrowing | $23,634 | $22,877 | $22,120 | $21,363 | $20,606 | $19,849 | $19,092 | $18,335 | $17,578 | $16,821 | $16,064 | $15,307 | $14,550 |
| Other Current Liabilities | $0 | $0 | $0 | $0 | $0 | $0 | $0 | $0 | $0 | $0 | $0 | $0 | $0 |
| Subtotal Current Liabilities | $23,634 | $23,665 | $22,930 | $22,411 | $21,770 | $21,130 | $20,489 | $19,849 | $19,208 | $18,568 | $17,927 | $17,287 | $15,530 |
| Long-term Liabilities | $0 | $0 | $0 | $0 | $0 | $0 | $0 | $0 | $0 | $0 | $0 | $0 | $0 |
| Total Liabilities | $23,634 | $23,665 | $22,930 | $22,411 | $21,770 | $21,130 | $20,489 | $19,849 | $19,208 | $18,568 | $17,927 | $17,287 | $15,530 |
| Paid-in Capital | $10,000 | $10,000 | $10,000 | $10,000 | $10,000 | $10,000 | $10,000 | $10,000 | $10,000 | $10,000 | $10,000 | $10,000 | $10,000 |
| Retained Earnings | ($22,249) | ($22,249) | ($22,249) | ($22,249) | ($22,249) | ($22,249) | ($22,249) | ($22,249) | ($22,249) | ($22,249) | ($22,249) | ($22,249) | ($22,249) |
| Earnings | $0 | ($815) | ($1,153) | ($737) | $59 | $1,234 | $2,788 | $4,723 | $7,036 | $9,729 | $12,802 | $16,254 | $16,441 |
| Total Capital | ($12,249) | ($13,064) | ($13,402) | ($12,986) | ($12,190) | ($11,015) | ($9,461) | ($7,526) | ($5,213) | ($2,520) | $553 | $4,005 | $4,192 |
| Total Liabilities and Capital | $11,385 | $10,601 | $9,528 | $9,425 | $9,580 | $10,114 | $11,029 | $12,322 | $13,995 | $16,048 | $18,480 | $21,292 | $19,721 |
| Net Worth | ($12,249) | ($13,064) | ($13,402) | ($12,986) | ($12,190) | ($11,015) | ($9,461) | ($7,526) | ($5,213) | ($2,520) | $553 | $4,005 | $4,192 |
| Personnel Plan | |||||||||||||
| Month 1 | Month 2 | Month 3 | Month 4 | Month 5 | Month 6 | Month 7 | Month 8 | Month 9 | Month 10 | Month 11 | Month 12 | ||
| XYXY | 0% | $0 | $0 | $0 | $0 | $0 | $0 | $0 | $0 | $0 | $0 | $0 | $2,400 |
| XXXX | 0% | $0 | $0 | $0 | $0 | $0 | $0 | $0 | $0 | $0 | $0 | $0 | $2,400 |
| Other | 0% | $0 | $0 | $0 | $0 | $0 | $0 | $0 | $0 | $0 | $0 | $0 | $0 |
| Total People | 0 | 0 | 0 | 0 | 0 | 0 | 0 | 0 | 0 | 0 | 0 | 0 | |
| Total Payroll | $0 | $0 | $0 | $0 | $0 | $0 | $0 | $0 | $0 | $0 | $0 | $4,800 | |


