
F and R Auto Repair
Executive Summary
F & R Auto (F & R) is the desire of John Ford and Michael Ronald who together have 30 years experience as auto mechanics. Both have a dream of starting up their own company and offering better service to their clients than competitors.
1.1 Objectives
The objectives over the next three years for F & R Auto Repair are the following:
- Sales revenues increase steadily through year three.
- Institute a program of superior customer service through rigorous evaluation of service experience.
- Hire three more mechanics.

1.2 Keys to Success
In the auto repair industry a company builds its client base one customer at a time and mostly through word of mouth marketing. With this in mind, the keys to success for F & R Auto Repair are:
- High-quality work.
- Constant contact with clients so as to keep them informed about the state of their automobile and the repair job progress.
- Knowledgeable mechanics that are friendly, customer oriented, and will take the time to explain to customer the intricate nature of our business and our work.
1.3 Mission
The mission of F & R Auto Repair is to provide high quality, convenient and comprehensive auto repair at low cost. The most important aspect of our business is trust. It is the goal of our firm to have 100% customer satisfaction in regards to quality, friendliness, time to completion and to discover new ways to exceed the expectations of our clients.
Company Summary
The company will be a partnership with John Ford and Michael Ronald each owning 50% of the company. The company will be a limited liability company registered in the state of Washington. The firm will have facilities on 1312 1st Ave NW in Ballard, a neighborhood of Seattle. The facilities will contain a two-bay garage, office space and storage space for tools, parts, etc.
The company is seeking a loan in order to finance the start of operations for the company. Each of the owners will be putting up some of their own capital as equity.
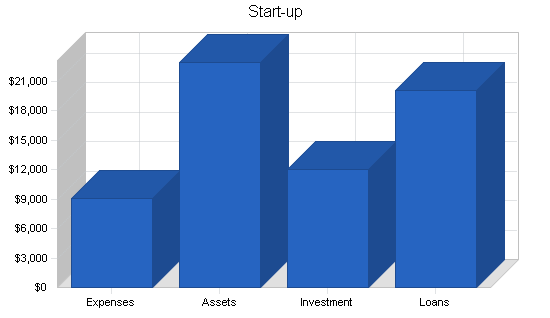
2.1 Start-up Summary
The data obtained for the start-up comes from research done in the Seattle area with other small mechanic shops who have started their own business. Inflation has been taken into account between the estimates of these fellow business owners (and when they started) and the current prices for expensed items.
Much of the equipment to go into the facilities such as tools, air compressors, etc., are currently owned by the two partners.
| Start-up | |
| Requirements | |
| Start-up Expenses | |
| Legal | $500 |
| Stationery etc. | $200 |
| Advertising | $600 |
| Phone | $200 |
| Insurance | $800 |
| Rent | $4,000 |
| Utilities | $200 |
| Computer | $2,000 |
| Other | $600 |
| Total Start-up Expenses | $9,100 |
| Start-up Assets | |
| Cash Required | $2,900 |
| Start-up Inventory | $0 |
| Other Current Assets | $0 |
| Long-term Assets | $20,000 |
| Total Assets | $22,900 |
| Total Requirements | $32,000 |
| Start-up Funding | |
| Start-up Expenses to Fund | $9,100 |
| Start-up Assets to Fund | $22,900 |
| Total Funding Required | $32,000 |
| Assets | |
| Non-cash Assets from Start-up | $20,000 |
| Cash Requirements from Start-up | $2,900 |
| Additional Cash Raised | $0 |
| Cash Balance on Starting Date | $2,900 |
| Total Assets | $22,900 |
| Liabilities and Capital | |
| Liabilities | |
| Current Borrowing | $0 |
| Long-term Liabilities | $20,000 |
| Accounts Payable (Outstanding Bills) | $0 |
| Other Current Liabilities (interest-free) | $0 |
| Total Liabilities | $20,000 |
| Capital | |
| Planned Investment | |
| John Ford | $6,000 |
| Michael Ronald | $6,000 |
| Other | $0 |
| Additional Investment Requirement | $0 |
| Total Planned Investment | $12,000 |
| Loss at Start-up (Start-up Expenses) | ($9,100) |
| Total Capital | $2,900 |
| Total Capital and Liabilities | $22,900 |
| Total Funding | $32,000 |
Services
F & R Auto offers a wide range of services as outlined in the detailed sections below. It is ultimately the goal of the company to offer a one-stop facility for all auto servicing needs, including brakes, transmission, wheel alignment, etc. In this way the company can offer greater perceived value for the customer than many other shops which specialize in certain areas.
The industry is highly competitive with suppliers having a great deal of power in setting and negotiating the prices of their products and services to repair shops. In addition, because the customers see the service as undifferentiated and a “commodity” with little value separation between competitors, buyer power is also very high. Finally, the barriers to entry are moderately low, and the large number of competitors in this field, including substitutes (such as do-it-yourself work) mean that the pricing for such services are very competitive. The only way to have an advantage in this industry is a low cost leadership principal applied aggressively or to create higher switching costs through the building of strong business to customer ties.
F & R Auto will hire trained and certified mechanics who are able to prove they have superior customer awareness and interaction. It is the company’s professional people who will fulfill the firm’s contracts and goals. The largest part of the company’s expenses will be in labor costs.
3.1 Service Description
F & R Auto provides a wide range of auto repair services. These include:
- Scheduled maintenance.
- Wheel alignments, tires and rims.
- Brake repair.
- Comprehensive engine repair.
- Transmission.
Each job or project will be on a reservation basis, although we will accept a small percentage of drive in repair work.
3.2 Competitive Comparison
The auto repair industry is highly competitive. Each company within this field has high capital costs, low margins, and a high intensity of competition.
Suppliers have a great deal of power in setting and negotiating the prices of their products and services to repair shops. This is due to the fact that the suppliers who absorb the greatest amounts of cash from repair shops are large auto part companies. These companies are more consolidated that the repair industry, have deeper pockets, an almost limitless number of substitute customers, and finally they are the single most important supplier to F & R’s industry. Therefore, these companies can set whatever price they wish to. Furthermore, labor is a supplier in this industry as well, and salaries for such individuals are well known and not very flexible.
In addition, because the customers see the service as undifferentiated and a “commodity” with little value separation between competitors (if they offer a suitable level of quality) buyer power is also very high. Additionally, the costs of our services are not cheap, and buyers are willing to search for the most favorable combination of price and acceptable service.
The barriers to entry and exit are moderately low in this industry. Switching costs are virtually non-existent and the costs to entry and exist the market are low. The large number of competitors in this field including substitutes mean that the pricing for such services are very competitive. The only way to have an advantage in this industry is a low cost leadership principal applied aggressively to all aspects of the business or to build up customer relations to a point where the switching costs are raised.
3.3 Technology
The technological revolution in computers has enhanced our abilities to diagnose and repair our clients vehicles. F &R will remain on the cutting edge by instituting the use of computer diagnostic equipment in its shop. The company will continue to seek new ways to provide a better service through technology.
3.4 Future Services
The company does not have any plans to create further services at this time.
Market Analysis Summary
Since F & R will be able to service any vehicle on the road, including motorcycles and campers, it does not make any sense to segment our market. Our potential customer includes every household in Seattle that owns one or more vehicles. The industry does not have any seasonality that affects it.

4.1 Market Segmentation
The following table and chart show the market analysis for F & R Auto Repair.
| Market Analysis | |||||||
| Year 1 | Year 2 | Year 3 | Year 4 | Year 5 | |||
| Potential Customers | Growth | CAGR | |||||
| Number of cars in Seattle | 3% | 145,833 | 150,208 | 154,714 | 159,355 | 164,136 | 3.00% |
| Other | 0% | 0 | 0 | 0 | 0 | 0 | 0.00% |
| Total | 3.00% | 145,833 | 150,208 | 154,714 | 159,355 | 164,136 | 3.00% |
4.2 Service Business Analysis
This section is covered in the Competitive Comparison section of the Plan.
4.2.1 Competition and Buying Patterns
While many customers looking to purchase automotive repair services are concerned with price, the primary concern is with building a relationship of trust between themselves and their service provider. A large number of people within the country have experienced or heard of bad service encounters within this market. As a person’s car is usually connected in one way or another with that individual’s livelihood, a dependable automobile is crucial. Therefore, many clients are willing to pay a little more for a mechanic they feel does a quality job and understands their needs.
An automotive repair company that can anticipate, meet, and even exceed customer’s needs can build a defensible position within the market place and acquire market share at the expense of other rivals.
4.2.2 Main Competitors
As stated before, the automotive repair market is very fragmented. The chief competitors in this industry for F & R are the high quality automobile dealerships and licensed service reps. This includes Toyota, Ford, Chrysler, and other major brand names. Within F & R’s immediate service vicinity, There is Rodham’s Toyota, Lester Ford and Woodmark’s Chrysler dealerships. Each of these direct competitors have a service facility. These competitors dominate the market place, have the largest market share, and have advantages such as specially trained personnel, access to lower priced parts and tools, and deep pockets. The other competitors are mostly “mom & pop” style outfits that make up the majority of the competition. For F & R this includes Dave’s Auto Repair, The Taller Mechanico, Kirkland Auto and Body, and Vancouver Auto. The advantages of these firms is that they can seek a low cost leadership strategy due to lower personnel costs. However, they have a much more fluid customer base and higher customer turnover.
F & R will seek to compete initially in the low cost strategy. At the same time, it will seek to provide a higher level of customer satisfaction by having more rigorous quality control and seeking ways to enhance the entire service experience (not just repairing a person’s car). In this way it will lock in a loyal customer base who value the client-service provider relationship.
4.2.3 Business Participants
The auto repair industry is highly fragmented. In fact, there are so many small providers that any company in this industry is facing a purely competitive environment. It is very difficult to create a differentiation, or niche, strategy in this environment and until F & R is able to establish a reputation for quality, on time, superior customer service, the company will seek a low cost role. Once it has achieved what management believes to be a sufficient reputation for its services along with a profitable customer base, the company plans to leverage this advantage into a differentiation strategy that will be able to charge more for its services.
Strategy and Implementation Summary
The following section outlines the company’s strategic focus in growing the business.
5.1 Competitive Edge
F & R Auto’s competitive edge lies in the vision of its partners, who understand better than many of their rivals that a service visit does not just include repairing a client’s car, it includes the entire service experience from the first time a client talks to their mechanic until they decide to stop driving. The long-term profitability of a service firm of this type lies in the repeat customer that finds F & R’s services an excellent experience, DESPITE the fact that they usually have suffered a inconvenient breakdown. The company will seek to examine ALL aspects of the service experience to seek ways to improve its customer satisfaction. In addition, all employees will be rigorously trained and retrained to think about customer satisfaction in order to create a self-sustaining company culture that revolves around this issue.
5.1.1 Positioning Statement
It is the express purpose of F & R to become the local leader in quality and service experience of all the small (non-dealerships) automotive repair firms within the Seattle area while maintaining a low cost plan. Once a reputation for quality and service experience is created, and an ongoing network of referrals is bringing in new business, the company plans to re-evaluate its strategy and positioning within the market to see if a differentiation strategy is viable. If so, this will allow the company to raise prices and increase profit margins in relation to its rivals. This in turn is expected to leverage long-term growth until F & R can reach a regional scope of operations.
5.2 Marketing Strategy
The company has a modest program of marketing its services that include the following:
- Flyers.
- Direct mailers.
- Discounts.
- Newspaper ads.
- Yellow pages.
- Referrals through other local businesses.
Each of these marketing approaches has the advantage of being low cost and creating service awareness. The company’s long-term marketing goals are to use local radio and TV ads similar to the Les Schwab Tire Center ads.
The company is also investigating the possibility of having a grand opening program that would feature discounts, food, a local radio disc jockey, and other promotional ideas.
5.2.1 Promotion Strategy
The principal owners of F & R Auto expect that a significant number of their pre-existing clients (where Ford and Ronald currently work) will desire to switch to F & R Auto to retain the services of their personal mechanics. This will provide a sufficient income until F & R can build up a reputation and see its marketing program take effect.
This promotion strategy will take the form of flyers, direct mailers, price discounts, and advertisements in newspapers and yellow pages. F & R does not desire to spend a large amount on marketing until the firm is ready to expand either into new facilities or open up new ones. It is estimated this will occur sometime after year five.
5.2.2 Pricing Strategy
F & R Auto exists in a purely competitive environment where each firm must be a price taker. In other words, the firm has no ability to affect the market price of its services, regardless of how many automobiles it repairs. In this case, therefore, marginal revenue (the revenue incurred by producing or servicing one more unit) is equal to the price charged. Furthermore, because the demand curve is essentially horizontal, F & R can service automobiles at total capacity without effecting the price.
What all of this means for F & R Auto is that the company must seek to charge its clients at the market price (or lower). Research has shown that the average price is approximately $400 per vehicle. As long as marginal costs do not exceed revenues, the method to maximize short-run profits is to service automobiles at maximum capacity. This means that F & R Auto can expect an ROA of approximately 4.5%
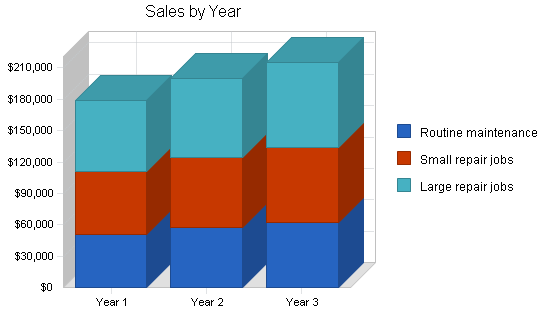
5.3 Sales Forecast
Since the automotive repair industry is, operationally, a job-shop environment, it is somewhat difficult to estimate sales. For job-shops, each individual product or service is tailored or unique to that job, and is only initiated once an order is made. However, the sales forecast reflect the professional opinion of Mr. Ford in how much sales he will make based on the following assumptions:
- The number of clients Ford and Ronald can attract from their previous companies.
- The effect of planned promotions and word-of-mouth marketing.
- Current prices and costs of doing business.
- The types of automobiles and jobs that will occur in every month.
For the most part, sales for an automobile repair firm are steady year round and reflect little seasonality.
The table and charts below outline the sales forecast. Three years of annual sales and costs of sales are shown. Twelve monthly tallies are included in the appendices.

| Sales Forecast | |||
| Year 1 | Year 2 | Year 3 | |
| Sales | |||
| Routine maintenance | $51,000 | $57,120 | $62,261 |
| Small repair jobs | $60,000 | $67,200 | $71,904 |
| Large repair jobs | $67,800 | $75,936 | $81,252 |
| Total Sales | $178,800 | $200,256 | $215,417 |
| Direct Cost of Sales | Year 1 | Year 2 | Year 3 |
| Routine maintenance | $5,100 | $5,712 | $6,226 |
| Small repair jobs | $6,000 | $6,720 | $7,190 |
| Large repair jobs | $6,780 | $7,594 | $8,125 |
| Subtotal Direct Cost of Sales | $17,880 | $20,026 | $21,542 |
Management Summary
John Ford began working as an apprentice mechanic in his father’s shop in 1984. Since that time, he has worked for a variety of automotive shops and dealerships and has numerous certificates in automobile repair. During the past two years Mr. Ford has attended Bellevue Community College where he received an Associates degree in business administration in June of 2000.
Michael Ronald attended ITT Technical Institute where he received a certificate in electronics repair in 1980. In 1983 Mr. Ronald went to work for Jim Click Ford Dealership in Tucson AZ, where he worked on automotive electrical and electronic systems. Desiring to expand his skills, Mr. Ronald received a mechanic’s certificate in 1988 and since then has become certified in various automotive fields. In anticipation of F & R’s business needs, Mr. Ronald is taking night classes at Seattle University in marketing.
6.1 Personnel Plan
F & R’s initial staffing will consist of Ford and Ronald, plus Ronald’s wife who will act as a part-time office manager. The company will seek two entry level mechanics to be hired within a few months after the company is operating. Accounting, bookkeeping, and marketing services will be outsourced. The company’s intermediate goal is to have four full time, fully trained mechanics at the original facility, plus a full-time office manager. However, management has decided to await future developments before determining the best time to bring on such personnel.
| Personnel Plan | |||
| Year 1 | Year 2 | Year 3 | |
| Mr. Ford | $36,000 | $36,000 | $36,000 |
| Mr. Ronald | $36,000 | $36,000 | $36,000 |
| Office manager (part time) | $14,400 | $15,000 | $15,000 |
| Apprentice mechanic (part time) | $6,900 | $15,000 | $15,000 |
| Apprentice mechanic (part time) | $0 | $0 | $15,000 |
| Apprentice mechanic (part time) | $0 | $0 | $0 |
| Total People | 4 | 4 | 5 |
| Total Payroll | $93,300 | $102,000 | $117,000 |
Financial Plan
The following sections outline the financial plan for F & R Auto Repair.
7.1 Break-even Analysis
The company’s Break-even Analysis is based on an average company’s running costs within this industry, including payroll, and its fixed costs for such things as rent, utilities, etc.

| Break-even Analysis | |
| Monthly Revenue Break-even | $14,564 |
| Assumptions: | |
| Average Percent Variable Cost | 10% |
| Estimated Monthly Fixed Cost | $13,107 |
7.2 Projected Profit and Loss
The following table and chart show the projected profit and loss for F & R Auto Repair.


| Pro Forma Profit and Loss | |||
| Year 1 | Year 2 | Year 3 | |
| Sales | $178,800 | $200,256 | $215,417 |
| Direct Cost of Sales | $17,880 | $20,026 | $21,542 |
| Other Production Expenses | $0 | $0 | $0 |
| Total Cost of Sales | $17,880 | $20,026 | $21,542 |
| Gross Margin | $160,920 | $180,230 | $193,875 |
| Gross Margin % | 90.00% | 90.00% | 90.00% |
| Expenses | |||
| Payroll | $93,300 | $102,000 | $117,000 |
| Sales and Marketing and Other Expenses | $6,000 | $7,200 | $7,400 |
| Depreciation | $1,992 | $2,000 | $2,000 |
| Leased Equipment | $6,000 | $1,000 | $1,000 |
| Utilities | $4,800 | $5,000 | $5,000 |
| Insurance | $7,200 | $7,400 | $7,400 |
| Rent | $24,000 | $24,000 | $24,000 |
| Payroll Taxes | $13,995 | $15,300 | $17,550 |
| Other | $0 | $0 | $0 |
| Total Operating Expenses | $157,287 | $163,900 | $181,350 |
| Profit Before Interest and Taxes | $3,633 | $16,330 | $12,525 |
| EBITDA | $5,625 | $18,330 | $14,525 |
| Interest Expense | $1,892 | $1,700 | $1,500 |
| Taxes Incurred | $522 | $4,389 | $3,308 |
| Net Profit | $1,219 | $10,241 | $7,718 |
| Net Profit/Sales | 0.68% | 5.11% | 3.58% |
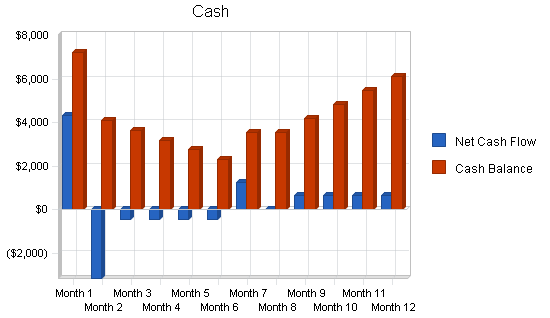
7.3 Projected Cash Flow
The following table and chart are the projected cash flow figures for F & R.
| Pro Forma Cash Flow | |||
| Year 1 | Year 2 | Year 3 | |
| Cash Received | |||
| Cash from Operations | |||
| Cash Sales | $160,920 | $180,230 | $193,875 |
| Cash from Receivables | $14,635 | $19,636 | $21,267 |
| Subtotal Cash from Operations | $175,555 | $199,867 | $215,142 |
| Additional Cash Received | |||
| Sales Tax, VAT, HST/GST Received | $0 | $0 | $0 |
| New Current Borrowing | $0 | $0 | $0 |
| New Other Liabilities (interest-free) | $0 | $0 | $0 |
| New Long-term Liabilities | $0 | $0 | $0 |
| Sales of Other Current Assets | $0 | $0 | $0 |
| Sales of Long-term Assets | $0 | $0 | $0 |
| New Investment Received | $0 | $0 | $0 |
| Subtotal Cash Received | $175,555 | $199,867 | $215,142 |
| Expenditures | Year 1 | Year 2 | Year 3 |
| Expenditures from Operations | |||
| Cash Spending | $93,300 | $102,000 | $117,000 |
| Bill Payments | $77,017 | $86,232 | $88,638 |
| Subtotal Spent on Operations | $170,317 | $188,232 | $205,638 |
| Additional Cash Spent | |||
| Sales Tax, VAT, HST/GST Paid Out | $0 | $0 | $0 |
| Principal Repayment of Current Borrowing | $0 | $0 | $0 |
| Other Liabilities Principal Repayment | $0 | $0 | $0 |
| Long-term Liabilities Principal Repayment | $2,000 | $2,000 | $2,000 |
| Purchase Other Current Assets | $0 | $0 | $0 |
| Purchase Long-term Assets | $0 | $0 | $0 |
| Dividends | $0 | $0 | $0 |
| Subtotal Cash Spent | $172,317 | $190,232 | $207,638 |
| Net Cash Flow | $3,238 | $9,634 | $7,504 |
| Cash Balance | $6,138 | $15,773 | $23,277 |
7.4 Projected Balance Sheet
The following table shows the projected balance sheet.
| Pro Forma Balance Sheet | |||
| Year 1 | Year 2 | Year 3 | |
| Assets | |||
| Current Assets | |||
| Cash | $6,138 | $15,773 | $23,277 |
| Accounts Receivable | $3,245 | $3,634 | $3,910 |
| Inventory | $1,815 | $2,033 | $2,187 |
| Other Current Assets | $0 | $0 | $0 |
| Total Current Assets | $11,198 | $21,440 | $29,373 |
| Long-term Assets | |||
| Long-term Assets | $20,000 | $20,000 | $20,000 |
| Accumulated Depreciation | $1,992 | $3,992 | $5,992 |
| Total Long-term Assets | $18,008 | $16,008 | $14,008 |
| Total Assets | $29,206 | $37,448 | $43,381 |
| Liabilities and Capital | Year 1 | Year 2 | Year 3 |
| Current Liabilities | |||
| Accounts Payable | $7,088 | $7,088 | $7,303 |
| Current Borrowing | $0 | $0 | $0 |
| Other Current Liabilities | $0 | $0 | $0 |
| Subtotal Current Liabilities | $7,088 | $7,088 | $7,303 |
| Long-term Liabilities | $18,000 | $16,000 | $14,000 |
| Total Liabilities | $25,088 | $23,088 | $21,303 |
| Paid-in Capital | $12,000 | $12,000 | $12,000 |
| Retained Earnings | ($9,100) | ($7,881) | $2,360 |
| Earnings | $1,219 | $10,241 | $7,718 |
| Total Capital | $4,119 | $14,360 | $22,078 |
| Total Liabilities and Capital | $29,206 | $37,448 | $43,381 |
| Net Worth | $4,119 | $14,360 | $22,078 |
7.5 Business Ratios
The Business ratios give an overall idea of how profitable and at what risk level F & R Auto will operate at. The ratio table gives both time series analysis and cross-sectional analysis by including industry average ratios. As can be seen from the comparison between industry standards and F&R’s own ratios, there is some differences. Most of these are due to the fact that there is a very large variance in assets, liabilities, financing, and net income between companies in this industry due to the vast differences in company size.
Overall the company’s projections show a company that faces the usual risks of companies in this industry and one that will be profitable in the long-run. The company shows that it has higher SG&A costs than other competitors, however management has deliberately overstated costs and minimized profits in order to create a “safe” or “buffer” zone in case of hard times or other unforeseeable problems. Pre-tax return on net worth and pre-tax return on assets appears to be very high, especially within the first two years, however this is due to the fact that the company will be operating with fewer assets than most companies in the first few years until it can build up enough cash to acquire the tools and facilities that are desired and go beyond the “adequate” level.
| Ratio Analysis | ||||
| Year 1 | Year 2 | Year 3 | Industry Profile | |
| Sales Growth | 0.00% | 12.00% | 7.57% | 7.00% |
| Percent of Total Assets | ||||
| Accounts Receivable | 11.11% | 9.71% | 9.01% | 8.80% |
| Inventory | 6.21% | 5.43% | 5.04% | 9.60% |
| Other Current Assets | 0.00% | 0.00% | 0.00% | 23.80% |
| Total Current Assets | 38.34% | 57.25% | 67.71% | 42.20% |
| Long-term Assets | 61.66% | 42.75% | 32.29% | 57.80% |
| Total Assets | 100.00% | 100.00% | 100.00% | 100.00% |
| Current Liabilities | 24.27% | 18.93% | 16.83% | 34.80% |
| Long-term Liabilities | 61.63% | 42.73% | 32.27% | 24.70% |
| Total Liabilities | 85.90% | 61.65% | 49.11% | 59.50% |
| Net Worth | 14.10% | 38.35% | 50.89% | 40.50% |
| Percent of Sales | ||||
| Sales | 100.00% | 100.00% | 100.00% | 100.00% |
| Gross Margin | 90.00% | 90.00% | 90.00% | n.a. |
| Selling, General & Administrative Expenses | 89.32% | 84.89% | 86.42% | 75.20% |
| Advertising Expenses | 1.34% | 1.50% | 1.39% | 1.30% |
| Profit Before Interest and Taxes | 2.03% | 8.15% | 5.81% | 1.70% |
| Main Ratios | ||||
| Current | 1.58 | 3.02 | 4.02 | 1.17 |
| Quick | 1.32 | 2.74 | 3.72 | 0.65 |
| Total Debt to Total Assets | 85.90% | 61.65% | 49.11% | 59.50% |
| Pre-tax Return on Net Worth | 42.28% | 101.88% | 49.94% | 1.80% |
| Pre-tax Return on Assets | 5.96% | 39.07% | 25.41% | 4.60% |
| Additional Ratios | Year 1 | Year 2 | Year 3 | |
| Net Profit Margin | 0.68% | 5.11% | 3.58% | n.a |
| Return on Equity | 29.59% | 71.32% | 34.96% | n.a |
| Activity Ratios | ||||
| Accounts Receivable Turnover | 5.51 | 5.51 | 5.51 | n.a |
| Collection Days | 57 | 63 | 64 | n.a |
| Inventory Turnover | 10.91 | 10.41 | 10.21 | n.a |
| Accounts Payable Turnover | 11.87 | 12.17 | 12.17 | n.a |
| Payment Days | 27 | 30 | 30 | n.a |
| Total Asset Turnover | 6.12 | 5.35 | 4.97 | n.a |
| Debt Ratios | ||||
| Debt to Net Worth | 6.09 | 1.61 | 0.96 | n.a |
| Current Liab. to Liab. | 0.28 | 0.31 | 0.34 | n.a |
| Liquidity Ratios | ||||
| Net Working Capital | $4,111 | $14,352 | $22,070 | n.a |
| Interest Coverage | 1.92 | 9.61 | 8.35 | n.a |
| Additional Ratios | ||||
| Assets to Sales | 0.16 | 0.19 | 0.20 | n.a |
| Current Debt/Total Assets | 24% | 19% | 17% | n.a |
| Acid Test | 0.87 | 2.23 | 3.19 | n.a |
| Sales/Net Worth | 43.41 | 13.95 | 9.76 | n.a |
| Dividend Payout | 0.00 | 0.00 | 0.00 | n.a |
Appendix
| Sales Forecast | |||||||||||||
| Month 1 | Month 2 | Month 3 | Month 4 | Month 5 | Month 6 | Month 7 | Month 8 | Month 9 | Month 10 | Month 11 | Month 12 | ||
| Sales | |||||||||||||
| Routine maintenance | 0% | $4,000 | $4,000 | $4,000 | $4,000 | $4,000 | $4,000 | $4,500 | $4,500 | $4,500 | $4,500 | $4,500 | $4,500 |
| Small repair jobs | 0% | $4,500 | $4,500 | $4,500 | $4,500 | $4,500 | $4,500 | $5,500 | $5,500 | $5,500 | $5,500 | $5,500 | $5,500 |
| Large repair jobs | 0% | $4,800 | $4,800 | $4,800 | $4,800 | $4,800 | $4,800 | $6,500 | $6,500 | $6,500 | $6,500 | $6,500 | $6,500 |
| Total Sales | $13,300 | $13,300 | $13,300 | $13,300 | $13,300 | $13,300 | $16,500 | $16,500 | $16,500 | $16,500 | $16,500 | $16,500 | |
| Direct Cost of Sales | Month 1 | Month 2 | Month 3 | Month 4 | Month 5 | Month 6 | Month 7 | Month 8 | Month 9 | Month 10 | Month 11 | Month 12 | |
| Routine maintenance | $400 | $400 | $400 | $400 | $400 | $400 | $450 | $450 | $450 | $450 | $450 | $450 | |
| Small repair jobs | $450 | $450 | $450 | $450 | $450 | $450 | $550 | $550 | $550 | $550 | $550 | $550 | |
| Large repair jobs | $480 | $480 | $480 | $480 | $480 | $480 | $650 | $650 | $650 | $650 | $650 | $650 | |
| Subtotal Direct Cost of Sales | $1,330 | $1,330 | $1,330 | $1,330 | $1,330 | $1,330 | $1,650 | $1,650 | $1,650 | $1,650 | $1,650 | $1,650 | |
| Personnel Plan | |||||||||||||
| Month 1 | Month 2 | Month 3 | Month 4 | Month 5 | Month 6 | Month 7 | Month 8 | Month 9 | Month 10 | Month 11 | Month 12 | ||
| Mr. Ford | 0% | $3,000 | $3,000 | $3,000 | $3,000 | $3,000 | $3,000 | $3,000 | $3,000 | $3,000 | $3,000 | $3,000 | $3,000 |
| Mr. Ronald | 0% | $3,000 | $3,000 | $3,000 | $3,000 | $3,000 | $3,000 | $3,000 | $3,000 | $3,000 | $3,000 | $3,000 | $3,000 |
| Office manager (part time) | 0% | $1,200 | $1,200 | $1,200 | $1,200 | $1,200 | $1,200 | $1,200 | $1,200 | $1,200 | $1,200 | $1,200 | $1,200 |
| Apprentice mechanic (part time) | 0% | $0 | $0 | $0 | $0 | $0 | $0 | $1,150 | $1,150 | $1,150 | $1,150 | $1,150 | $1,150 |
| Apprentice mechanic (part time) | 0% | $0 | $0 | $0 | $0 | $0 | $0 | $0 | $0 | $0 | $0 | $0 | $0 |
| Apprentice mechanic (part time) | 0% | $0 | $0 | $0 | $0 | $0 | $0 | $0 | $0 | $0 | $0 | $0 | $0 |
| Total People | 3 | 3 | 3 | 3 | 3 | 3 | 4 | 4 | 4 | 4 | 4 | 4 | |
| Total Payroll | $7,200 | $7,200 | $7,200 | $7,200 | $7,200 | $7,200 | $8,350 | $8,350 | $8,350 | $8,350 | $8,350 | $8,350 | |
| General Assumptions | |||||||||||||
| Month 1 | Month 2 | Month 3 | Month 4 | Month 5 | Month 6 | Month 7 | Month 8 | Month 9 | Month 10 | Month 11 | Month 12 | ||
| Plan Month | 1 | 2 | 3 | 4 | 5 | 6 | 7 | 8 | 9 | 10 | 11 | 12 | |
| Current Interest Rate | 10.00% | 10.00% | 10.00% | 10.00% | 10.00% | 10.00% | 10.00% | 10.00% | 10.00% | 10.00% | 10.00% | 10.00% | |
| Long-term Interest Rate | 10.00% | 10.00% | 10.00% | 10.00% | 10.00% | 10.00% | 10.00% | 10.00% | 10.00% | 10.00% | 10.00% | 10.00% | |
| Tax Rate | 30.00% | 30.00% | 30.00% | 30.00% | 30.00% | 30.00% | 30.00% | 30.00% | 30.00% | 30.00% | 30.00% | 30.00% | |
| Other | 0 | 0 | 0 | 0 | 0 | 0 | 0 | 0 | 0 | 0 | 0 | 0 | |
| Pro Forma Profit and Loss | |||||||||||||
| Month 1 | Month 2 | Month 3 | Month 4 | Month 5 | Month 6 | Month 7 | Month 8 | Month 9 | Month 10 | Month 11 | Month 12 | ||
| Sales | $13,300 | $13,300 | $13,300 | $13,300 | $13,300 | $13,300 | $16,500 | $16,500 | $16,500 | $16,500 | $16,500 | $16,500 | |
| Direct Cost of Sales | $1,330 | $1,330 | $1,330 | $1,330 | $1,330 | $1,330 | $1,650 | $1,650 | $1,650 | $1,650 | $1,650 | $1,650 | |
| Other Production Expenses | $0 | $0 | $0 | $0 | $0 | $0 | $0 | $0 | $0 | $0 | $0 | $0 | |
| Total Cost of Sales | $1,330 | $1,330 | $1,330 | $1,330 | $1,330 | $1,330 | $1,650 | $1,650 | $1,650 | $1,650 | $1,650 | $1,650 | |
| Gross Margin | $11,970 | $11,970 | $11,970 | $11,970 | $11,970 | $11,970 | $14,850 | $14,850 | $14,850 | $14,850 | $14,850 | $14,850 | |
| Gross Margin % | 90.00% | 90.00% | 90.00% | 90.00% | 90.00% | 90.00% | 90.00% | 90.00% | 90.00% | 90.00% | 90.00% | 90.00% | |
| Expenses | |||||||||||||
| Payroll | $7,200 | $7,200 | $7,200 | $7,200 | $7,200 | $7,200 | $8,350 | $8,350 | $8,350 | $8,350 | $8,350 | $8,350 | |
| Sales and Marketing and Other Expenses | $500 | $500 | $500 | $500 | $500 | $500 | $500 | $500 | $500 | $500 | $500 | $500 | |
| Depreciation | $166 | $166 | $166 | $166 | $166 | $166 | $166 | $166 | $166 | $166 | $166 | $166 | |
| Leased Equipment | $500 | $500 | $500 | $500 | $500 | $500 | $500 | $500 | $500 | $500 | $500 | $500 | |
| Utilities | $400 | $400 | $400 | $400 | $400 | $400 | $400 | $400 | $400 | $400 | $400 | $400 | |
| Insurance | $600 | $600 | $600 | $600 | $600 | $600 | $600 | $600 | $600 | $600 | $600 | $600 | |
| Rent | $2,000 | $2,000 | $2,000 | $2,000 | $2,000 | $2,000 | $2,000 | $2,000 | $2,000 | $2,000 | $2,000 | $2,000 | |
| Payroll Taxes | 15% | $1,080 | $1,080 | $1,080 | $1,080 | $1,080 | $1,080 | $1,253 | $1,253 | $1,253 | $1,253 | $1,253 | $1,253 |
| Other | $0 | $0 | $0 | $0 | $0 | $0 | $0 | $0 | $0 | $0 | $0 | $0 | |
| Total Operating Expenses | $12,446 | $12,446 | $12,446 | $12,446 | $12,446 | $12,446 | $13,769 | $13,769 | $13,769 | $13,769 | $13,769 | $13,769 | |
| Profit Before Interest and Taxes | ($476) | ($476) | ($476) | ($476) | ($476) | ($476) | $1,082 | $1,082 | $1,082 | $1,082 | $1,082 | $1,082 | |
| EBITDA | ($310) | ($310) | ($310) | ($310) | ($310) | ($310) | $1,248 | $1,248 | $1,248 | $1,248 | $1,248 | $1,248 | |
| Interest Expense | $165 | $164 | $162 | $161 | $160 | $158 | $157 | $156 | $154 | $153 | $151 | $150 | |
| Taxes Incurred | ($192) | ($192) | ($192) | ($191) | ($191) | ($190) | $277 | $278 | $278 | $279 | $279 | $279 | |
| Net Profit | ($449) | ($448) | ($447) | ($446) | ($445) | ($444) | $647 | $648 | $649 | $650 | $651 | $652 | |
| Net Profit/Sales | -3.38% | -3.37% | -3.36% | -3.35% | -3.35% | -3.34% | 3.92% | 3.93% | 3.93% | 3.94% | 3.95% | 3.95% | |
| Pro Forma Cash Flow | |||||||||||||
| Month 1 | Month 2 | Month 3 | Month 4 | Month 5 | Month 6 | Month 7 | Month 8 | Month 9 | Month 10 | Month 11 | Month 12 | ||
| Cash Received | |||||||||||||
| Cash from Operations | |||||||||||||
| Cash Sales | $11,970 | $11,970 | $11,970 | $11,970 | $11,970 | $11,970 | $14,850 | $14,850 | $14,850 | $14,850 | $14,850 | $14,850 | |
| Cash from Receivables | $0 | $44 | $1,330 | $1,330 | $1,330 | $1,330 | $1,330 | $1,341 | $1,650 | $1,650 | $1,650 | $1,650 | |
| Subtotal Cash from Operations | $11,970 | $12,014 | $13,300 | $13,300 | $13,300 | $13,300 | $16,180 | $16,191 | $16,500 | $16,500 | $16,500 | $16,500 | |
| Additional Cash Received | |||||||||||||
| Sales Tax, VAT, HST/GST Received | 0.00% | $0 | $0 | $0 | $0 | $0 | $0 | $0 | $0 | $0 | $0 | $0 | $0 |
| New Current Borrowing | $0 | $0 | $0 | $0 | $0 | $0 | $0 | $0 | $0 | $0 | $0 | $0 | |
| New Other Liabilities (interest-free) | $0 | $0 | $0 | $0 | $0 | $0 | $0 | $0 | $0 | $0 | $0 | $0 | |
| New Long-term Liabilities | $0 | $0 | $0 | $0 | $0 | $0 | $0 | $0 | $0 | $0 | $0 | $0 | |
| Sales of Other Current Assets | $0 | $0 | $0 | $0 | $0 | $0 | $0 | $0 | $0 | $0 | $0 | $0 | |
| Sales of Long-term Assets | $0 | $0 | $0 | $0 | $0 | $0 | $0 | $0 | $0 | $0 | $0 | $0 | |
| New Investment Received | $0 | $0 | $0 | $0 | $0 | $0 | $0 | $0 | $0 | $0 | $0 | $0 | |
| Subtotal Cash Received | $11,970 | $12,014 | $13,300 | $13,300 | $13,300 | $13,300 | $16,180 | $16,191 | $16,500 | $16,500 | $16,500 | $16,500 | |
| Expenditures | Month 1 | Month 2 | Month 3 | Month 4 | Month 5 | Month 6 | Month 7 | Month 8 | Month 9 | Month 10 | Month 11 | Month 12 | |
| Expenditures from Operations | |||||||||||||
| Cash Spending | $7,200 | $7,200 | $7,200 | $7,200 | $7,200 | $7,200 | $8,350 | $8,350 | $8,350 | $8,350 | $8,350 | $8,350 | |
| Bill Payments | $262 | $7,797 | $6,382 | $6,381 | $6,380 | $6,379 | $6,422 | $7,677 | $7,336 | $7,335 | $7,334 | $7,333 | |
| Subtotal Spent on Operations | $7,462 | $14,997 | $13,582 | $13,581 | $13,580 | $13,579 | $14,772 | $16,027 | $15,686 | $15,685 | $15,684 | $15,683 | |
| Additional Cash Spent | |||||||||||||
| Sales Tax, VAT, HST/GST Paid Out | $0 | $0 | $0 | $0 | $0 | $0 | $0 | $0 | $0 | $0 | $0 | $0 | |
| Principal Repayment of Current Borrowing | $0 | $0 | $0 | $0 | $0 | $0 | $0 | $0 | $0 | $0 | $0 | $0 | |
| Other Liabilities Principal Repayment | $0 | $0 | $0 | $0 | $0 | $0 | $0 | $0 | $0 | $0 | $0 | $0 | |
| Long-term Liabilities Principal Repayment | $167 | $167 | $167 | $167 | $167 | $167 | $167 | $167 | $167 | $167 | $167 | $167 | |
| Purchase Other Current Assets | $0 | $0 | $0 | $0 | $0 | $0 | $0 | $0 | $0 | $0 | $0 | $0 | |
| Purchase Long-term Assets | $0 | $0 | $0 | $0 | $0 | $0 | $0 | $0 | $0 | $0 | $0 | $0 | |
| Dividends | $0 | $0 | $0 | $0 | $0 | $0 | $0 | $0 | $0 | $0 | $0 | $0 | |
| Subtotal Cash Spent | $7,628 | $15,164 | $13,749 | $13,748 | $13,747 | $13,746 | $14,938 | $16,194 | $15,852 | $15,852 | $15,851 | $15,850 | |
| Net Cash Flow | $4,342 | ($3,149) | ($449) | ($448) | ($447) | ($446) | $1,242 | ($3) | $648 | $648 | $649 | $650 | |
| Cash Balance | $7,242 | $4,092 | $3,644 | $3,196 | $2,750 | $2,304 | $3,546 | $3,543 | $4,190 | $4,839 | $5,488 | $6,138 | |
| Pro Forma Balance Sheet | |||||||||||||
| Month 1 | Month 2 | Month 3 | Month 4 | Month 5 | Month 6 | Month 7 | Month 8 | Month 9 | Month 10 | Month 11 | Month 12 | ||
| Assets | Starting Balances | ||||||||||||
| Current Assets | |||||||||||||
| Cash | $2,900 | $7,242 | $4,092 | $3,644 | $3,196 | $2,750 | $2,304 | $3,546 | $3,543 | $4,190 | $4,839 | $5,488 | $6,138 |
| Accounts Receivable | $0 | $1,330 | $2,616 | $2,616 | $2,616 | $2,616 | $2,616 | $2,936 | $3,245 | $3,245 | $3,245 | $3,245 | $3,245 |
| Inventory | $0 | $1,463 | $1,463 | $1,463 | $1,463 | $1,463 | $1,463 | $1,815 | $1,815 | $1,815 | $1,815 | $1,815 | $1,815 |
| Other Current Assets | $0 | $0 | $0 | $0 | $0 | $0 | $0 | $0 | $0 | $0 | $0 | $0 | $0 |
| Total Current Assets | $2,900 | $10,035 | $8,171 | $7,722 | $7,275 | $6,828 | $6,383 | $8,296 | $8,603 | $9,250 | $9,899 | $10,548 | $11,198 |
| Long-term Assets | |||||||||||||
| Long-term Assets | $20,000 | $20,000 | $20,000 | $20,000 | $20,000 | $20,000 | $20,000 | $20,000 | $20,000 | $20,000 | $20,000 | $20,000 | $20,000 |
| Accumulated Depreciation | $0 | $166 | $332 | $498 | $664 | $830 | $996 | $1,162 | $1,328 | $1,494 | $1,660 | $1,826 | $1,992 |
| Total Long-term Assets | $20,000 | $19,834 | $19,668 | $19,502 | $19,336 | $19,170 | $19,004 | $18,838 | $18,672 | $18,506 | $18,340 | $18,174 | $18,008 |
| Total Assets | $22,900 | $29,869 | $27,839 | $27,224 | $26,611 | $25,998 | $25,387 | $27,134 | $27,275 | $27,756 | $28,239 | $28,722 | $29,206 |
| Liabilities and Capital | Month 1 | Month 2 | Month 3 | Month 4 | Month 5 | Month 6 | Month 7 | Month 8 | Month 9 | Month 10 | Month 11 | Month 12 | |
| Current Liabilities | |||||||||||||
| Accounts Payable | $0 | $7,584 | $6,169 | $6,168 | $6,167 | $6,166 | $6,165 | $7,433 | $7,091 | $7,090 | $7,089 | $7,088 | $7,088 |
| Current Borrowing | $0 | $0 | $0 | $0 | $0 | $0 | $0 | $0 | $0 | $0 | $0 | $0 | $0 |
| Other Current Liabilities | $0 | $0 | $0 | $0 | $0 | $0 | $0 | $0 | $0 | $0 | $0 | $0 | $0 |
| Subtotal Current Liabilities | $0 | $7,584 | $6,169 | $6,168 | $6,167 | $6,166 | $6,165 | $7,433 | $7,091 | $7,090 | $7,089 | $7,088 | $7,088 |
| Long-term Liabilities | $20,000 | $19,833 | $19,667 | $19,500 | $19,333 | $19,167 | $19,000 | $18,833 | $18,667 | $18,500 | $18,333 | $18,167 | $18,000 |
| Total Liabilities | $20,000 | $27,418 | $25,836 | $25,668 | $25,501 | $25,333 | $25,165 | $26,266 | $25,758 | $25,590 | $25,423 | $25,255 | $25,088 |
| Paid-in Capital | $12,000 | $12,000 | $12,000 | $12,000 | $12,000 | $12,000 | $12,000 | $12,000 | $12,000 | $12,000 | $12,000 | $12,000 | $12,000 |
| Retained Earnings | ($9,100) | ($9,100) | ($9,100) | ($9,100) | ($9,100) | ($9,100) | ($9,100) | ($9,100) | ($9,100) | ($9,100) | ($9,100) | ($9,100) | ($9,100) |
| Earnings | $0 | ($449) | ($897) | ($1,344) | ($1,790) | ($2,235) | ($2,679) | ($2,032) | ($1,383) | ($734) | ($84) | $567 | $1,219 |
| Total Capital | $2,900 | $2,451 | $2,003 | $1,556 | $1,110 | $665 | $221 | $868 | $1,517 | $2,166 | $2,816 | $3,467 | $4,119 |
| Total Liabilities and Capital | $22,900 | $29,869 | $27,839 | $27,224 | $26,611 | $25,998 | $25,387 | $27,134 | $27,275 | $27,756 | $28,239 | $28,722 | $29,206 |
| Net Worth | $2,900 | $2,451 | $2,003 | $1,556 | $1,110 | $665 | $221 | $868 | $1,517 | $2,166 | $2,816 | $3,467 | $4,119 |


