
DIY Wash N' Fix
Executive Summary
DIY Wash N’ Fix is a new concept in auto care. The Do-It-Yourself (DIY) market in America is increasingly popular, as evidenced in the growth of DIY housing suppliers. However, there remains a gap in the market for DIY auto repair, currently firms offer auto parts and tools, but not a place to perform the work. Therefore, our business idea is to provide a professional environment in which to wash, paint or repair your automobile. DIY Wash N’ Fix is a timely idea, because the current economic slowdown in the U.S. may influence consumers to revise their spending habits. Assuming someone has the required skills or the desire to learn auto repair, they will likely be inclined to use our facility to cut costs. Additionally, sales of after-market auto parts have been increasing, which demonstrates Americans’ abilities and willingness to fix their own cars. The car wash industry is attractive, because it generates steady profits on little additional investment. An opportunity for excellent acquisitions currently exists in the car wash and auto repair industries, given that many of these businesses are owned by baby-boomers who are anxious to retire.
DIY Wash N’ Fix has targeted a specific market of individuals who would like to work on their cars, yet they lack the proper space and equipment to do so. This is a growing market in urban areas, because many people live in apartment complexes that restrict on-site auto repair. Our target market is about 90% male in the age range of 18-55 who earn from $20,000 to $40,000 per year. Based on these desired demographics, we have chosen to locate our facility in Texas, Florida or California.
DIY Wash N’ Fix is a new and exciting concept, and we have estimated it will be a profitable endeavor. The fact that we are the first in this business gives us a first-mover advantage over any competitors that may follow.
1.1 Keys to Success
The key success factors in this industry are:
- Quality of service.
- Good business practice.
- Skilled workforce.
- Marketing efforts/information provided to customers.
- Technologically advanced equipment.
- Environmental issues awareness.
The above trends provide some reasons for our business to be successful. Indeed, the current American economic slowdown and the eventuality of rising costs for our competitors (technology, labor, environment, etc.) will facilitate the growth of the DIY business. Moreover, the bad image that certain repair stores have is an advantage for us because people may not trust them anymore. Finally, the repair industry is a good investment in terms of profit projections.
However, we also outlined two major threats. First, the increase in the technologically advanced vehicle electronics may prevent people from repairing their car on their own. Second, many states have laws requiring regular emission and safety inspections, which will require people to go to a traditional garage, even if they are regular customers to our facility.
Car Wash Competitors:
- Single-activity car washes: they are typically private-owned businesses that offer car wash service only.
- Multiple-activity car washes: they are chains that offer many services; for instance, AAA, a California based car-care facility, has recently announced the opening of a full-service car wash, in addition to its repair services, shops, free Internet access and children’s play area.
The multiple-activity car washes are less numerous in terms of total number available. However, they more closely resemble our business process and are therefore considered the primary threat.
1.2 Objectives
It is appropriate to discuss the risks inherent in our business model. The central assumption that we’ve made in this plan is that part of the population exists that are willing and able to do basic repairs and maintenance on their automobiles, but are limited by lack of a proper workspace and appropriate tools. Another key factor to our success is appropriate pricing to attract and retain this customer segment. Finally, a risk inherent in our business is that a large unforeseen expense will arise that we have failed to work into our financials.
Company Summary
This will be a single-location firm providing a service to a local market. It will be a combination of a coin-operated car wash and an attached facility to allow DIY auto mechanics to rent repair bays with similar equipment and working conditions that professional mechanics enjoy. These repair bays would include hydraulic lifts, compressed air tools, individual lighting systems and specialty tools used only for specialized tasks.
The coin-operated car wash service is a long-standing service industry that is growing at 3% a year. The after-market auto parts market is also a long-standing industry, growing at 4% a year. There is overlap in the customer base of these two industries, but until now no one has linked the two and added customer value in the process.
This combination of services will complement each other and allow DIY Wash N’ Fix to enjoy the proven cash flows of a growing industry (coin-operated car wash) and increasing profitability from a new business venture. The business model relies on an appropriate population demographic to draw on, but once a suitable site has been selected then this operation has the potential to provide a steady income to the owners. Growth will most likely be achieved through franchising.
Though there are other firms that compete directly with the car wash portion of the business, the professional style auto mechanic bays for rent is a unique idea to market. This idea stems from facilities found at many major military installations. The majority of service members live in barracks and there are tight restrictions on the work that can be done on privately owned vehicles in the parking lots of those barracks. Therefore, the military built facilities where the service members could perform their own work on their vehicles.
To apply this business model to the civilian marketplace a similar demographic must be found. The required population must live in similar conditions, such as apartments, condominiums, or in areas with frequent inclement weather, which restrict car owners from performing auto repairs. Providing an area to rent that has adequate space, lighting and environmental controls and would also provide access to expensive professional equipment would appeal to DIY auto mechanics.
The value this business model brings to the market place is to the individual, who has the knowledge or desire to learn about basic auto repair, but does not have a place to do the work or the tools to perform the work. With the rising cost of auto repair parts and the labor costs for mechanics, a facility that would make performing standard auto maintenance and minor repairs more convenient and less expensive would provide tremendous value to the customers.
2.1 Company Locations and Facilities
DIY Wash N’ Fix intends to acquire an existing car wash facility with six bays. We expect to spend about $225,000 to buy a facility with enough land to expand the business. We will also construct an additional nine bays outfitted specifically for painting and repair. Construction will cost about $300,000, and the owners intend to contribute capital equal to 10% of initial investments. Approximately $53,200 worth of equipment will need to be purchased to properly equip our repair and painting facilities. Total initial assets will be $578,200.
The layout of the new facility will include three bays equipped with 6,000-pound capacity lifts for doing light work and oil changes. Three more bays will have heavy-duty 12,000-pound capacity lifts for doing major repair work. Finally, there will be three bays equipped with ventilation and equipment for painting cars. Also, there will be a customer service area for customers to check in and out their chosen work bays and tools. Fees will depend on the type of bay desired and range from $15 to $50 per hour of usage. Customers will have access to up to ten tools at a time to perform their repairs.

2.2 Start-up Summary
Operating Requirements and Associated Costs
The materials requirements for the car wash portion of the business will be minimal. Inventory for the car wash will also be kept to a minimum to reduce storage requirements. A supplier that will provide just-in-time supplies will be sought out. In addition, inventory requirements for the repair part will be kept to a minimum. We are not going into the retail auto parts industry. Referrals from local auto parts stores may be a primary method of introductory marketing, so competing directly with them is not our best option. Some items, such as motor oil, anti-freeze and air fresheners will be sold to encourage impulse buying. However, our strategy will focus on building rapport with other local automotive businesses. We will do this by referring our customers to them in order to buy the needed auto parts, and then they will return to DIY Wash N’ Fix to do the actual work.
The labor requirements for this firm will include several full-time employees and possibly some part-time employees to augment them during peak periods

Products and Services
The facility will be a standard coin-operated car wash with an attached building to house the other auto repair bays. The attached building will have nine bays with a customer service area and restroom/break area. Each bay will be designed for a specific type of repair work. There will be four types of bays:
- Car wash bay: Standard car wash equipment (spray guns, soap brushes, etc.).
- Auto Body/Paint bay: Special ventilation and other environmental controls needed to create an appropriate place to paint auto parts. Additional special equipment is needed for these bays (compressors, painting equipment, etc.).
- Wheel Lift bay: These bays will have a drive-on lift. Used for repairs not requiring the wheels or suspension to be free.
- Frame Lift bay: These bays will have a lift designed to pick up a vehicle by the frame, allowing the wheels and suspension to hang free.
There will also be a customer service area where the customers will originally check in, and they are assigned the appropriate bay at this time. Later, customers check tools in and out as needed, and finally, they check out and pay. In addition, we will provide resources like Chilton’s Manuals and online pages that provide DIY instructions and advice.
During the check-in process, the customer will complete a form with general information including name, address, phone number, method of payment, type of repair/maintenance to be performed, and expected time of completion. This form will have a disclaimer relinquishing DIY Wash N’ Fix from any liability resulting in the customer’s inability to perform the repair, lost or stolen private property if the customer leaves their bay unattended, and other issues as suggested by private and insurance carrier legal counsel. DIY Wash N’ Fix does expect to be liable for broken or faulty tools that are rented by mistake, but will not be liable for injury resulting from the misuse of a tool.
The customer will be given ten identification tags that can be traded for tools. A customer must give up one tag for each tool he wishes to rent. This process will accomplish several things. It prevents any one customer from accumulating all the tools, which would limit other customers’ access. It also prevents a customer from accumulating a large number of tools and attempting to steal them, thus limiting our risk exposure to any one customer. This system also makes check out easier. If the customer returns less than ten tags at check out, it is immediately obvious that all the tools have not been turned in. As tools are passed out in exchange for tags, the customer’s check-in form will be marked to indicate the type of tools being utilized. The price to rent the tools will vary. The life expectancy and replacement costs for the tools will be taken into consideration when developing a pricing strategy. If the method of payment chosen by the customer is credit card, then the number will be recorded prior to service, which will serve as further protection against stolen tools. If the customer wants to pay in cash, then the customer must either leave a credit card, drivers license or cash deposit before the ten tags are issued.
When a customer has completed his work, he will finish the check-out process prior to removing the car from the repair bay. The customer will return all of the identification tags, or the tools he received for the tags. Once the tool account has been reconciled, the completion time will be recorded and the receipt will be prepared. The receipt will provide an itemized list of costs to include: bay rental fee (based on time and type of bay), tool rental fee (based on the category of tools rented), miscellaneous charges (computer printouts of repair instructions or explosion charts), and taxes. After payment is made, the customer will be allowed to remove his car from the bay.
Government regulations that need to be rigorously adhered to are the safety standards of the hydraulic and other lift equipment, because this is a dangerous part of the automotive business. Additionally, the environmental regulations dictating the proper disposal of the drained auto fluids (oil, antifreeze, transmission fluid, etc.) will have to be posted and enforced. The drainage system will have to be appropriate for containing accidental spills.
Personnel Plan
The labor force for DIY Wash N’ Fix will be small. It will consist of a part-time general manager to handle inter-business relationships and corporate responsibilities. In addition, DIY Wash N’ Fix will employ three certified mechanics/managers; their duties will consist of the day-to-day operation of the firm. These duties fall into two categories: managerial and operational. Managerial tasks include: scheduling, inventory control and basic bookkeeping. Safety, regulatory issues, customer service and repair advice are the operational tasks they will be responsible for. Additionally, customer service clerks will be hired to perform the most basic tasks: customer service and custodial.
DIY Wash N’ Fix will have a single general manager to coordinate all outside business activities and partnerships. The business relationships would include accounting services, legal counsel, vendors and suppliers, maintenance providers, banking services, advertising and marketing services, and investment services. Laurie Snyder will fill this general management position. She will be receiving an MBA from the University of Notre Dame in May 2001.
The daily management of the business will be left to the lead mechanic. Even though DIY Wash N’ Fix is not a full service repair shop it can be expected that some customers will attempt repairs they are not familiar with and need advice. Therefore, we intend to hire three fully certified mechanics. The mechanics will not be authorized to perform any work on a customer’s car, but they will be able to take a look at the car to evaluate the problem. To reduce our liability for repairs done incorrectly we feel only professional mechanics should give advice to customers. The primary function of the mechanics will be customer service and managerial responsibilities. The first shift mechanic will be the primary on-site manager and will need to possess the following knowledge and skills in order to be able to perform effectively on the job:
Office Knowledge:
- Computer Literate
- Basic Bookkeeping
- Employee Scheduling
- Inventory Controls
Shop Knowledge:
- ASE Certified Mechanic
- OSHA & Safety Procedures
- Environmental Concerns
Shop Skills:
- Interpersonal Skills (Employees & Customers)
- Customer Focus
- Leadership
- Organizational
In addition to the mechanic who will be on staff, there will also be a need for customer service clerks. The primary applicants for these positions will be low-skilled workers who have an interest in vehicles, but do not possess formal schooling as an auto mechanic. These workers will be responsible for behind the counter customer service and general custodial duties (to include the bays, restrooms, customer services area and outside parking areas). For liability purposes they will not be allowed to give advice on repairs. The general knowledge and skill set we will be looking for from the these employees is as follows:
Shop Knowledge:
- Computer Literate
- Cash Register
- General Automotive / Equipment & Tool Usage
Shop Skills:
- Interpersonal Skills
- Customer Focus
- Custodial Work
- Organizational
| Personnel Plan | |||
| Year 1 | Year 2 | Year 3 | |
| General Manager | $40,000 | $42,000 | $44,100 |
| Mechanics | $145,488 | $152,762 | $160,401 |
| Administrative | $40,737 | $42,773 | $44,912 |
| Total People | 7 | 7 | 7 |
| Total Payroll | $226,225 | $237,536 | $249,413 |
Service Business Analysis
The industry we participate in consists of quite a few sub-industries. The ones that pertain most towards DIY Wash N’ Fix are the Car Wash Industry, the Auto Parts Industry, and the Mechanical Repair Industry.
5.1 Mechanical Repair Competitors
These competitors are less direct than the previous ones because we differ in terms of services. There are different types of competitors:
- Tire dealers/service centers: The major ones are, Firestone, Goodyear, and Michelin, which have recently expanded their services to include car diagnostic work.
- Quick lubes: They are mainly small independent stores, but the trend is consolidation, franchises (like Jiffy Lube) and trademark licenses (like Texaco). They are facing increasing competition from other types of outlets whose offerings include the services they provide. Finally, their main competitive advantage lies in their convenience and competence, not necessarily in low prices.
- Gas stations with service bays: They generally have fewer service bays and lower average tickets. They are competing against quick lube stores, big chains, general garages, and tire dealers. Their competitive advantage lies in their better-trained technicians, customer service and fast delivery.
- Independent repair stores: These are typically a small facility run by one owner. They face a declining market share in the favor of big chains and franchises, primarily because they cannot retain a skilled workforce. Commitment is their competitive advantage.
Therefore, the competitors we need to carefully watch are the big repair stores (chains, franchises, licenses) that offer many services thanks to a skilled workforce and heavy marketing expenses. They are able to retain customers and have the advantage of their brand recognition.
5.2 Auto Parts Industry
The after-market auto parts companies are retailers that sell directly to the end users and own stores throughout the U.S. Forty percent of all U.S. auto parts sales are made by the “Big Eight” auto part chains. The six largest retailers are: AutoZone, Advance, CSK, Pep Boys, Discount, O’Reilly, NAPA (National Auto Parts Association) and Carquest.
The following trends are prevalent within the industry:
- Consolidation through joint ventures, mergers and acquisitions.
- Increased competition, including a threat from Japanese competitors in the U.S.
- Expected growth of DIY (do-it-yourself) sales.
- Aging U.S. vehicle population (average car age is 8.5 years).
AutoZone is the number one retailer in this market; last year they realized $3.8 billion in sales. Auto part chains are expecting sales to continue as more car owners buy parts to do repair and maintenance themselves. This is a positive indicator for the potential success of DIY Wash N’ Fix.
Mechanical Auto Repair Industry
The auto repair industry is composed of two categories: the collision repair industry and the mechanical repair industry. Considering our business, with our facility and tool constraints, we will focus on the mechanical repair market and not the collision repair market. However, we expect we will have some customers wanting to do minor collision repairs.
Like the automotive industry as a whole, the mechanical repair industry is currently experiencing major structural changes. These trends include:
- An increased competition among the three main types of stores: the independent service stations and garages, the specialty repair outlets, and import specialists.
- A decrease in the market share of independent stores in favor of specialty repair outlets, which are consolidating.
- A strategic repositioning by many companies: focus on some specialty services or diversification into more types of mainstream services.
- A shift in stores owners: most shop owners are baby boomers who are reaching their retirement age and are looking for a successor.
- A growth in the number of electronically advanced components that are placed on cars, which requires a trained and skilled workforce.
- The growing importance of customer service and satisfaction.
5.3 Car Wash Industry
The car wash industry has entered the mature phase of its life cycle and is becoming increasingly competitive. The increasing competition is becoming apparent through the shift in three major industry trends. They are:
- Family-business succession issues: most coin-operated car washes are private family-owned businesses and many owners are at, or near, retirement age and are looking for successors.
- Venture capital: the car wash industry attracts investors who are not already in the business and who are looking to diversify their investments. There are two ways these investors are running their car washes after having bought the facility: they operate it themselves or compensate the ex-owner to continue operating it.
- Gas station chains: many are offering car washes either on a free or low-cost basis, investing in high technology equipment that requires little maintenance or labor.
5.3.1 Consequences of Trends
The consequences of these trends are:
- Competition is increasing.
- It is harder to differentiate comparable services.
- Customer loyalty will become more critical.
- Customers are more segmented.
- Investment in high quality equipment is required.
- Car wash service is combined with other services.
The main threat within the industry is the water recycling regulations that some states impose. For instance, Maryland requires car wash businesses to recycle 80% of the used water.
The car wash industry is seen as a profitable industry, provided that owners can differentiate their firms, create a loyal customer base, and develop methods to attract new customers. Moreover, profits are greater when a car wash is combined with other car-related services that provide better overall value and helps retain customers. In order to succeed in the industry, businesses must provide:
- Outstanding customer service.
- Quality wash.
- High-quality equipment (investment in long-term tangible assets).
- Easy access to facilities and good location.
- Relevant and quality other car services.
Sales Forecast
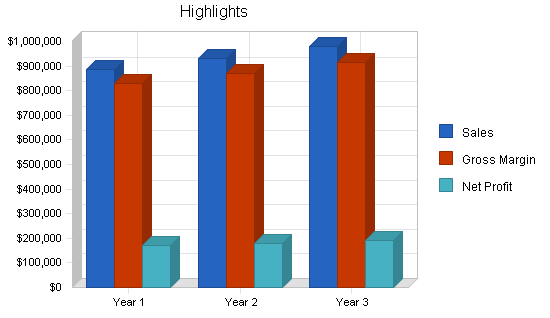
DIY Wash N’ Fix has conservatively forecasted revenue to grow at 5% per year, from $888,120 initially to $979,152 in 2004. Net income is expected to grow at 6% per year, from our initial estimate of $168,906 to $190,313 in 2004. There is potential for more growth, because of the value-added nature of our business. For example, the same customers will likely use all our facilities: the car wash, auto painting, oil change and major repair bays.
| Sales Forecast | |||
| Year 1 | Year 2 | Year 3 | |
| Unit Sales | |||
| Car Wash | 15,120 | 15,876 | 16,670 |
| Vacuum Cleaning | 15,120 | 15,876 | 16,670 |
| Car Paint | 7,560 | 7,938 | 8,335 |
| Oil Change | 7,560 | 7,938 | 8,335 |
| Other Repair | 7,560 | 7,938 | 8,335 |
| Vending Machines, etc. | 1,440 | 1,512 | 1,588 |
| Total Unit Sales | 54,360 | 57,078 | 59,932 |
| Unit Prices | Year 1 | Year 2 | Year 3 |
| Car Wash | $5.00 | $5.00 | $5.00 |
| Vacuum Cleaning | $1.00 | $1.00 | $1.00 |
| Car Paint | $50.00 | $50.00 | $50.00 |
| Oil Change | $15.00 | $15.00 | $15.00 |
| Other Repair | $40.00 | $40.00 | $40.00 |
| Vending Machines, etc. | $2.50 | $2.50 | $2.50 |
| Sales | |||
| Car Wash | $75,600 | $79,380 | $83,349 |
| Vacuum Cleaning | $15,120 | $15,876 | $16,670 |
| Car Paint | $378,000 | $396,900 | $416,745 |
| Oil Change | $113,400 | $119,070 | $125,024 |
| Other Repair | $302,400 | $317,520 | $333,396 |
| Vending Machines, etc. | $3,600 | $3,780 | $3,969 |
| Total Sales | $888,120 | $932,526 | $979,152 |
| Direct Unit Costs | Year 1 | Year 2 | Year 3 |
| Car Wash | $2.13 | $2.13 | $2.13 |
| Vacuum Cleaning | $0.43 | $0.43 | $0.43 |
| Car Paint | $1.13 | $1.13 | $1.13 |
| Oil Change | $0.38 | $0.38 | $0.38 |
| Other Repair | $0.85 | $0.85 | $0.85 |
| Vending Machines, etc. | $1.06 | $1.06 | $1.06 |
| Direct Cost of Sales | |||
| Car Wash | $32,130 | $33,737 | $35,423 |
| Vacuum Cleaning | $6,426 | $6,747 | $7,085 |
| Car Paint | $8,505 | $8,930 | $9,377 |
| Oil Change | $2,835 | $2,977 | $3,126 |
| Other Repair | $6,426 | $6,747 | $7,085 |
| Vending Machines, etc. | $1,530 | $1,607 | $1,687 |
| Subtotal Direct Cost of Sales | $57,852 | $60,745 | $63,782 |
Market Analysis Summary
Target Market
This business aims mainly at people performing basic auto repairs on their own vehicles. In addition, we will target those people wishing to work on their vehicles but unable to do so, because of restrictions (apartment rules, etc.) or weAther conditions, or because they do not own the necessary equipment and tools to perform this activity.
The considered locations for the DIY Wash N’ Fix project are California, Texas and Florida.
Unique Market Niche
Our concept is a coin-operated car wash combined with do-it-yourself auto repair facilities equipped with professional tools. This a a one-stop place for washing and fixing your car by yourself, which will appeal to auto repair enthusiasts.
Business Identity
The brand name of this facility will be “DIY Wash N’ Fix,” which fully expresses the comprehensive set of services offered to do-it-yourself car owners. In terms of physical characteristics, facilities will be clean, bright and well lit. The various bays will be well organized. The objective is to create a place where people will feel comfortable working.
Pricing
| Service | Prices |
| Automated Car Wash Bay | $5 (wash) + $1 (vacuum) |
| Oil Change Bay rental fee | $15/hr (oil and filter not provided) |
| Car Paint Bay rental fee | $50/hr |
| Other Repair Bay rental fee |
$30/hr (bay) + $10/hr (tools) |
| Vending Machines | $2.50 per item |
Competitors’ Prices
There are no comparable competition prices, as our services are different from any in the market, except, however for the coin-operated car wash which has an average price of $5. For full-service oil changes, the price ranges from $25 to $30.
7.1 Marketing Strategy
Advertising & Promotion
We will utilize an existing car wash for expanding into DIY auto repair; communication will be developed to inform current customers of the coming opening of DIY Wash N’ Fix. Billboards will announce the project, and posters and flyers will be available on-site, as well as in local specialized stores (automotive) and department stores.
The marketing budget will be dedicated to actions with a local scope. Print advertising will focus on local newspapers and direct-mail marketing. Broadcast advertising will be used on local radio stations and television channels.
The Internet is an additional media channel. A company website can inform current and potential customers of the services being offered at the DIY Wash N’ Fix facilities. The website address will be communicated through all the previously mentioned communication tools to incite people to check its offers. Visitors to the website can get pricing information and locations nearest them.
Business relationships will have to be created with local businesses such as auto parts stores, so that they would give referrals to their own customers to use the DIY Wash N’ Fix facilities.
Marketing Budget
The marketing budget allocated to the launching of the DIY Wash N’ Fix business is 10% of the estimated sales, i.e. $88,812 for year one. This budget will be used with a local scope in the media. The break down is 10% for billboards, 20% for posters and flyers, 25% for local newspapers and magazines, 27.5% for local radio stations and television channels, 10% for direct marketing operations, 5% for setting up and maintaining a Web site, as well as 2.5% that could be used to nurture relationships or partnerships with local stores providing referrals to their customers.
7.2 Media Plan
Uses and costs of specific marketing tools for the first year:
| Communication Tool | Budget % | Cost | Timing |
| Billboards | 10% | $8,881 | Starting before opening. |
| Posters and flyers | 20% | $17,762 | Announce the opening of the facility. Also steady flyers to inform about the facilities. |
| Local newspapers and magazines | 25% | $22,203 | Opening time + steady ads. |
| Local radio stations and television channels | 27.5% | $24,423 | Opening time + steady ads. |
| Direct marketing | 10% | $8,881 | |
| Website | 5% | $4,442 | Available before the opening of the facilities + updates to allow online reservation for a bay. |
| Relations with local businesses | 2.5% | $2,220 | |
| Total | 100% | $88,812 |
7.2.1 Service and Warranty
DIY Wash N’ Fix will not give any warranty of the repair operations made by individuals. When checking in, the customer fills out a form with a disclaimer relinquishing DIY Wash N’ Fix from any liability resulting in the customer’s inability to perform the repair, as well as any lost or stolen property if the customer leaves the bay unattended. However, DIY Wash N’ Fix provides advice and information to its customers in terms of which tools to use, and repair guides are available for consultation.
7.3 Target Market Segment Strategy
Primary Target Markets
The broad target market for DIY Wash N’ Fix consists of individuals who are willing and able to perform minor repair and maintenance on automobiles. Specifically, we are targeting an individual who wants to work on his vehicle, yet does not have the proper tools or adequate workspace to do so. We believe there is a segment of the population that would like to perform their own maintenance, but do not for the following reasons:
- They do not have an appropriate space to work on their vehicle, such as a heated, well-lit garage.
- They do not have the right equipment, such as hydraulic lifts, pneumatic wrenches, etc.
- They do not have the right tools, such as torque wrenches, star-headed screwdrivers, extension socket wrenches, etc.
Certain auto parts require special tools to replace that specific part. These tools can be expensive and impractical for the average consumer to buy. Targeting individuals with physical space constraints is essential to our success. Our target market must have the desire to do this work but lack the area to do it in. For example, individuals living in apartment buildings cannot do maintenance on their vehicles in the apartment building parking lots. The number one reason individuals do DIY work is to save money. Therefore, we are targeting the lower income do-it-yourselfer who will find our services beneficial.
Secondary Target Markets
The secondary target market for DIY Wash N’ Fix is focused on individuals who wash their own vehicles. This is a broader market that includes our entire primary market. This individual bears the responsibility of maintaining their vehicle’s appearance. The cost savings and act of washing their own vehicle is more attractive to them than paying someone else to do it.
Demographics of Target Market
In a comprehensive survey consisting of 2,584 interviews with do-it-yourselfers, approximately 89% of the respondents were male. The breakdown of the respondents according to age was as follows:
|
Age |
Percent |
|
< 18 |
2% |
|
18-25 |
18% |
|
26-35 |
30% |
|
36-45 |
24% |
|
46-55 |
16% |
|
56-65 |
7% |
|
> 65 |
3% |
As previously mentioned, saving money is important to the do-it-yourselfer. Therefore, income is also important in identifying the target market. The following is a list of the amount of DIY activity as a function of income:
| Income | Amount of DIY activity |
| < $20,000 | 12% |
| $20-$29,000 | 18% |
| $30-$39,000 | 22% |
| $40-$49,000 | 12% |
| $90-$99,999 | 14% |
Broken down by race, the number of Asians and Hispanics that are do-it-yourselfers was approximately 60%. Caucasians and African Americans registered at approximately 48%.
To determine geographic locations for this target market, the top locations for retail after-market auto parts were evaluated. According to the U.S. Department of Labor, the following states have the most auto parts stores: California (5,030), Texas (3,280) and Florida (2,558). Therefore, we are going to locate our facility in one of these states because of the high percentage of DIY sales.
Contingency Plan
The business model is viable for the foreseeable future. There is no readily available personal transportation substitute for cars and trucks and despite the improving engineering, there will always be a need for maintenance and repairs. There will also always be people that love their cars and will want to do their own work. Additionally, as cars become more complex, people will not want to buy the specialty tools required to do some of the work, but would be willing to rent them.
Also, as metropolitan areas grow, more people are living in apartments and condominiums, which restrict the repairs which can be done in the parking lots. This also will help support our business model, as people look for alternative space in which to work on their vehicles.
8.1 Growth Strategy
Given that the success of the firm is rooted in the demographics of the local market, expansion must be done very carefully. This business model will most likely grow through the opening of new facilities in new markets. Once the enterprise has reached its maximum geographical limit under the current management, a possible growth strategy will be to franchise the name and business process. The most probable target market for this expansion strategy would be current owners of coin-operated car washes.
In addition, our business model will provide a first-mover advantage. This is an easy business model to copy, but a first mover can establish a strong enough foothold into a given market so that it will continue to provide a solid cash flow even if competitors move in. Franchising will allow us to expand farther faster.
8.2 Succession Plan
This firm will be incorporated to protect the owners from personal liability. Succession will come at the discretion of the board.
Financial Plan
The financials of DIY Wash N’ Fix are built upon a number of conservative assumptions. The business is segmented into the original six car wash bays and three of each of the following bays: car painting, oil change/basic repair and other major repairs.
The balance sheet shows that most of our assets are long-term PP&E. Cash, the only short-term asset, is forecasted to grow at about 7% per year from $177,362 to $377,317. Initially, total assets are $755,562. Liabilities consist of the long-term loans taken on to pay for the PP&E, which amount to $520,380. This leaves us with $235,182 in initial owners equity.
The income statement reveals that revenues for each segment and the entire business are expected to grow at 5% per year, and net income is forecasted to grow at about 6% per year.
Expenses
Expenses are approximately 57% of revenues. Expenses include wages, utilities, maintenance, marketing and capital expenditures. Wages are set at $7.00 per hour for clerks and $25.00 per hour for mechanics. There will be three clerks and three mechanics on staff full-time to ensure that a clerk and a mechanic are always available during business hours of 7:00 AM to 11:00 PM. Utilities are estimated to be 15% of revenues. Direct cost of sales (i.e., maintenance expenses) for all equipment, including the hydraulic lifts and painting equipment, are estimated to be 2.5% of revenues. Maintenance for the tools is 1% of revenues, and clean up for the car painting operation are 5% of revenues. Other building maintenance is estimated at 0.5% of revenues. The marketing budget is 10% of revenues. There is a capital expenditure of $1,500 per year to replace lost or broken tools. Depreciation is done on a straight-line basis. The time periods used are 15 years for all equipment and 30 years for the buildings.
Financing
DIY Wash N’ Fix has taken on long-term debt to finance its asset purchases of $578,200. The debt ranges in maturity from 15 to 30 years, and it is financed at 8%. There was an initial outlay of 10% of all the assets purchased for a down payment on the loans, totaling $57,820. Therefore, the amount financed is 90% of the asset value, or $520,380. This amounts to a monthly debt service of $4,128 or $49,245 annually.
- The old car wash with six bays that we purchase to start our business is valued on an asset basis at approx. $225,000. This purchase price includes sufficient land to build our new facility. After we put the 10% down, our loan value is $202,500. The car wash will be depreciated over 30 years for the building and over 15 years for the equipment.
- We will construct a new building on the land we purchased with nine new bays for our car painting and repair operations. Construction costs are estimated at $30,000 per bay, for a total of $270,000. For each of the three car painting bays, there will be an additional cost of $10,000 per bay for proper ventilation and environmental compliance. Therefore, our total construction costs are $300,000. We will put 10% down and finance $270,000 for 30 years at 8%.
Pricing and Revenues
DIY Wash N’ Fix will charge $5 per car wash in our coin-operated facility. We have assumed an average usage of seven hours per day, so this amounts to $35 per bay per day or $1,050 per month. We have six bays, so our annual direct car wash revenues are $75,600. In addition to the basic car wash, we have assumed that the facility we purchased will include six vacuums, two vending machines and one fragrance machine for customers to use for a nominal fee. These amount to additional annual revenues of $18,720. Car wash revenues are estimated to increase 5% per year, due to the value-added services we provide on location at DIY Wash N’ Fix.
We have three bays with a small 6,000-pound capacity lift to perform oil changes and basic repair work. We will charge $15 per hour for use of these bays, in order to be competitive with our competition in quick oil changes. Estimated usage is seven hours per day. These lifts cost $2,100 each, for a total of $6,300. We’re financing $5,670 for 15 years at 8%.
We have three additional bays equipped with 12,000-pound capacity heavy-duty lifts for complicated repair work. The cost to use these bays is $30 per hour, with an additional tools cost of $10 per hour to access up to ten tools at a time. Estimated usage is seven hours per day. The tools purchases, amounting to $25,000 initially, are included in this segment, because this is where we expect the major tool usage. The large lifts cost $5,800 each, for a total of $17,400 in lift costs. Total financing for the lifts and the tools is $38,160.
Finally, there are three bays equipped to paint cars and the fee is $50 per hour. It is probable that one paint job will take most of the seven hours estimated usage, including drying time unexposed to the elements. The fee for painting is higher, because the bays are more expensive to build and maintain. Equipment, including compressors and paint guns, will cost $4,500, and we will finance $4,050.
9.1 Important Assumptions
The key assumption within this business model is: there is a portion of the population that would like to do basic repairs and/or maintenance on their vehicles, but they don’t because they lack necessary tools or a proper work space. Therefore, they will be willing to pay rental fees to have access to tools and a work space.
Given that the assumption is true, then the key element of success for the venture will be pricing. The customers must feel there is value for the rent they are paying. If the price is too high, the substitution for our service will be taking a vehicle to a full service mechanic. However, if the price is too low, the firm will not be able to recover the cost of the initial capital expenditures.
If the assumption is not true and the firm cannot attract enough customers, then several exit strategies are available:
- Maintain ownership of both the car wash and repair bays, but lease the repair bays to a full service auto mechanic firm.
- Maintain ownership of both the car wash and repair bays, but own and operate a franchised auto repair shop (Midas, Meineke, etc.) in the repair bays and provide full service and eliminate do-it-yourself.
- Sell all property and exit industry.
9.2 Break-even Analysis
The chart and table below show the Break-even Analysis for the company.

| Break-even Analysis | |
| Monthly Units Break-even | 2,769 |
| Monthly Revenue Break-even | $45,236 |
| Assumptions: | |
| Average Per-Unit Revenue | $16.34 |
| Average Per-Unit Variable Cost | $1.06 |
| Estimated Monthly Fixed Cost | $42,289 |
9.3 Projected Profit and Loss
The table below shows the profit and loss statement for the company.
| Pro Forma Profit and Loss | |||
| Year 1 | Year 2 | Year 3 | |
| Sales | $888,120 | $932,526 | $979,152 |
| Direct Cost of Sales | $57,852 | $60,745 | $63,782 |
| Other | $0 | $0 | $0 |
| Total Cost of Sales | $57,852 | $60,745 | $63,782 |
| Gross Margin | $830,268 | $871,781 | $915,370 |
| Gross Margin % | 93.49% | 93.49% | 93.49% |
| Expenses | |||
| Payroll | $226,225 | $237,536 | $249,413 |
| Sales and Marketing and Other Expenses | $228,030 | $240,132 | $252,788 |
| Depreciation | $1,200 | $1,200 | $1,200 |
| Insurance | $18,084 | $17,970 | $17,435 |
| Payroll Taxes | $33,934 | $35,630 | $37,412 |
| Other | $0 | $0 | $0 |
| Total Operating Expenses | $507,472 | $532,468 | $558,248 |
| Profit Before Interest and Taxes | $322,796 | $339,314 | $357,123 |
| EBITDA | $323,996 | $340,514 | $358,323 |
| Interest Expense | $41,285 | $40,650 | $39,934 |
| Taxes Incurred | $110,261 | $119,466 | $124,232 |
| Net Profit | $171,250 | $179,198 | $192,956 |
| Net Profit/Sales | 19.28% | 19.22% | 19.71% |
9.4 Projected Cash Flow
As can be seen in the following chart and table, the company expects a steady increase in cash flow within the first twelve months of operation, continuing through the first three years of plan implementation.

| Pro Forma Cash Flow | |||
| Year 1 | Year 2 | Year 3 | |
| Cash Received | |||
| Cash from Operations | |||
| Cash Sales | $888,120 | $932,526 | $979,152 |
| Subtotal Cash from Operations | $888,120 | $932,526 | $979,152 |
| Additional Cash Received | |||
| Sales Tax, VAT, HST/GST Received | $0 | $0 | $0 |
| New Current Borrowing | $0 | $0 | $0 |
| New Other Liabilities (interest-free) | $0 | $0 | $0 |
| New Long-term Liabilities | $0 | $0 | $0 |
| Sales of Other Current Assets | $0 | $0 | $0 |
| Sales of Long-term Assets | $0 | $0 | $0 |
| New Investment Received | $0 | $0 | $0 |
| Subtotal Cash Received | $888,120 | $932,526 | $979,152 |
| Expenditures | Year 1 | Year 2 | Year 3 |
| Expenditures from Operations | |||
| Cash Spending | $226,225 | $237,536 | $249,413 |
| Bill Payments | $455,147 | $512,142 | $534,135 |
| Subtotal Spent on Operations | $681,371 | $749,678 | $783,548 |
| Additional Cash Spent | |||
| Sales Tax, VAT, HST/GST Paid Out | $0 | $0 | $0 |
| Principal Repayment of Current Borrowing | $0 | $0 | $0 |
| Other Liabilities Principal Repayment | $0 | $0 | $0 |
| Long-term Liabilities Principal Repayment | $7,960 | $8,597 | $9,285 |
| Purchase Other Current Assets | $0 | $0 | $0 |
| Purchase Long-term Assets | $1,500 | $1,500 | $1,500 |
| Dividends | $0 | $0 | $0 |
| Subtotal Cash Spent | $690,831 | $759,775 | $794,333 |
| Net Cash Flow | $197,289 | $172,751 | $184,819 |
| Cash Balance | $374,651 | $547,402 | $732,221 |
9.5 Projected Balance Sheet
The table below shows the projected Balance Sheet for the company.
| Pro Forma Balance Sheet | |||
| Year 1 | Year 2 | Year 3 | |
| Assets | |||
| Current Assets | |||
| Cash | $374,651 | $547,402 | $732,221 |
| Inventory | $5,303 | $5,568 | $5,847 |
| Other Current Assets | $0 | $0 | $0 |
| Total Current Assets | $379,954 | $552,970 | $738,068 |
| Long-term Assets | |||
| Long-term Assets | $579,700 | $581,200 | $582,700 |
| Accumulated Depreciation | $1,200 | $2,400 | $3,600 |
| Total Long-term Assets | $578,500 | $578,800 | $579,100 |
| Total Assets | $958,454 | $1,131,770 | $1,317,168 |
| Liabilities and Capital | Year 1 | Year 2 | Year 3 |
| Current Liabilities | |||
| Accounts Payable | $39,602 | $42,317 | $44,043 |
| Current Borrowing | $0 | $0 | $0 |
| Other Current Liabilities | $0 | $0 | $0 |
| Subtotal Current Liabilities | $39,602 | $42,317 | $44,043 |
| Long-term Liabilities | $512,420 | $503,823 | $494,538 |
| Total Liabilities | $552,022 | $546,140 | $538,581 |
| Paid-in Capital | $236,182 | $236,182 | $236,182 |
| Retained Earnings | ($1,000) | $170,250 | $349,448 |
| Earnings | $171,250 | $179,198 | $192,956 |
| Total Capital | $406,432 | $585,630 | $778,586 |
| Total Liabilities and Capital | $958,454 | $1,131,770 | $1,317,168 |
| Net Worth | $406,432 | $585,630 | $778,586 |
9.6 Business Ratios
The following table contains important ratios from the automotive services industry, as determined by the Standard Industry Classification (SIC) Index code 7542.
| Ratio Analysis | ||||
| Year 1 | Year 2 | Year 3 | Industry Profile | |
| Sales Growth | 0.00% | 5.00% | 5.00% | 3.00% |
| Percent of Total Assets | ||||
| Inventory | 0.55% | 0.49% | 0.44% | 9.50% |
| Other Current Assets | 0.00% | 0.00% | 0.00% | 26.40% |
| Total Current Assets | 39.64% | 48.86% | 56.03% | 44.60% |
| Long-term Assets | 60.36% | 51.14% | 43.97% | 55.40% |
| Total Assets | 100.00% | 100.00% | 100.00% | 100.00% |
| Current Liabilities | 4.13% | 3.74% | 3.34% | 29.30% |
| Long-term Liabilities | 53.46% | 44.52% | 37.55% | 27.80% |
| Total Liabilities | 57.60% | 48.26% | 40.89% | 57.10% |
| Net Worth | 42.40% | 51.74% | 59.11% | 42.90% |
| Percent of Sales | ||||
| Sales | 100.00% | 100.00% | 100.00% | 100.00% |
| Gross Margin | 93.49% | 93.49% | 93.49% | 0.00% |
| Selling, General & Administrative Expenses | 74.47% | 74.27% | 74.05% | 68.20% |
| Advertising Expenses | 10.00% | 10.00% | 10.00% | 1.50% |
| Profit Before Interest and Taxes | 36.35% | 36.39% | 36.47% | 2.70% |
| Main Ratios | ||||
| Current | 9.59 | 13.07 | 16.76 | 1.53 |
| Quick | 9.46 | 12.94 | 16.62 | 0.88 |
| Total Debt to Total Assets | 57.60% | 48.26% | 40.89% | 57.10% |
| Pre-tax Return on Net Worth | 69.26% | 51.00% | 40.74% | 3.40% |
| Pre-tax Return on Assets | 29.37% | 26.39% | 24.08% | 8.00% |
| Additional Ratios | Year 1 | Year 2 | Year 3 | |
| Net Profit Margin | 19.28% | 19.22% | 19.71% | n.a |
| Return on Equity | 42.13% | 30.60% | 24.78% | n.a |
| Activity Ratios | ||||
| Inventory Turnover | 10.91 | 11.18 | 11.18 | n.a |
| Accounts Payable Turnover | 12.49 | 12.17 | 12.17 | n.a |
| Payment Days | 27 | 29 | 29 | n.a |
| Total Asset Turnover | 0.93 | 0.82 | 0.74 | n.a |
| Debt Ratios | ||||
| Debt to Net Worth | 1.36 | 0.93 | 0.69 | n.a |
| Current Liab. to Liab. | 0.07 | 0.08 | 0.08 | n.a |
| Liquidity Ratios | ||||
| Net Working Capital | $340,352 | $510,653 | $694,024 | n.a |
| Interest Coverage | 7.82 | 8.35 | 8.94 | n.a |
| Additional Ratios | ||||
| Assets to Sales | 1.08 | 1.21 | 1.35 | n.a |
| Current Debt/Total Assets | 4% | 4% | 3% | n.a |
| Acid Test | 9.46 | 12.94 | 16.62 | n.a |
| Sales/Net Worth | 2.19 | 1.59 | 1.26 | n.a |
| Dividend Payout | 0.00 | 0.00 | 0.00 | n.a |
Appendix
| Pro Forma Profit and Loss | |||||||||||||
| Month 1 | Month 2 | Month 3 | Month 4 | Month 5 | Month 6 | Month 7 | Month 8 | Month 9 | Month 10 | Month 11 | Month 12 | ||
| Sales | $74,010 | $74,010 | $74,010 | $74,010 | $74,010 | $74,010 | $74,010 | $74,010 | $74,010 | $74,010 | $74,010 | $74,010 | |
| Direct Cost of Sales | $4,821 | $4,821 | $4,821 | $4,821 | $4,821 | $4,821 | $4,821 | $4,821 | $4,821 | $4,821 | $4,821 | $4,821 | |
| Other | $0 | $0 | $0 | $0 | $0 | $0 | $0 | $0 | $0 | $0 | $0 | $0 | |
| Total Cost of Sales | $4,821 | $4,821 | $4,821 | $4,821 | $4,821 | $4,821 | $4,821 | $4,821 | $4,821 | $4,821 | $4,821 | $4,821 | |
| Gross Margin | $69,189 | $69,189 | $69,189 | $69,189 | $69,189 | $69,189 | $69,189 | $69,189 | $69,189 | $69,189 | $69,189 | $69,189 | |
| Gross Margin % | 93.49% | 93.49% | 93.49% | 93.49% | 93.49% | 93.49% | 93.49% | 93.49% | 93.49% | 93.49% | 93.49% | 93.49% | |
| Expenses | |||||||||||||
| Payroll | $18,852 | $18,852 | $18,852 | $18,852 | $18,852 | $18,852 | $18,852 | $18,852 | $18,852 | $18,852 | $18,852 | $18,852 | |
| Sales and Marketing and Other Expenses | $19,003 | $19,003 | $19,003 | $19,003 | $19,003 | $19,003 | $19,003 | $19,003 | $19,003 | $19,003 | $19,003 | $19,003 | |
| Depreciation | $100 | $100 | $100 | $100 | $100 | $100 | $100 | $100 | $100 | $100 | $100 | $100 | |
| Insurance | $1,507 | $1,507 | $1,507 | $1,507 | $1,507 | $1,507 | $1,507 | $1,507 | $1,507 | $1,507 | $1,507 | $1,507 | |
| Payroll Taxes | 15% | $2,828 | $2,828 | $2,828 | $2,828 | $2,828 | $2,828 | $2,828 | $2,828 | $2,828 | $2,828 | $2,828 | $2,828 |
| Other | $0 | $0 | $0 | $0 | $0 | $0 | $0 | $0 | $0 | $0 | $0 | $0 | |
| Total Operating Expenses | $42,289 | $42,289 | $42,289 | $42,289 | $42,289 | $42,289 | $42,289 | $42,289 | $42,289 | $42,289 | $42,289 | $42,289 | |
| Profit Before Interest and Taxes | $26,900 | $26,900 | $26,900 | $26,900 | $26,900 | $26,900 | $26,900 | $26,900 | $26,900 | $26,900 | $26,900 | $26,900 | |
| EBITDA | $27,000 | $27,000 | $27,000 | $27,000 | $27,000 | $27,000 | $27,000 | $27,000 | $27,000 | $27,000 | $27,000 | $27,000 | |
| Interest Expense | $3,465 | $3,460 | $3,456 | $3,452 | $3,447 | $3,443 | $3,438 | $3,434 | $3,429 | $3,425 | $3,421 | $3,416 | |
| Taxes Incurred | $7,030 | $9,376 | $9,377 | $9,379 | $9,381 | $9,383 | $9,385 | $9,386 | $9,388 | $9,390 | $9,392 | $9,393 | |
| Net Profit | $16,404 | $14,064 | $14,066 | $14,069 | $14,072 | $14,074 | $14,077 | $14,079 | $14,082 | $14,085 | $14,087 | $14,090 | |
| Net Profit/Sales | 22.17% | 19.00% | 19.01% | 19.01% | 19.01% | 19.02% | 19.02% | 19.02% | 19.03% | 19.03% | 19.03% | 19.04% | |
| Pro Forma Cash Flow | |||||||||||||
| Month 1 | Month 2 | Month 3 | Month 4 | Month 5 | Month 6 | Month 7 | Month 8 | Month 9 | Month 10 | Month 11 | Month 12 | ||
| Cash Received | |||||||||||||
| Cash from Operations | |||||||||||||
| Cash Sales | $74,010 | $74,010 | $74,010 | $74,010 | $74,010 | $74,010 | $74,010 | $74,010 | $74,010 | $74,010 | $74,010 | $74,010 | |
| Subtotal Cash from Operations | $74,010 | $74,010 | $74,010 | $74,010 | $74,010 | $74,010 | $74,010 | $74,010 | $74,010 | $74,010 | $74,010 | $74,010 | |
| Additional Cash Received | |||||||||||||
| Sales Tax, VAT, HST/GST Received | 0.00% | $0 | $0 | $0 | $0 | $0 | $0 | $0 | $0 | $0 | $0 | $0 | $0 |
| New Current Borrowing | $0 | $0 | $0 | $0 | $0 | $0 | $0 | $0 | $0 | $0 | $0 | $0 | |
| New Other Liabilities (interest-free) | $0 | $0 | $0 | $0 | $0 | $0 | $0 | $0 | $0 | $0 | $0 | $0 | |
| New Long-term Liabilities | $0 | $0 | $0 | $0 | $0 | $0 | $0 | $0 | $0 | $0 | $0 | $0 | |
| Sales of Other Current Assets | $0 | $0 | $0 | $0 | $0 | $0 | $0 | $0 | $0 | $0 | $0 | $0 | |
| Sales of Long-term Assets | $0 | $0 | $0 | $0 | $0 | $0 | $0 | $0 | $0 | $0 | $0 | $0 | |
| New Investment Received | $0 | $0 | $0 | $0 | $0 | $0 | $0 | $0 | $0 | $0 | $0 | $0 | |
| Subtotal Cash Received | $74,010 | $74,010 | $74,010 | $74,010 | $74,010 | $74,010 | $74,010 | $74,010 | $74,010 | $74,010 | $74,010 | $74,010 | |
| Expenditures | Month 1 | Month 2 | Month 3 | Month 4 | Month 5 | Month 6 | Month 7 | Month 8 | Month 9 | Month 10 | Month 11 | Month 12 | |
| Expenditures from Operations | |||||||||||||
| Cash Spending | $18,852 | $18,852 | $18,852 | $18,852 | $18,852 | $18,852 | $18,852 | $18,852 | $18,852 | $18,852 | $18,852 | $18,852 | |
| Bill Payments | $1,465 | $43,858 | $40,994 | $40,992 | $40,989 | $40,986 | $40,984 | $40,981 | $40,978 | $40,976 | $40,973 | $40,970 | |
| Subtotal Spent on Operations | $20,317 | $62,710 | $59,846 | $59,844 | $59,841 | $59,838 | $59,836 | $59,833 | $59,830 | $59,828 | $59,825 | $59,822 | |
| Additional Cash Spent | |||||||||||||
| Sales Tax, VAT, HST/GST Paid Out | $0 | $0 | $0 | $0 | $0 | $0 | $0 | $0 | $0 | $0 | $0 | $0 | |
| Principal Repayment of Current Borrowing | $0 | $0 | $0 | $0 | $0 | $0 | $0 | $0 | $0 | $0 | $0 | $0 | |
| Other Liabilities Principal Repayment | $0 | $0 | $0 | $0 | $0 | $0 | $0 | $0 | $0 | $0 | $0 | $0 | |
| Long-term Liabilities Principal Repayment | $663 | $663 | $663 | $663 | $663 | $663 | $663 | $663 | $663 | $663 | $663 | $663 | |
| Purchase Other Current Assets | $0 | $0 | $0 | $0 | $0 | $0 | $0 | $0 | $0 | $0 | $0 | $0 | |
| Purchase Long-term Assets | $125 | $125 | $125 | $125 | $125 | $125 | $125 | $125 | $125 | $125 | $125 | $125 | |
| Dividends | $0 | $0 | $0 | $0 | $0 | $0 | $0 | $0 | $0 | $0 | $0 | $0 | |
| Subtotal Cash Spent | $21,106 | $63,498 | $60,635 | $60,632 | $60,629 | $60,627 | $60,624 | $60,621 | $60,619 | $60,616 | $60,613 | $60,611 | |
| Net Cash Flow | $52,904 | $10,512 | $13,375 | $13,378 | $13,381 | $13,383 | $13,386 | $13,389 | $13,391 | $13,394 | $13,397 | $13,399 | |
| Cash Balance | $230,266 | $240,778 | $254,153 | $267,531 | $280,912 | $294,295 | $307,681 | $321,070 | $334,461 | $347,855 | $361,252 | $374,651 | |
| Pro Forma Balance Sheet | |||||||||||||
| Month 1 | Month 2 | Month 3 | Month 4 | Month 5 | Month 6 | Month 7 | Month 8 | Month 9 | Month 10 | Month 11 | Month 12 | ||
| Assets | Starting Balances | ||||||||||||
| Current Assets | |||||||||||||
| Cash | $177,362 | $230,266 | $240,778 | $254,153 | $267,531 | $280,912 | $294,295 | $307,681 | $321,070 | $334,461 | $347,855 | $361,252 | $374,651 |
| Inventory | $0 | $5,303 | $5,303 | $5,303 | $5,303 | $5,303 | $5,303 | $5,303 | $5,303 | $5,303 | $5,303 | $5,303 | $5,303 |
| Other Current Assets | $0 | $0 | $0 | $0 | $0 | $0 | $0 | $0 | $0 | $0 | $0 | $0 | $0 |
| Total Current Assets | $177,362 | $235,569 | $246,081 | $259,457 | $272,835 | $286,215 | $299,598 | $312,984 | $326,373 | $339,764 | $353,158 | $366,555 | $379,954 |
| Long-term Assets | |||||||||||||
| Long-term Assets | $578,200 | $578,325 | $578,450 | $578,575 | $578,700 | $578,825 | $578,950 | $579,075 | $579,200 | $579,325 | $579,450 | $579,575 | $579,700 |
| Accumulated Depreciation | $0 | $100 | $200 | $300 | $400 | $500 | $600 | $700 | $800 | $900 | $1,000 | $1,100 | $1,200 |
| Total Long-term Assets | $578,200 | $578,225 | $578,250 | $578,275 | $578,300 | $578,325 | $578,350 | $578,375 | $578,400 | $578,425 | $578,450 | $578,475 | $578,500 |
| Total Assets | $755,562 | $813,794 | $824,331 | $837,732 | $851,135 | $864,540 | $877,948 | $891,359 | $904,773 | $918,189 | $931,608 | $945,030 | $958,454 |
| Liabilities and Capital | Month 1 | Month 2 | Month 3 | Month 4 | Month 5 | Month 6 | Month 7 | Month 8 | Month 9 | Month 10 | Month 11 | Month 12 | |
| Current Liabilities | |||||||||||||
| Accounts Payable | $0 | $42,491 | $39,628 | $39,625 | $39,623 | $39,620 | $39,618 | $39,615 | $39,613 | $39,610 | $39,607 | $39,605 | $39,602 |
| Current Borrowing | $0 | $0 | $0 | $0 | $0 | $0 | $0 | $0 | $0 | $0 | $0 | $0 | $0 |
| Other Current Liabilities | $0 | $0 | $0 | $0 | $0 | $0 | $0 | $0 | $0 | $0 | $0 | $0 | $0 |
| Subtotal Current Liabilities | $0 | $42,491 | $39,628 | $39,625 | $39,623 | $39,620 | $39,618 | $39,615 | $39,613 | $39,610 | $39,607 | $39,605 | $39,602 |
| Long-term Liabilities | $520,380 | $519,717 | $519,053 | $518,390 | $517,727 | $517,063 | $516,400 | $515,737 | $515,073 | $514,410 | $513,747 | $513,083 | $512,420 |
| Total Liabilities | $520,380 | $562,208 | $558,681 | $558,015 | $557,349 | $556,684 | $556,018 | $555,352 | $554,686 | $554,020 | $553,354 | $552,688 | $552,022 |
| Paid-in Capital | $236,182 | $236,182 | $236,182 | $236,182 | $236,182 | $236,182 | $236,182 | $236,182 | $236,182 | $236,182 | $236,182 | $236,182 | $236,182 |
| Retained Earnings | ($1,000) | ($1,000) | ($1,000) | ($1,000) | ($1,000) | ($1,000) | ($1,000) | ($1,000) | ($1,000) | ($1,000) | ($1,000) | ($1,000) | ($1,000) |
| Earnings | $0 | $16,404 | $30,468 | $44,534 | $58,603 | $72,675 | $86,749 | $100,826 | $114,905 | $128,987 | $143,072 | $157,160 | $171,250 |
| Total Capital | $235,182 | $251,586 | $265,650 | $279,716 | $293,785 | $307,857 | $321,931 | $336,008 | $350,087 | $364,169 | $378,254 | $392,342 | $406,432 |
| Total Liabilities and Capital | $755,562 | $813,794 | $824,331 | $837,732 | $851,135 | $864,540 | $877,948 | $891,359 | $904,773 | $918,189 | $931,608 | $945,030 | $958,454 |
| Net Worth | $235,182 | $251,586 | $265,650 | $279,716 | $293,785 | $307,857 | $321,931 | $336,008 | $350,087 | $364,169 | $378,254 | $392,342 | $406,432 |
| Sales Forecast | |||||||||||||
| Month 1 | Month 2 | Month 3 | Month 4 | Month 5 | Month 6 | Month 7 | Month 8 | Month 9 | Month 10 | Month 11 | Month 12 | ||
| Unit Sales | |||||||||||||
| Car Wash | 0% | 1,260 | 1,260 | 1,260 | 1,260 | 1,260 | 1,260 | 1,260 | 1,260 | 1,260 | 1,260 | 1,260 | 1,260 |
| Vacuum Cleaning | 0% | 1,260 | 1,260 | 1,260 | 1,260 | 1,260 | 1,260 | 1,260 | 1,260 | 1,260 | 1,260 | 1,260 | 1,260 |
| Car Paint | 0% | 630 | 630 | 630 | 630 | 630 | 630 | 630 | 630 | 630 | 630 | 630 | 630 |
| Oil Change | 0% | 630 | 630 | 630 | 630 | 630 | 630 | 630 | 630 | 630 | 630 | 630 | 630 |
| Other Repair | 0% | 630 | 630 | 630 | 630 | 630 | 630 | 630 | 630 | 630 | 630 | 630 | 630 |
| Vending Machines, etc. | 0% | 120 | 120 | 120 | 120 | 120 | 120 | 120 | 120 | 120 | 120 | 120 | 120 |
| Total Unit Sales | 4,530 | 4,530 | 4,530 | 4,530 | 4,530 | 4,530 | 4,530 | 4,530 | 4,530 | 4,530 | 4,530 | 4,530 | |
| Unit Prices | Month 1 | Month 2 | Month 3 | Month 4 | Month 5 | Month 6 | Month 7 | Month 8 | Month 9 | Month 10 | Month 11 | Month 12 | |
| Car Wash | $5.00 | $5.00 | $5.00 | $5.00 | $5.00 | $5.00 | $5.00 | $5.00 | $5.00 | $5.00 | $5.00 | $5.00 | |
| Vacuum Cleaning | $1.00 | $1.00 | $1.00 | $1.00 | $1.00 | $1.00 | $1.00 | $1.00 | $1.00 | $1.00 | $1.00 | $1.00 | |
| Car Paint | $50.00 | $50.00 | $50.00 | $50.00 | $50.00 | $50.00 | $50.00 | $50.00 | $50.00 | $50.00 | $50.00 | $50.00 | |
| Oil Change | $15.00 | $15.00 | $15.00 | $15.00 | $15.00 | $15.00 | $15.00 | $15.00 | $15.00 | $15.00 | $15.00 | $15.00 | |
| Other Repair | $40.00 | $40.00 | $40.00 | $40.00 | $40.00 | $40.00 | $40.00 | $40.00 | $40.00 | $40.00 | $40.00 | $40.00 | |
| Vending Machines, etc. | $2.50 | $2.50 | $2.50 | $2.50 | $2.50 | $2.50 | $2.50 | $2.50 | $2.50 | $2.50 | $2.50 | $2.50 | |
| Sales | |||||||||||||
| Car Wash | $6,300 | $6,300 | $6,300 | $6,300 | $6,300 | $6,300 | $6,300 | $6,300 | $6,300 | $6,300 | $6,300 | $6,300 | |
| Vacuum Cleaning | $1,260 | $1,260 | $1,260 | $1,260 | $1,260 | $1,260 | $1,260 | $1,260 | $1,260 | $1,260 | $1,260 | $1,260 | |
| Car Paint | $31,500 | $31,500 | $31,500 | $31,500 | $31,500 | $31,500 | $31,500 | $31,500 | $31,500 | $31,500 | $31,500 | $31,500 | |
| Oil Change | $9,450 | $9,450 | $9,450 | $9,450 | $9,450 | $9,450 | $9,450 | $9,450 | $9,450 | $9,450 | $9,450 | $9,450 | |
| Other Repair | $25,200 | $25,200 | $25,200 | $25,200 | $25,200 | $25,200 | $25,200 | $25,200 | $25,200 | $25,200 | $25,200 | $25,200 | |
| Vending Machines, etc. | $300 | $300 | $300 | $300 | $300 | $300 | $300 | $300 | $300 | $300 | $300 | $300 | |
| Total Sales | $74,010 | $74,010 | $74,010 | $74,010 | $74,010 | $74,010 | $74,010 | $74,010 | $74,010 | $74,010 | $74,010 | $74,010 | |
| Direct Unit Costs | Month 1 | Month 2 | Month 3 | Month 4 | Month 5 | Month 6 | Month 7 | Month 8 | Month 9 | Month 10 | Month 11 | Month 12 | |
| Car Wash | 0.00% | $2.13 | $2.13 | $2.13 | $2.13 | $2.13 | $2.13 | $2.13 | $2.13 | $2.13 | $2.13 | $2.13 | $2.13 |
| Vacuum Cleaning | 0.00% | $0.43 | $0.43 | $0.43 | $0.43 | $0.43 | $0.43 | $0.43 | $0.43 | $0.43 | $0.43 | $0.43 | $0.43 |
| Car Paint | 0.00% | $1.13 | $1.13 | $1.13 | $1.13 | $1.13 | $1.13 | $1.13 | $1.13 | $1.13 | $1.13 | $1.13 | $1.13 |
| Oil Change | 0.00% | $0.38 | $0.38 | $0.38 | $0.38 | $0.38 | $0.38 | $0.38 | $0.38 | $0.38 | $0.38 | $0.38 | $0.38 |
| Other Repair | 0.00% | $0.85 | $0.85 | $0.85 | $0.85 | $0.85 | $0.85 | $0.85 | $0.85 | $0.85 | $0.85 | $0.85 | $0.85 |
| Vending Machines, etc. | 0.00% | $1.06 | $1.06 | $1.06 | $1.06 | $1.06 | $1.06 | $1.06 | $1.06 | $1.06 | $1.06 | $1.06 | $1.06 |
| Direct Cost of Sales | |||||||||||||
| Car Wash | $2,678 | $2,678 | $2,678 | $2,678 | $2,678 | $2,678 | $2,678 | $2,678 | $2,678 | $2,678 | $2,678 | $2,678 | |
| Vacuum Cleaning | $536 | $536 | $536 | $536 | $536 | $536 | $536 | $536 | $536 | $536 | $536 | $536 | |
| Car Paint | $709 | $709 | $709 | $709 | $709 | $709 | $709 | $709 | $709 | $709 | $709 | $709 | |
| Oil Change | $236 | $236 | $236 | $236 | $236 | $236 | $236 | $236 | $236 | $236 | $236 | $236 | |
| Other Repair | $536 | $536 | $536 | $536 | $536 | $536 | $536 | $536 | $536 | $536 | $536 | $536 | |
| Vending Machines, etc. | $128 | $128 | $128 | $128 | $128 | $128 | $128 | $128 | $128 | $128 | $128 | $128 | |
| Subtotal Direct Cost of Sales | $4,821 | $4,821 | $4,821 | $4,821 | $4,821 | $4,821 | $4,821 | $4,821 | $4,821 | $4,821 | $4,821 | $4,821 | |
| Personnel Plan | |||||||||||||
| Month 1 | Month 2 | Month 3 | Month 4 | Month 5 | Month 6 | Month 7 | Month 8 | Month 9 | Month 10 | Month 11 | Month 12 | ||
| General Manager | 0% | $3,333 | $3,333 | $3,333 | $3,333 | $3,333 | $3,333 | $3,333 | $3,333 | $3,333 | $3,333 | $3,333 | $3,333 |
| Mechanics | 0% | $12,124 | $12,124 | $12,124 | $12,124 | $12,124 | $12,124 | $12,124 | $12,124 | $12,124 | $12,124 | $12,124 | $12,124 |
| Administrative | 0% | $3,395 | $3,395 | $3,395 | $3,395 | $3,395 | $3,395 | $3,395 | $3,395 | $3,395 | $3,395 | $3,395 | $3,395 |
| Total People | 7 | 7 | 7 | 7 | 7 | 7 | 7 | 7 | 7 | 7 | 7 | 7 | |
| Total Payroll | $18,852 | $18,852 | $18,852 | $18,852 | $18,852 | $18,852 | $18,852 | $18,852 | $18,852 | $18,852 | $18,852 | $18,852 | |
| General Assumptions | |||||||||||||
| Month 1 | Month 2 | Month 3 | Month 4 | Month 5 | Month 6 | Month 7 | Month 8 | Month 9 | Month 10 | Month 11 | Month 12 | ||
| Plan Month | 1 | 2 | 3 | 4 | 5 | 6 | 7 | 8 | 9 | 10 | 11 | 12 | |
| Current Interest Rate | 8.00% | 8.00% | 8.00% | 8.00% | 8.00% | 8.00% | 8.00% | 8.00% | 8.00% | 8.00% | 8.00% | 8.00% | |
| Long-term Interest Rate | 8.00% | 8.00% | 8.00% | 8.00% | 8.00% | 8.00% | 8.00% | 8.00% | 8.00% | 8.00% | 8.00% | 8.00% | |
| Tax Rate | 30.00% | 40.00% | 40.00% | 40.00% | 40.00% | 40.00% | 40.00% | 40.00% | 40.00% | 40.00% | 40.00% | 40.00% | |
| Other | 0 | 0 | 0 | 0 | 0 | 0 | 0 | 0 | 0 | 0 | 0 | 0 | |


