
Southeast Racing
Executive Summary
Southeast Racing Parts (SRP) is a small, North Carolina-based automobile racing parts brick and mortar and mail order organization. SRP will remain small in order to offer unprecedented customer attention. Southeast Racing Parts will become the premier destination for entry level and novice racing parts.
The Market
Southeast Racing Parts will be participating in an exciting, growing market. Motorsports has seen explosive growth in the USA in the last decade. It is now the fastest-growing sport in the USA. The market is worth $1.5 billion annually. A recent survey indicates that over 385,000 people have competed in organized motorsport events with even more people who have “souped” up their cars but have yet to compete in organized events. Additionally, TV coverage for motorsports has increased dramatically helping fuel growth. Lastly, the Carolinas has experienced record population growth, 25% within the last decade making SRP’s chosen location attractive.
The Organization
Southeast Racing Parts is founded on the idea that maintaining satisfied customers is essential to the financial health of the organization. With this in mind, SRP will be working hard to ensure that all of their customer’s expectations are exceeded in all transactions. To maintain a presence within the racing community and close relationships to customers, Southeast Racing Parts will be an active member of the local racing scene through participation and sponsorship.
Products, Services, and Delivery
SRP will be both a brick and mortar company serving the local community as well as offering a catalog with a mail order service. The catalog will be a four-color edition and subsequent editions will be analyzed to determine the cost effectiveness of publishing in this format. SRP will offer engine and chassis parts for a wide variety of cars. Safety equipment and set up equipment will also be offered. All of the popular name brands will be offered in addition to an array of generic label parts. SRP will offer coil rating services as well as scaling services for race cars.
Financials
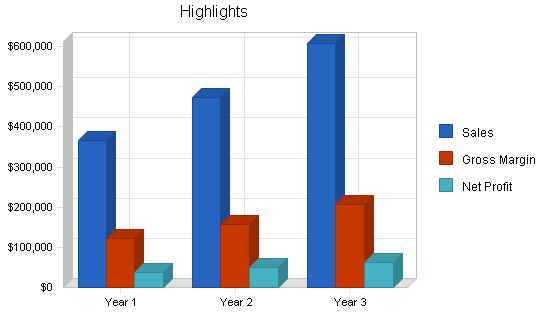
Southeast Racing Parts will be profitable from month one. Margins are forecasted to be respectable. Year one sales will be exceptional with a steady growth rate for the first five years.
Southeast Racing Parts is an exciting opportunity that combines a customer-centric organization with an explosive industry. Motorsports is becoming increasingly popular in the United States with more and more people becoming active participants. Even for those who are not true participants, it is now “cool” to have your car “tweaked out” even just for aesthetics. An investment in Southeast Racing Parts is a high growth, reasonable risk opportunity.
1.1 Objectives
- To make Southeast Racing Parts the number one destination for the purchase of entry-level/novice racing supplies in the Carolinas.
- To achieve a modest initial gross profit margin, increasing that by at least 1% per year until reaching our final target.
- To sell a substantial amount of product the first year.
- To maintain a solid growth rate per year for the first five years.
1.2 Mission
Southeast Racing Parts is dedicated to providing racing products that combine quality performance with value pricing. We wish to establish a successful partnership with our customers, our employees, and our suppliers that respects the interests and goals of each party.
Constantly striving to supply what the consumer is asking for, we will continually review what is available in the marketplace, and what isn’t. Improving on what is available and providing new products and services to the areas of need will help ensure our success in a market driven by consumer demand.
Success will ultimately be measured by our customers choosing us because of their belief in our ability to meet or exceed their expectations of price, service, and selection.
1.3 Keys to Success
To succeed in this business, we must:
- Be an active member of the racing community; i.e., attend functions at local race tracks, attend regional and national trade shows.
- Deliver our products promptly.
- Work with our customers on a personal level, as opposed to the “What’s your customer number?” mentality of large mail order firms.
Company Summary
Southeast Racing Parts is a new company, which upon commencement of operations will provide entry-level oval track racers with affordable products and quality service.
2.1 Company Ownership
Southeast Racing Parts is a North Carolina corporation, subchapter S, owned entirely by Tim and Molly Jones.
2.2 Start-up Summary
Our start-up costs are listed on the following page. Major costs include computer hardware, software and setup support; rent, a telephone system, approximately office equipment and furniture, parts shelving and other warehouse equipment, leasehold improvements, and a company pick-up truck.
The company will start out with about three months’ inventory on hand. This means the majority of company assets will consist of inventory and the starting cash balance will not be significant.
You will find that we will need additional funding. The purpose of this plan is to secure financing for that amount.
Later in this plan, when you view the Projected Balance Sheet, Projected Cash Flow and the Projected Profit and Loss, you will notice that we do not show any debt or interest expense. However, by examining these same charts, you will see that we project a sufficient amount of earnings to service a debt load.
Upon negotiations of debt amount and terms, modified charts will be provided upon request.

| Start-up | |
| Requirements | |
| Start-up Expenses | |
| Decals | $725 |
| Rent | $1,600 |
| Stationery, forms, etc. | $300 |
| Total Start-up Expenses | $2,625 |
| Start-up Assets | |
| Cash Required | $1,000 |
| Start-up Inventory | $50,000 |
| Other Current Assets | $0 |
| Long-term Assets | $29,000 |
| Total Assets | $80,000 |
| Total Requirements | $82,625 |
| Start-up Funding | |
| Start-up Expenses to Fund | $2,625 |
| Start-up Assets to Fund | $80,000 |
| Total Funding Required | $82,625 |
| Assets | |
| Non-cash Assets from Start-up | $79,000 |
| Cash Requirements from Start-up | $1,000 |
| Additional Cash Raised | $0 |
| Cash Balance on Starting Date | $1,000 |
| Total Assets | $80,000 |
| Liabilities and Capital | |
| Liabilities | |
| Current Borrowing | $0 |
| Long-term Liabilities | $0 |
| Accounts Payable (Outstanding Bills) | $2,000 |
| Other Current Liabilities (interest-free) | $0 |
| Total Liabilities | $2,000 |
| Capital | |
| Planned Investment | |
| Personal Investment | $80,625 |
| Other | $0 |
| Additional Investment Requirement | $0 |
| Total Planned Investment | $80,625 |
| Loss at Start-up (Start-up Expenses) | ($2,625) |
| Total Capital | $78,000 |
| Total Capital and Liabilities | $80,000 |
| Total Funding | $82,625 |
2.3 Company Locations and Facilities
Southeast Racing Parts will be located at 123 Main Street, Anytown, North Carolina. This location will afford us good visibility along with convenient access for traveling race teams wishing to stop at our location.
Another advantage of this location is the recent announcement of a go-kart/entertainment complex, which will be located directly across the street. This complex will attract many potential customers to our immediate vicinity.
By locating in close proximity to Charlotte, Southeast Racing Parts will enjoy a large built-in customer base. The skyrocketing popularity of NASCAR Winston Cup racing in the last 15 years has only strengthened its role as the hub for most race teams and all the related businesses they’ve spawned.
The sport’s explosion has been so boundless that University of North Carolina-Charlotte researchers conducted a study of the industry to try to determine its impact. The study, completed in December 1996, found that in its surrounding counties, NASCAR racing is responsible for about 2,000 jobs producing more than $200 million in expenditures annually — figures that many in the industry consider conservative in 1998. Many of the people employed within the industry along with their children, other relatives, and friends, take up racing as a hobby.
Another benefit of the area is that it is centrally located on the East Coast. The Carolinas and parts of Virginia and Georgia will have the benefit of overnight UPS ground service. A large portion of the East Coast and Southeastern United States would be serviced in two days by UPS ground service.

The Facility
We will initially be leasing 3,000 sq. ft. of a new 10,000 sq. ft. building. As needs dictate, our office and/or warehouse facilities could be expanded into an additional 2,500 sq. ft.
We will be sharing this facility with another business that is also involved in racing, and their business attracts many of the local racers. In light of this, we will meet many potential customers simply because of our association with them.
This location will consist of a showroom, office space, and warehousing. All deliveries and shipments will be serviced at this location. We will also have ample parking available.
Products
Southeast Racing Parts will sell racing products to the entry-level/novice racer. These products will include engine and chassis parts along with safety and set-up equipment. Services that we will provide include coil spring rating, along with a scaling service for race cars.
3.1 Product Description
Southeast Racing Parts will assist its customers in selecting the best parts for their application at a price that meets or exceeds their expectations. In the event of a problem, we will be there to assist and counsel the customer to a speedy solution.
We will carry or have quick access to most major lines of racing equipment. We will also carry generic “plain label” merchandise that we will market under our own performance name. Private labeling will allow us, in most cases, to greatly increase our profit margins since the procurement costs are much lower for these types of items.
Even though our target market is the entry-level racer, our product mix will be sufficient to fill most of the needs of even the most hard-core racer. With leisure time at a premium, our reputation for having needed items in-stock will save our customers both time and money. We will be open Monday through Saturday with hours yet to be determined.
Our experience has shown that most entry-level racers’ preference is for low prices. We believe we can offer products that indeed are lower in price without sacrificing the performance and safety concerns that our customers will demand. Southeast Racing Parts will provide precisely the level of service that today’s entry-level racer requires.
3.2 Competitive Comparison
Within our niche, we only have one significant competitor. They, however, do not carry engine parts, which should give us an edge in that respect.
In general, however, our competition is not in our targeted portion of the market. This competition consists mainly of these three groups:
- NASCAR Winston Cup suppliers.
- Asphalt late model chassis builders.
- National mail order suppliers.
More discussion is included later in this plan on competitive businesses.
3.3 Sales Literature
To drive sales initially, Southeast Racing Parts will utilize an existing supply catalog. This four-color catalog will have a different cover with the Southeast Racing Parts logo, phone number, etc., printed on it.
After much research, we found that the product mix in this catalog most closely resembles the needs of the consumer niche that we are focusing upon. An agreement was reached to supply these catalogs to us at no charge. This precludes the need to invest in catalog production at the outset. In turn, we will be using the catalog company as a supplier for some of the inventory lines that we carry. We have developed a price sheet to be enclosed with each catalog.
We will produce flyers in-house on an as-needed basis. These will primarily be to showcase new products and/or to advertise special sales promotions. The flyers will be distributed in the same fashion as the catalogs.
Following are planned means of catalog distribution:
- Give away in-store.
- Enclose in mail order shipments.
- Personally hand out at area race tracks.
- Distribute at local trade shows and auctions.
- Sell for $3 through local racing newspaper business card advertisements.
- Upon the release of a new catalog, we would need to check into the financial feasibility of utilizing direct mail as a means of bulk distribution.
3.4 Sourcing
This is an area that we feel we will enjoy a distinct advantage over much of our competition. Because of our past work experience in purchasing, we have a vast number of supplier contacts within the racing industry. We have good, long-term, solid relationships with many of these vendors which, in many cases, will allow us to achieve decreased cost-of-goods and/or additional terms. Many of these suppliers have already committed to special deals for us, such as waiving their buy-in requirements, additional payment terms, sales referrals, etc.
We will purchase our inventory from both regional wholesalers and direct from the manufacturers. We will use the regional wholesalers more initially because of their ability to service us faster. This will lower our margins slightly; however, we feel that the upside will be that it will allow us to turn our inventory faster. As our sales volume increases, we will shift our buying patterns away from the wholesalers and purchase more of our inventory direct, which will result in increased profits.
3.5 Technology
All computer hardware and software systems that will be utilized by Southeast Racing Parts have been carefully and diligently evaluated. We will use off-the-shelf, PC-based software for accounting purposes including AR/AP, inventory, purchasing, sales, and returns. We will start out with three workstations and expand upon that as necessary.
Many of the computer systems used in the racing industry today are outmoded and obsolete. The major suppliers are reluctant to change because of the huge capital expense to change over their systems at one time. Hence, they keep going with the old and outdated.
By choosing this software, our training costs will be reduced tremendously. Much of the software used by competitors takes weeks to learn and master. Southeast Racing Parts’s use of this software will enable a basic, computer-literate employee to learn the system in one day.
This system will speed our order entry process, assist us in sales forecasting, and allow us to give a higher level of customer service.
3.6 Future Products
We must remain on top of new products and trends. The most important factor in developing future products is market need. Our understanding of the needs in our market niche is one of our competitive advantages.
As stated earlier, we will have our own private label brand. Not only are profit margins better than name brands, but these accessories will help build name identity and awareness for Southeast Racing Parts when they are used on the race track. As our sales volume increases, this will be an area that we can expand.
Another natural area for expansion in the future would be the implementation of a website. On-line commerce is becoming an increasingly attractive option, due to relatively low cost of operation, the global reach of the medium, and the increasing security. Our business model could quite easily expand to include a form of Internet commerce in a variety of racing equipment.
Market Analysis Summary
Currently, the market for racing parts and accessories is rapidly expanding. Performance Racing Industry completed an estimate for total number of racers. The resulting number was 385,000 people who competed in an organized auto race at least once in the past year. The estimate includes all forms of auto racing: drag, stock car, open wheel, modified, sports car, autocross, formula car, tractor pull, and off-road.
Overall it is estimated that the total retail market for hardcore racing products is $1.5 billion annually and it still continues to grow.
The only real threat to our venture would be a similar new entry to the marketplace. This opportunity may best be described as one ready and waiting for the first entrant who arrives with a well-conceived plan, sufficient industry experience, and the required capitalization.
4.1 Market Segmentation
The racing industry is in a boom period. While there are many items from various vendors available, Southeast Racing Parts has approached the market as a specialty retailer — a provider of parts and services to the entry-level racer.
Our target customer in this segment will have a wide range of racing and automotive skills, but our most important target customers are relatively unsophisticated at racing. We will be able to serve this customer well not only by offering them parts at an affordable price, but also by giving them advice that ensures they get the task done correctly, therefore improving their on-track performance.
4.2 Target Market Segment Strategy
Our segment definition is in and of itself strategic. We are not intending to satisfy all users of racing equipment, but rather those who are just starting out and those who are struggling to keep up. We can save our customers time and money, not so much within our pricing structure, but by assessing their needs and directing them toward the proper product. Racers, by nature, tend to desire a high-end product, when often a low to mid-end product will do as good as, or sometimes even a better job. By always dealing in an honest and ethical manner, we will build customer loyalty and word-of-mouth sales that many of our competitors are lacking.
4.2.1 Market Trends
Trends are in our favor. We have identified four major trends that help us:
- Motorsports in general, and circle track racing in particular, have experienced explosive growth in the ’90s. Most experts attribute this growth to greatly expanded television coverage of motorsports events. This coverage exposes many more potential participants to the sport. By focusing on affordable entry-level racing, we feel that Southeast Racing Parts will be filling a niche in the market.
- This area has experienced tremendous population growth in the past decade, approximately 25%. As racing and the local population grow hand-in-hand, it should make many more potential customers available to us.
- There are a lot of fathers dreaming their son will be the next Jeff Gordon. In fact, there are tens of thousands of serious young kart racers who have chosen this sport over baseball, football, or basketball. They’ll be the ones that fill the fields in the next decade.
- Finally, there is the aging Baby Boomer generation. Many have discharged their duties to their children, who have grown and moved on, and now there is money and time again. They turn to something they always wanted to do, or return to the sport they loved, and they go racing.
4.2.2 Market Needs
Since our target market is the entry-level racer, the most important needs are service, price, and availability, in that order. One of the key points of our strategy is to focus on target segments that know and understand these needs and are willing for us to fulfill those needs.
4.3 Industry Analysis
With expanded television coverage and an enormous base of grassroots motorsports activity, auto racing is a thriving industry, as well as the fastest growing sport in America. As with baseball, it could be argued that auto racing has grown to such popularity because of its vital grassroots foundation. Our customers will be the Little Leagues and softball leagues of auto racing. Outsiders to the racing industry must understand that racers may be the most obsessive consumers of any industry. Because of the pressure to win, they avidly purchase new technology. In most race cars, several parts will become obsolete in the course of a season, even though they function perfectly well.
Racers are hard on their investment, too. New tires might be a weekly purchase, and several engine freshening expenditures might be called for in a season. A good whack at the outside wall, and a racing retailer has a customer or two for shocks, a-arms, fasteners, hubs, and more.
Racers spend what it takes to win; they are not out merely to enjoy the ride. Any person who has spent any time at all in the racing pit has heard the guy in front of him in the snack bar line describe how he postponed a key household expense–the telephone bill or a new household appliance–to purchase a new right rear tire, or other critical racing part.
To service this sport, there are thousands of small businesses across the country skilled in the ways of horsepower and hooking it to the ground. Whether they make their money from parts or services, retailing or building engines, these businesses make it an easy and convenient matter to go racing. Without these local ambassadors of speed, it is hard to imagine the existence of auto racing in a large scale.
4.3.1 Distribution Patterns
Generally, traditional distribution channels are followed. The products are bought from distributors and/or direct from the manufacturers, who have little say in how products are marketed. As in most industries, price levels decrease as volume increases.
4.3.2 Competition and Buying Patterns
We feel that racers understand the concept of service and availability, and are much more likely to pay for it when the offering is clearly stated.
There is no doubt that we will compete much more against the large mail order outfits than against any small local suppliers. We have good indications that racers/customers would rather pay 5-15% more for a long-term relationship with a vendor providing quality service and support. To this point, the racer thinks about price because that’s what he sees emphasized by the mail order companies.
Availability is of utmost importance. The buyer tends to want immediate, local solutions to their problems and/or needs.
By positioning ourselves at the lower end of the market, we will present ourselves to consumers just getting into racing, and we will sell to a base of customers that we can grow with together.
4.3.3 Main Competitors
- (omitted to protect confidentiality)
The above are all targeted towards the professional (NASCAR Winston Cup, etc.) market. They carry a totally different product mix to service that market. Their prices are high, and their interest in selling to the entry-level market is basically nonexistent.
- (omitted to protect confidentiality)
These are both late model chassis builders not targeting the entry-level market. Basically, they stock inventory that’s used just on their own cars. They are both located in the Anytown Motorsports Center business park which is in an out-of-the-way, hard to find location.
- (omitted to protect confidentiality)
They are a large drag racing mail order firm that is skimming the circle track gravy. Since Southeast Racing Parts will cater to the circle track market, we believe that whatever local circle track customers they have will switch suppliers. We will have more knowledge and experience to suit their needs.
- (omitted to protect confidentiality)
These are the mega mail order firms. Customers seem to use them only for price, and because of a lack of local suppliers. We can offer faster delivery times, along with knowledge and experience in their type of racing. We believe a small share of their circle track market would be obtainable. These companies do not enjoy a loyal circle track customer base.
- (omitted to protect confidentiality)
As implied in their name, they sell used parts, so in most cases they’re not usable for our target market. They also sell a limited amount of new parts; however, because of their name, most people are not aware of this. Also, they are located in an area which was described earlier as a poor location.
- (omitted to protect confidentiality)
They are the only local competitor that we could identify that was targeting our niche. Following are what we feel are some of our competitive advantages: We feel that we are in a much better location. They utilize a black and white flyer as their main sales tool, and we will have a professional four-color catalog. Also, they concentrate mainly on chassis and safety equipment, where we will also offer a full array of engine parts.
4.3.4 Industry Participants
We are part of the Performance Racing Industry, which includes several kinds of businesses.
Speed Shops: Most of these are small, sometimes part-time ventures run from the individual’s home. Sometimes they will service a local race track; however, they usually carry a very minimal amount of inventory, and are usually operated by a racer or an ex-racer depending solely upon a small circle of friends or acquaintances as customers. They normally are short on business and marketing skills.
Engine & Chassis Builders: Typically these are well-respected firms supplying engines and chassis to the racing industry. Their customer profile lies in the mid to upper end of the market. They offer superb technical support; however, it is only available to customers utilizing their engine or chassis. They stock parts to service their engine or chassis, but are usually limited in areas areas beyond that. Normally their pricing structure is slightly above average.
Mail Order: The racing industry is served increasingly by large mail order firms that offer aggressive pricing on racing components. They are usually impersonal, and have little or no technical support available. For the purely price-driven buyer who purchases parts and expects no support, these firms offer a good option.
Others: There are many other channels through which people buy their racing parts, usually variations of the main three types above.
Strategy and Implementation Summary
Our strategy is based on serving the niche of entry-level racers well. This area is full of small race teams that can’t get products or services from the major vendors who focus only on professional race teams. Also:
- What begins as a customized version of a standard product, tailored to the needs of local racers, can eventually become a niche product that will fill the needs of similar racers across the country.
- We are planning our marketing strategy so that we can eventually reach specific kinds of racers across broad geographic lines.
- We focus on satisfying the needs of entry-level race teams.
- We focus on follow-on technology that we can take to the masses, as opposed to leading edge technology that aims at the professional race teams.
5.1 Marketing Strategy
The retail marketing strategy of Southeast Racing Parts centers on creating a corporate identity that clearly defines our market niche in terms that benefit our customer. Other specific strategies that will be used follow:
- Print Ads – Keeping the Southeast Racing Parts name in front of the customer while getting established will be necessary. We plan on running limited space ads in the local racing newspapers to keep our name and phone number in front of the consumer. We may attempt to showcase a single product in an effort to return revenue from the ad. Our past experience has been that showing measurable revenue from these types of ads is difficult. In the future we plan on utilizing Stock Car Racing magazine and Circle Track magazine (both national magazines) as a method of increasing our sales revenue.
- Press Releases – The local racing papers: The Racing News, Late Model Digest, Dirt Late Model Digest, and The Pit List have offered to run releases and/or stories concerning the opening of Southeast Racing Parts. Stock Car Racing magazine has also extended us the same offer. We will also use the above media to run new product releases.
- Race Car Sponsorship – Entry-level racers can be persuaded into running the Southeast Racing Parts logo on their race car in exchange for a token discount on purchases and/or for receiving technical support.
- Decals – We will have decals manufactured with the Southeast Racing Parts logo. We will include the decals with all of the orders that we ship. Entry-level racers in particular enjoy displaying decals on their race cars, haulers, tool boxes, etc.
- Apparel – We know several people in the area who produce NASCAR apparel. A line of premium Southeast Racing Parts apparel could be designed and produced in very short runs to reduce inventory costs. These can be sold or given away with qualifying purchases to further expose the Southeast Racing Parts name.
- Grand Opening – A Grand Opening is the most successful of any in-store promotions. With manufacturer support, a large number of door prizes can be given away while instantly building a mailing list. Loss leader pricing on a few high volume consumable products will attract in-store traffic. Vendors will subsidize loss leader pricing with a rebate or kickback. Appearances by local racing celebrities would also expose potential customers to Southeast Racing Parts.
- Trade Shows – We will exhibit at approximately four local trade shows annually. Revenue that we produce at the shows will outweigh our expenses for attending.
- Word of Mouth – By giving first-time customers great service and a fair price, the word is sure to spread. Also, the many industry and racer contacts that we already have in the area will prove to be most beneficial in spreading the word.
All marketing decisions with regard to specific media choices, frequency, size, and expenditures will be conducted on an on-going basis with careful considerations of returns generated.
5.1.1 Promotion Strategy
Our most important vehicle for sales promotion will be our catalog, which is discussed earlier in this plan.
5.1.2 Distribution Strategy
Our customers will buy our products at our location. However, we anticipate a significant amount of mail order sales in order to meet or exceed our Sales Forecast. We will receive orders by mail, phone, or fax, process them immediately, and ship the goods via United Parcel Service.
In the event we are out of an item or we don’t stock it, many of our vendors have offered drop shipping as a service to us. This will allow us to keep our service at a high level, yet let us keep our inventory levels in check.
In the future, electronic commerce with a secure website will be thoroughly investigated for feasibility.
5.1.3 Pricing Strategy
Our customers are especially sensitive to value. We must ensure that our price and service are perceived to be a good value to the racers. However, in the nearly thirty years of experience that we have accumulated in the racing industry, one message rings true: someone can always beat you on price.
Therefore, our pricing strategy is to be competitive within the various product categories, but not to rely on the selling price to overshadow the other advantages of doing business with our company. We will sell ourselves on the basis of a diverse line of quality products, that are readily available, reasonably priced, and backed up by our extraordinary customer service. The products will be checked prior to shipment and all promised shipping dates will be met.
We will strive for a modest gross profit margin, increasing that steadily by year four.
5.2 Sales Strategy
Because Southeast Racing Parts is a new entity, we understand that we will have to prove our company’s worth to racers in order to earn their respect and business.
Most importantly, we need to sell our company, not necessarily the products. We will need to push our service and support capabilities.
5.2.1 Sales Forecast
The following table and related charts show our present sales forecast. We are projecting sales to grow at steadily for the next three years.
Our seasonality, as shown in the chart, is a factor in the racing industry. We will tend to sell much better in the period January through June, while sales trail off in late summer and fall.
Management feels these forecasts are highly attainable.
When Performance Racing Industry completed its annual survey, the resulting figure for total number of racers was 385,000. Within the survey they also found that 150,000 of those were oval track racers. The survey also showed $1.5 billion in annual retail sales for all segments, with 48% of that total ($720 million) derived from the oval track segment.
By dividing that number ($720 million) by the number of oval track racers (150,000), the average annual retail purchases of oval track racers equals $4,800. From our past experience, we believe that each customer we have would spend on average 25% of that figure ($1,200) with our company. Finally, by dividing our first year sales forecast ($350,000) by $1,200 (average annual customer purchases), it shows that we will need 292 customers to support the sales forecast numbers. We believe, by and large, that these are realistic and attainable numbers.


| Sales Forecast | |||
| Year 1 | Year 2 | Year 3 | |
| Sales | |||
| Inventory Sales | $350,219 | $455,285 | $591,870 |
| Internet Marketing | $16,800 | $16,800 | $16,800 |
| Total Sales | $367,019 | $472,085 | $608,670 |
| Direct Cost of Sales | Year 1 | Year 2 | Year 3 |
| Inventory | $245,154 | $314,147 | $402,472 |
| Internet Marketing | $0 | $0 | $0 |
| Subtotal Direct Cost of Sales | $245,154 | $314,147 | $402,472 |
5.3 Strategic Alliances
We have the ability to build strong strategic alliances with many of our suppliers, some of which are listed below.
- (omitted to protect confidentiality). They will set us up as a Warehouse Distributor (W.D.) without the buy-in requirement.
- (omitted to protect confidentiality). They will do “whatever they can” to help us succeed. Possibly supply us with a show car to display in our showroom.
- (omitted to protect confidentiality). They will set us up as a W.D. without the buy-in requirement.
- (omitted to protect confidentiality). They will set us up as a W.D. and could also be persuaded into extending us special terms.
- (omitted to protect confidentiality). They will set us up as a W.D. and help out as needed with additional terms.
- (omitted to protect confidentiality). They have set us up as a dealer and will drop ship when needed.
- (omitted to protect confidentiality). They will set us up as a W.D. without the buy-in requirement.
- (omitted to protect confidentiality). They will work with us by drop shipping direct to our customers and also by acting as a “paper” warehouse so that we may order direct from the manufacturer for a nominal billing fee.
- (omitted to protect confidentiality). Could be persuaded into giving us extended dating on our initial stocking order.
- (omitted to protect confidentiality). They will supply us with used testing equipment at no charge. They have indicated that they would also extend special terms and/or dating on initial stocking order.
- (omitted to protect confidentiality). They will supply us with their 94-page 4-color catalog at no charge.
- (omitted to protect confidentiality). They will set us up as a direct W.D. without the buy-in requirement. Will also assist us in marketing their products in this area.
The following two local warehouses will help us immensely in keeping our own inventory levels in check, while still giving our customers fast service:
- (omitted to protect confidentiality).
- (omitted to protect confidentiality).
Approached properly, these vendors and many others will assist Southeast Racing Parts in becoming a force in the marketplace.
5.4 Milestones
Sample Milestones topic text.
The milestones table and chart show the specific detail about actual program activities that should be taking place during the year. Each one has its manager, starting date, ending date, and budget. During the year we will be keeping track of implementation against plan, with reports on the timely completion of these activities as planned.

| Milestones | |||||
| Milestone | Start Date | End Date | Budget | Manager | Department |
| Sample Milestones | 1/4/2008 | 1/4/2008 | $0 | ABC | Department |
| Finish Business Plan | 5/7/2009 | 6/6/2009 | $100 | Dude | LeGrande Fromage |
| Acquire Financing | 5/17/2009 | 7/6/2009 | $200 | Dudette | Legumers |
| Ah HA! Event | 5/27/2009 | 6/1/2009 | $60 | Marianne | Bosses |
| Oooooh Noooooo! Event | 6/26/2009 | 7/1/2009 | $250 | Marionette | Chèvre deBlâme |
| Grande Opening | 7/6/2009 | 7/11/2009 | $500 | Gloworm | Nobs |
| Marketing Program Starts | 6/6/2009 | 7/1/2009 | $1,000 | Glower | Marketeers |
| Plan vs. Actual Review | 11/1/2009 | 11/8/2009 | $0 | Galore | Alles |
| First Break-even Month | 3/5/2010 | 4/4/2010 | $0 | Bouys | Salers |
| Hire Employees | 2/1/2010 | 3/3/2010 | $150 | Gulls | HRM |
| Upgrade Business Plan Pro | 4/22/2010 | 4/24/2010 | $100 | Brass | Bossies |
| Totals | $2,360 | ||||
Management Summary
We are a small company owned and operated by Tim and Molly Jones, husband and wife, as a Subchapter S corporation.
Tim Jones – President
Tim will be the main salesperson. He will also be responsible for shipping and receiving, inventory management, and the marketing and promotion of products. Tim will assist with record keeping and cost containment.
Molly Jones – Corporate Secretary
Molly will maintain the company records and be in direct communication with the accountant and other advisors. She will also be in charge of the computer system and perform all of the desktop publishing for the company. She will assist as needed with sales, shipping and receiving, and customer service related issues. In addition to her regular duties, Molly will be doing Internet marketing from her office at Southeast Racing Parts. We anticipate that 20 hours every week will be dedicated to this marketing. The revenue that will be generated by this is reflected in the Sales Forecast.
The initial management team depends on the founders themselves, with little back-up. We plan on hiring additional personnel as the need for them arises, and as we have the ability to pay them.
6.1 Management Team
Tim and Molly not only have the desire to succeed, but will bring a wealth of knowledge and experience to the Southeast Racing Parts team. They have nearly thirty years of combined experience in the racing industry and have both performed nearly all facets of daily operations for a racing business. Following is a synopsis of their abilities and accomplishments:
Tim Jones (40) – President
(background omitted to protect confidentiality)
Molly Jones (29) – Corporate Secretary
(background omitted to protect confidentiality)
6.2 Management Team Gaps
We depend on professionals, particularly our CPA, for some key management help. We have retained a local CPA to help us with financial and business management questions since we don’t have a strong background in those areas. Also, we are short on experience concerning human resource issues; however, we plan on utilizing our network of business associates to advise us when the need arises.
6.3 Personnel Plan
The cornerstone of the personnel plan is to maximize productivity and minimize the labor burden on the company’s operating expenses. As we grow, we expect to see steady increases in our personnel to match the increases in sales.
| Personnel Plan | |||
| Year 1 | Year 2 | Year 3 | |
| Tim Jones | $16,800 | $20,160 | $24,192 |
| Molly Jones | $9,600 | $11,520 | $13,824 |
| Salesperson (PT) | $0 | $8,000 | $8,000 |
| Salesperson (FT) | $0 | $0 | $20,000 |
| Total People | 2 | 3 | 4 |
| Total Payroll | $26,400 | $39,680 | $66,016 |
Financial Plan
We are a small company owned and operated by Tim and Molly Jones, husband and wife, as a Subchapter S corporation.
Tim Jones – President
Tim will be the main salesperson. He will also be responsible for shipping and receiving, inventory management, and the marketing and promotion of products. Tim will assist with record keeping and cost containment.
Molly Jones – Corporate Secretary
Molly will maintain the company records and be in direct communication with the accountant and other advisors. She will also be in charge of the computer system and perform all of the desktop publishing for the company. She will assist as needed with sales, shipping and receiving, and customer service related issues. In addition to her regular duties, Molly will be doing Internet marketing from her office at Southeast Racing Parts. We anticipate that 20 hours every week will be dedicated to this marketing. The revenue that will be generated by this is reflected in the Sales Forecast.
The initial management team depends on the founders themselves, with little back-up. We plan on hiring additional personnel as the need for them arises, and as we have the ability to pay them.
6.1 Management Team
Tim and Molly not only have the desire to succeed, but will bring a wealth of knowledge and experience to the Southeast Racing Parts team. They have nearly thirty years of combined experience in the racing industry and have both performed nearly all facets of daily operations for a racing business. Following is a synopsis of their abilities and accomplishments:
Tim Jones (40) – President
(background omitted to protect confidentiality)
Molly Jones (29) – Corporate Secretary
(background omitted to protect confidentiality)
6.2 Management Team Gaps
We depend on professionals, particularly our CPA, for some key management help. We have retained a local CPA to help us with financial and business management questions since we don’t have a strong background in those areas. Also, we are short on experience concerning human resource issues; however, we plan on utilizing our network of business associates to advise us when the need arises.
6.3 Personnel Plan
The cornerstone of the personnel plan is to maximize productivity and minimize the labor burden on the company’s operating expenses. As we grow, we expect to see steady increases in our personnel to match the increases in sales.
| Personnel Plan | |||
| Year 1 | Year 2 | Year 3 | |
| Tim Jones | $16,800 | $20,160 | $24,192 |
| Molly Jones | $9,600 | $11,520 | $13,824 |
| Salesperson (PT) | $0 | $8,000 | $8,000 |
| Salesperson (FT) | $0 | $0 | $20,000 |
| Total People | 2 | 3 | 4 |
| Total Payroll | $26,400 | $39,680 | $66,016 |
Appendix
| Sales Forecast | |||||||||||||
| Month 1 | Month 2 | Month 3 | Month 4 | Month 5 | Month 6 | Month 7 | Month 8 | Month 9 | Month 10 | Month 11 | Month 12 | ||
| Sales | |||||||||||||
| Inventory Sales | 0% | $16,000 | $20,800 | $24,960 | $22,464 | $20,217 | $23,250 | $26,737 | $32,084 | $38,501 | $46,202 | $41,581 | $37,423 |
| Internet Marketing | 0% | $1,400 | $1,400 | $1,400 | $1,400 | $1,400 | $1,400 | $1,400 | $1,400 | $1,400 | $1,400 | $1,400 | $1,400 |
| Total Sales | $17,400 | $22,200 | $26,360 | $23,864 | $21,617 | $24,650 | $28,137 | $33,484 | $39,901 | $47,602 | $42,981 | $38,823 | |
| Direct Cost of Sales | Month 1 | Month 2 | Month 3 | Month 4 | Month 5 | Month 6 | Month 7 | Month 8 | Month 9 | Month 10 | Month 11 | Month 12 | |
| Inventory | $11,200 | $14,560 | $17,472 | $15,725 | $14,152 | $16,275 | $18,716 | $22,459 | $26,951 | $32,341 | $29,107 | $26,196 | |
| Internet Marketing | $0 | $0 | $0 | $0 | $0 | $0 | $0 | $0 | $0 | $0 | $0 | $0 | |
| Subtotal Direct Cost of Sales | $11,200 | $14,560 | $17,472 | $15,725 | $14,152 | $16,275 | $18,716 | $22,459 | $26,951 | $32,341 | $29,107 | $26,196 | |
| Personnel Plan | |||||||||||||
| Month 1 | Month 2 | Month 3 | Month 4 | Month 5 | Month 6 | Month 7 | Month 8 | Month 9 | Month 10 | Month 11 | Month 12 | ||
| Tim Jones | 0% | $1,400 | $1,400 | $1,400 | $1,400 | $1,400 | $1,400 | $1,400 | $1,400 | $1,400 | $1,400 | $1,400 | $1,400 |
| Molly Jones | 0% | $800 | $800 | $800 | $800 | $800 | $800 | $800 | $800 | $800 | $800 | $800 | $800 |
| Salesperson (PT) | 0% | $0 | $0 | $0 | $0 | $0 | $0 | $0 | $0 | $0 | $0 | $0 | $0 |
| Salesperson (FT) | 0% | $0 | $0 | $0 | $0 | $0 | $0 | $0 | $0 | $0 | $0 | $0 | $0 |
| Total People | 2 | 2 | 2 | 2 | 2 | 2 | 2 | 2 | 2 | 2 | 2 | 2 | |
| Total Payroll | $2,200 | $2,200 | $2,200 | $2,200 | $2,200 | $2,200 | $2,200 | $2,200 | $2,200 | $2,200 | $2,200 | $2,200 | |
| Pro Forma Profit and Loss | |||||||||||||
| Month 1 | Month 2 | Month 3 | Month 4 | Month 5 | Month 6 | Month 7 | Month 8 | Month 9 | Month 10 | Month 11 | Month 12 | ||
| Sales | $17,400 | $22,200 | $26,360 | $23,864 | $21,617 | $24,650 | $28,137 | $33,484 | $39,901 | $47,602 | $42,981 | $38,823 | |
| Direct Cost of Sales | $11,200 | $14,560 | $17,472 | $15,725 | $14,152 | $16,275 | $18,716 | $22,459 | $26,951 | $32,341 | $29,107 | $26,196 | |
| Other Costs of Sales | $0 | $0 | $0 | $0 | $0 | $0 | $0 | $0 | $0 | $0 | $0 | $0 | |
| Total Cost of Sales | $11,200 | $14,560 | $17,472 | $15,725 | $14,152 | $16,275 | $18,716 | $22,459 | $26,951 | $32,341 | $29,107 | $26,196 | |
| Gross Margin | $6,200 | $7,640 | $8,888 | $8,139 | $7,465 | $8,375 | $9,421 | $11,025 | $12,950 | $15,261 | $13,874 | $12,627 | |
| Gross Margin % | 35.63% | 34.41% | 33.72% | 34.11% | 34.53% | 33.98% | 33.48% | 32.93% | 32.46% | 32.06% | 32.28% | 32.52% | |
| Expenses | |||||||||||||
| Payroll | $2,200 | $2,200 | $2,200 | $2,200 | $2,200 | $2,200 | $2,200 | $2,200 | $2,200 | $2,200 | $2,200 | $2,200 | |
| Marketing/Promotion | $150 | $150 | $150 | $150 | $150 | $150 | $150 | $150 | $150 | $150 | $150 | $150 | |
| Depreciation | $345 | $345 | $345 | $345 | $345 | $345 | $345 | $345 | $345 | $345 | $345 | $345 | |
| Vehicle Expense | $150 | $150 | $150 | $125 | $125 | $125 | $125 | $150 | $150 | $150 | $150 | $150 | |
| Credit Card Surcharge | $160 | $208 | $249 | $224 | $202 | $232 | $267 | $320 | $385 | $462 | $415 | $374 | |
| Inbound Freight Charges | $224 | $350 | $350 | $314 | $284 | $326 | $374 | $450 | $540 | $646 | $582 | $524 | |
| Office Supplies | $50 | $50 | $50 | $50 | $50 | $50 | $50 | $50 | $50 | $50 | $50 | $50 | |
| Security/alarm | $30 | $30 | $30 | $30 | $30 | $30 | $30 | $30 | $30 | $30 | $30 | $30 | |
| Telephone | $150 | $156 | $187 | $168 | $150 | $174 | $200 | $240 | $288 | $346 | $311 | $280 | |
| Accounting Costs | $125 | $125 | $125 | $125 | $125 | $125 | $125 | $125 | $125 | $125 | $125 | $125 | |
| Rent | $1,600 | $1,600 | $1,600 | $1,600 | $1,600 | $1,600 | $1,600 | $1,600 | $1,600 | $1,600 | $1,600 | $1,600 | |
| Utilities | $200 | $200 | $200 | $200 | $200 | $200 | $200 | $200 | $200 | $200 | $200 | $200 | |
| Insurance | $70 | $70 | $70 | $70 | $70 | $70 | $70 | $70 | $70 | $70 | $70 | $70 | |
| Payroll Taxes | 15% | $0 | $0 | $0 | $0 | $0 | $0 | $0 | $0 | $0 | $0 | $0 | $0 |
| Other | $0 | $0 | $0 | $0 | $0 | $0 | $0 | $0 | $0 | $0 | $0 | $0 | |
| Total Operating Expenses | $5,454 | $5,634 | $5,706 | $5,601 | $5,531 | $5,627 | $5,736 | $5,930 | $6,133 | $6,374 | $6,228 | $6,098 | |
| Profit Before Interest and Taxes | $746 | $2,006 | $3,182 | $2,538 | $1,934 | $2,748 | $3,685 | $5,095 | $6,817 | $8,887 | $7,646 | $6,529 | |
| EBITDA | $1,091 | $2,351 | $3,527 | $2,883 | $2,279 | $3,093 | $4,030 | $5,440 | $7,162 | $9,232 | $7,991 | $6,874 | |
| Interest Expense | $0 | $0 | $0 | $0 | $0 | $0 | $0 | $0 | $0 | $0 | $0 | $0 | |
| Taxes Incurred | $224 | $602 | $955 | $761 | $580 | $824 | $1,106 | $1,529 | $2,045 | $2,666 | $2,294 | $1,959 | |
| Net Profit | $522 | $1,404 | $2,227 | $1,777 | $1,354 | $1,924 | $2,580 | $3,567 | $4,772 | $6,221 | $5,352 | $4,570 | |
| Net Profit/Sales | 3.00% | 6.33% | 8.45% | 7.44% | 6.26% | 7.80% | 9.17% | 10.65% | 11.96% | 13.07% | 12.45% | 11.77% | |
| Pro Forma Cash Flow | |||||||||||||
| Month 1 | Month 2 | Month 3 | Month 4 | Month 5 | Month 6 | Month 7 | Month 8 | Month 9 | Month 10 | Month 11 | Month 12 | ||
| Cash Received | |||||||||||||
| Cash from Operations | |||||||||||||
| Cash Sales | $17,400 | $22,200 | $26,360 | $23,864 | $21,617 | $24,650 | $28,137 | $33,484 | $39,901 | $47,602 | $42,981 | $38,823 | |
| Subtotal Cash from Operations | $17,400 | $22,200 | $26,360 | $23,864 | $21,617 | $24,650 | $28,137 | $33,484 | $39,901 | $47,602 | $42,981 | $38,823 | |
| Additional Cash Received | |||||||||||||
| Sales Tax, VAT, HST/GST Received | 0.00% | $0 | $0 | $0 | $0 | $0 | $0 | $0 | $0 | $0 | $0 | $0 | $0 |
| New Current Borrowing | $0 | $0 | $0 | $0 | $0 | $0 | $0 | $0 | $0 | $0 | $0 | $0 | |
| New Other Liabilities (interest-free) | $0 | $0 | $0 | $0 | $0 | $0 | $0 | $0 | $0 | $0 | $0 | $0 | |
| New Long-term Liabilities | $0 | $0 | $0 | $0 | $0 | $0 | $0 | $0 | $0 | $0 | $0 | $0 | |
| Sales of Other Current Assets | $0 | $0 | $0 | $0 | $0 | $0 | $0 | $0 | $0 | $0 | $0 | $0 | |
| Sales of Long-term Assets | $0 | $0 | $0 | $0 | $0 | $0 | $0 | $0 | $0 | $0 | $0 | $0 | |
| New Investment Received | $0 | $0 | $0 | $0 | $0 | $0 | $0 | $0 | $0 | $0 | $0 | $0 | |
| Subtotal Cash Received | $17,400 | $22,200 | $26,360 | $23,864 | $21,617 | $24,650 | $28,137 | $33,484 | $39,901 | $47,602 | $42,981 | $38,823 | |
| Expenditures | Month 1 | Month 2 | Month 3 | Month 4 | Month 5 | Month 6 | Month 7 | Month 8 | Month 9 | Month 10 | Month 11 | Month 12 | |
| Expenditures from Operations | |||||||||||||
| Cash Spending | $2,200 | $2,200 | $2,200 | $2,200 | $2,200 | $2,200 | $2,200 | $2,200 | $2,200 | $2,200 | $2,200 | $2,200 | |
| Bill Payments | $2,104 | $3,151 | $4,120 | $16,602 | $17,566 | $16,206 | $22,623 | $25,891 | $31,691 | $37,767 | $44,324 | $31,426 | |
| Subtotal Spent on Operations | $4,304 | $5,351 | $6,320 | $18,802 | $19,766 | $18,406 | $24,823 | $28,091 | $33,891 | $39,967 | $46,524 | $33,626 | |
| Additional Cash Spent | |||||||||||||
| Sales Tax, VAT, HST/GST Paid Out | $0 | $0 | $0 | $0 | $0 | $0 | $0 | $0 | $0 | $0 | $0 | $0 | |
| Principal Repayment of Current Borrowing | $0 | $0 | $0 | $0 | $0 | $0 | $0 | $0 | $0 | $0 | $0 | $0 | |
| Other Liabilities Principal Repayment | $0 | $0 | $0 | $0 | $0 | $0 | $0 | $0 | $0 | $0 | $0 | $0 | |
| Long-term Liabilities Principal Repayment | $0 | $0 | $0 | $0 | $0 | $0 | $0 | $0 | $0 | $0 | $0 | $0 | |
| Purchase Other Current Assets | $0 | $0 | $0 | $0 | $0 | $0 | $0 | $0 | $0 | $0 | $0 | $0 | |
| Purchase Long-term Assets | $0 | $0 | $0 | $0 | $0 | $0 | $0 | $0 | $0 | $0 | $0 | $0 | |
| Dividends | $0 | $0 | $0 | $0 | $0 | $0 | $0 | $0 | $0 | $0 | $0 | $0 | |
| Subtotal Cash Spent | $4,304 | $5,351 | $6,320 | $18,802 | $19,766 | $18,406 | $24,823 | $28,091 | $33,891 | $39,967 | $46,524 | $33,626 | |
| Net Cash Flow | $13,096 | $16,849 | $20,040 | $5,062 | $1,851 | $6,244 | $3,314 | $5,393 | $6,010 | $7,635 | ($3,543) | $5,197 | |
| Cash Balance | $14,096 | $30,944 | $50,984 | $56,046 | $57,897 | $64,141 | $67,456 | $72,849 | $78,859 | $86,494 | $82,952 | $88,149 | |
| Pro Forma Balance Sheet | |||||||||||||
| Month 1 | Month 2 | Month 3 | Month 4 | Month 5 | Month 6 | Month 7 | Month 8 | Month 9 | Month 10 | Month 11 | Month 12 | ||
| Assets | Starting Balances | ||||||||||||
| Current Assets | |||||||||||||
| Cash | $1,000 | $14,096 | $30,944 | $50,984 | $56,046 | $57,897 | $64,141 | $67,456 | $72,849 | $78,859 | $86,494 | $82,952 | $88,149 |
| Inventory | $50,000 | $38,800 | $24,240 | $19,219 | $17,298 | $15,567 | $17,903 | $20,588 | $24,705 | $29,646 | $35,575 | $32,018 | $28,816 |
| Other Current Assets | $0 | $0 | $0 | $0 | $0 | $0 | $0 | $0 | $0 | $0 | $0 | $0 | $0 |
| Total Current Assets | $51,000 | $52,896 | $55,184 | $70,203 | $73,344 | $73,464 | $82,044 | $88,043 | $97,554 | $108,505 | $122,070 | $114,969 | $116,965 |
| Long-term Assets | |||||||||||||
| Long-term Assets | $29,000 | $29,000 | $29,000 | $29,000 | $29,000 | $29,000 | $29,000 | $29,000 | $29,000 | $29,000 | $29,000 | $29,000 | $29,000 |
| Accumulated Depreciation | $0 | $345 | $690 | $1,035 | $1,380 | $1,725 | $2,070 | $2,415 | $2,760 | $3,105 | $3,450 | $3,795 | $4,140 |
| Total Long-term Assets | $29,000 | $28,655 | $28,310 | $27,965 | $27,620 | $27,275 | $26,930 | $26,585 | $26,240 | $25,895 | $25,550 | $25,205 | $24,860 |
| Total Assets | $80,000 | $81,551 | $83,494 | $98,168 | $100,964 | $100,739 | $108,974 | $114,628 | $123,794 | $134,400 | $147,620 | $140,174 | $141,825 |
| Liabilities and Capital | Month 1 | Month 2 | Month 3 | Month 4 | Month 5 | Month 6 | Month 7 | Month 8 | Month 9 | Month 10 | Month 11 | Month 12 | |
| Current Liabilities | |||||||||||||
| Accounts Payable | $2,000 | $3,028 | $3,568 | $16,015 | $17,033 | $15,455 | $21,766 | $24,841 | $30,440 | $36,274 | $43,273 | $30,476 | $27,555 |
| Current Borrowing | $0 | $0 | $0 | $0 | $0 | $0 | $0 | $0 | $0 | $0 | $0 | $0 | $0 |
| Other Current Liabilities | $0 | $0 | $0 | $0 | $0 | $0 | $0 | $0 | $0 | $0 | $0 | $0 | $0 |
| Subtotal Current Liabilities | $2,000 | $3,028 | $3,568 | $16,015 | $17,033 | $15,455 | $21,766 | $24,841 | $30,440 | $36,274 | $43,273 | $30,476 | $27,555 |
| Long-term Liabilities | $0 | $0 | $0 | $0 | $0 | $0 | $0 | $0 | $0 | $0 | $0 | $0 | $0 |
| Total Liabilities | $2,000 | $3,028 | $3,568 | $16,015 | $17,033 | $15,455 | $21,766 | $24,841 | $30,440 | $36,274 | $43,273 | $30,476 | $27,555 |
| Paid-in Capital | $80,625 | $80,625 | $80,625 | $80,625 | $80,625 | $80,625 | $80,625 | $80,625 | $80,625 | $80,625 | $80,625 | $80,625 | $80,625 |
| Retained Earnings | ($2,625) | ($2,625) | ($2,625) | ($2,625) | ($2,625) | ($2,625) | ($2,625) | ($2,625) | ($2,625) | ($2,625) | ($2,625) | ($2,625) | ($2,625) |
| Earnings | $0 | $522 | $1,926 | $4,154 | $5,930 | $7,284 | $9,208 | $11,787 | $15,354 | $20,126 | $26,347 | $31,699 | $36,269 |
| Total Capital | $78,000 | $78,522 | $79,926 | $82,154 | $83,930 | $85,284 | $87,208 | $89,787 | $93,354 | $98,126 | $104,347 | $109,699 | $114,269 |
| Total Liabilities and Capital | $80,000 | $81,551 | $83,494 | $98,168 | $100,964 | $100,739 | $108,974 | $114,628 | $123,794 | $134,400 | $147,620 | $140,174 | $141,825 |
| Net Worth | $78,000 | $78,522 | $79,926 | $82,154 | $83,930 | $85,284 | $87,208 | $89,787 | $93,354 | $98,126 | $104,347 | $109,699 | $114,269 |


