
CollisionSyzygy, Inc.
Executive Summary
CollisionSyzygy, Inc. (CSI) is the premier provider of generic claims outsourcing services performed on a highly technological delivery platform which involves the Internet and various proprietory software systems. CollisionSyzygy successfully brings together an insurance company’s auto damage claim with the body repair shop in an efficient manner that significantly reduces costs for both.
The goal of this business plan is to acquire capital investment so that CollisionSyzygy can escalate its time-proven business strategy and processes to a level that will reach more of the available market. Time is a critical factor. CollisionSyzygy is as much as a year and a half ahead of its competitors in technological developments that create the efficiencies, in collision claims processing, that result in the profits for its clients. The ability to rapidly infuse money into CSI will ensure that its competitors remain in a posture of emulation. It is CollisionSyzygy’s technological advantage, combined with the vast amount of unharvested market potential, that makes it such a phenomenal investment opportunity. In addition, smaller insurance companies will find it impossible to operate profitably without outsourcing collision claims because such companies will not be able to achieve the lower costs that are associated with high volume transactions.
Another key attraction of CollisionSyzygy is that it offers full-spectrum claims processing services, with rapid transaction clearance and both a national and an international marketplace of buyers. Many competitors specialize or limit services due to inadequate technologies; CSI, however, utilizes technology to offer every service available.
CollisionSyzygy is an ongoing company. The company, which has been developing and using its advanced technologies for the past five years, is headed by William Smith, who has 18 years of managerial experience in collision repairs and insurance adjusting.
The company is rapidly building a network of body shop facilities who receive geographic territories in exchange for agreeing to maintain very stringent quality control standards, certifications, and discount pricing, which further enhances the insurance company’s profit margin.
Various proprietory software programs and CollisionSyzygy’s multi-platform reporting capability promise to make CSI a formidable leader in generic services.
The company is currently operating in a profitable position. With the new investment, CollisionSyzygy should be able to achieve (lofty) sales for the 12-month period of Year 1. Profits before income taxes are expected to be (staggering). In just two years, sales should soar, with (sky-high) pre-tax profits. After-tax profits should approximate (breathtaking). The following chart illustrates after-tax profits.
1.1 Keys to Success
- Vast experience of Chief Executive Officer in the industry.
- CollisionSyzygy is the only company in the U.S. to provide generic services to insurance companies. Until now, claims processing had been performed internally by large insurance companies.
- CollisionSyzygy is almost two years ahead of most competitors in the development of the proprietary software necessary to allow insurance carriers to administer their claims processing. Accident Claims Technology (ACT) is CollisionSyzygy’s special software which offers claims management and reporting, making this information available to the insurance company and repair shop. This lead time in software development will make it difficult for competitors to successfully enter the market before CollisionSyzygy has established a significant market position.
- A base of over 100 repair shops comprises CSI’s ever-growing network of repair facilities.
- With ACT software already functional, CollisionSyzygyis just a website away from offering its connectivity between insurance companies and repair shops over the Internet.
- As more repair shops join CSI, business can increase dramatically while also maintaining competitive pricing and a high level of quality for repairs.
- Customer service between the repair shop and the customer is greatly enhanced through the use of other Windows®-based proprietary software that swiftly and accurately creates a cost estimate which allows the repair shop to spend more time with the customer and less time creating estimates. Costing is more reliable for the insurance company because of the database resource. Another software program quickly transmits necessary estimates, photographs, and other claims submission materials to the insurance carrier.
1.2 Mission
CollisionSyzygy, Inc. is the only company in the United States to offer a low-cost, generic solution to the processing, administration, and resolution of auto insurance claims. Through its proprietory, high technology process and software, CollisionSyzygy acts much like a phone conferencing switch, channeling insured’s claims from the insurance company to the appropriate auto repair shop. This process will result in quality, lifetime-warranted repair work for the insured. CSI manages the entire process and provides comprehensive reporting to the insurance carrier. CollisionSyzygy’s mission is to optimize the claims delivery process for each participant in a way uniquely different from its competitors.
The result of CollisionSyzygy’s high technology process is–
An insurance company whose claim:
-
- Is processed in a fraction of the time used in traditional, in-house methods; the claimant receives repair shop location at the time of filing the claim.
- Results in drastically reduced costs to the insurer:
- Thousands of dollars saved on indemnity payments.
- Automatic five percent savings on all repairs by CollisionSyzygy’s member repair facilities.
- Loss adjustment expenses become substantially reduced.
- Administrative expenses reduced.
- Control over cost of repairs.
- Avoids costly auto storage by having rapid claim resolution.
- CollisionSyzygy schedules random, spot quality checks of member shop repairs to ensure quality and necessity of repair. Member repair shops must refund the amount of any repair deemed unnecessary by CollisionSyzygy inspectors.
- Insurance reserves are quickly released for use on other claims, minimizing amount of capital restricted.
- Insurance companies will soon be able to obtain true salvage values (rather than estimates) by selling or receiving bids from prospective buyers before settling the claim, via an upcoming CollisionSyzygy Internet service.
- Allows the insurer to access comprehensive management reports detailing all underwriting, repair and resolution activities.
- Is guaranteed for the life of the repair at all participating CollisionSyzygy repair facilities.
A customer/claimant who:
- Can enjoy lower insurance premiums created by reduced insurance costs.
- Will be amazed at the convenience of rapid resolution of an auto claim.
And member repair shops that:
- Can concentrate resources and time on quality repairs and service, rather than costly marketing efforts.
- Offer a simplified claim estimation process through CollisionSyzygy’s multi-platform software interface. Claim estimates can be accurately created in minutes, allowing more time to service customers.
In short, CollisionSyzygy is utilizing a managed auto body repair process much like the health care industry has attempted to contain costs using the Health Management Organization (HMO) approach. The exception in this analogy, however, is that cost efficiency is achieved by eliminating unnecessary elements of the traditional claims process, rather than by eliminating necessary repair procedures or parts.
Claims processing is only profitable on a large volume basis. This makes it difficult, indeed prohibitive, for smaller insurance companies to run profitable claims operations. The claims processing formula established by CollisionSyzygy will allow smaller insurers to handle claims profitably while also increasing the margins of larger companies.
1.3 Objectives
CollisionSyzygy From June 1, 2000 to May 31, 2001:
- Achieve pre-tax income of (astounding) on revenues of (immense) (splendid%) net income before taxes.
- Capture and control a minimum of ten medium and large insurance company accounts for claims processing market. By the end of Year 2, market share to climb to 60 companies. Full target market currently consists of approximately 2,600 insurance companies.
- Promote name branding of CollisionSyzygy so that a minimum of 220 repair shops become certified members of the company’s program. By the start of Year 3, this number should grow to approximately 2,000 repair shops due to CollisionSyzygy’s implementation of various unique programs and technologies that are not currently available in the marketplace.
- Convert proprietory software platform to an e-commerce website to enhance access to the CollisionSyzygy process by both insurance companies and auto repair shops.
- In conjunction with the site launch, add and support full, online service auction of bids and sales of salvageable automobiles.


Company Summary
CollisionSyzygy is the product of founder and president William Smith. Opening its doors in 1995, CollisionSyzygy began its mission of streamlining claims processing while creating economies of scale that allow small and mid-sized insurance companies to compete with larger companies. Cost containment, improved and timely reporting, swift resolution of the claim process, and quality repair service are all characteristics of the CollisionSyzygy program. CSI’s strategic business partner, Mitchell International, provides software that aids CSI in servicing its repair shops.
2.1 Company Ownership
For the past five years, Mr. Smith has guided CollisionSyzygy, Inc. as its founder, CEO, and sole shareholder. The firm currently has authorized 300,000 shares of common stock, half of which have been issued and are owned by Mr. Smith.
Mr. Smith brings nearly 18 years of claims experience to CollisionSyzygy.
CSI maintains an active strategic business partnership with Mitchell International, another substantial player in the third party administration (TPA) process.
2.2 Company History
CollisionSyzygy opened its doors for business in 1995. Its founder, William Smith, envisioned an independent, generic process that would allow small- and mid-sized insurance companies to “pool” claims so that they could enjoy the cost savings formerly achieved only by their larger counterparts. The larger volume of business created by this pooling of claims gives smaller insurance companies the economies of scale needed to compete with larger companies, such as volume pricing, for the repair shops.
In 1998, CollisionSyzygy formed a strategic business partnership with Mitchell International in order to compliment CSI’s ACT software with ImageMate® and UltraMate® software technologies. UltraMate® is an advanced technology, Windows®-based software program for estimating job costs. ImageMate® is also a Windows®-based program used by automotive collision-repair shops to send images and other estimating data via phone modem and Internet.
The following is a chart and table of past performance for the past two calendar years. Year 1 is an estimate based upon actual first quarter results and projections for the remaining three quarters, assuming that investment capital is employed into operations at the beginning of Year 1.

| Past Performance | |||
| FY 1998 | FY 1999 | FY 2000 | |
| Sales | $333,669 | $274,758 | $1,685,200 |
| Gross Margin | $183,479 | $139,070 | $1,364,458 |
| Gross Margin % | 54.99% | 50.62% | 80.97% |
| Operating Expenses | $84,811 | $94,765 | $1,089,024 |
| Collection Period (days) | 0 | 0 | 0 |
| Balance Sheet | |||
| FY 1998 | FY 1999 | FY 2000 | |
| Current Assets | |||
| Cash | $14,469 | $18,850 | $1,961,328 |
| Accounts Receivable | $0 | $0 | $130,597 |
| Other Current Assets | $0 | $0 | $0 |
| Total Current Assets | $14,469 | $18,850 | $2,091,925 |
| Long-term Assets | |||
| Long-term Assets | $30,043 | $57,791 | $192,291 |
| Accumulated Depreciation | $24,970 | $24,970 | $40,664 |
| Total Long-term Assets | $5,073 | $32,821 | $151,627 |
| Total Assets | $19,542 | $51,671 | $2,243,552 |
| Current Liabilities | |||
| Accounts Payable | $0 | $0 | $71,551 |
| Current Borrowing | $0 | $0 | $0 |
| Other Current Liabilities (interest free) | $0 | $0 | $0 |
| Total Current Liabilities | $0 | $0 | $71,551 |
| Long-term Liabilities | $0 | $0 | $0 |
| Total Liabilities | $0 | $0 | $71,551 |
| Paid-in Capital | ($80,488) | ($92,665) | $1,907,335 |
| Retained Earnings | $34,650 | $100,031 | $144,336 |
| Earnings | $65,380 | $44,305 | $120,330 |
| Total Capital | $19,542 | $51,671 | $2,172,001 |
| Total Capital and Liabilities | $19,542 | $51,671 | $2,243,552 |
| Other Inputs | |||
| Payment Days | 0 | 0 | 0 |
| Sales on Credit | $0 | $0 | $0 |
| Receivables Turnover | 0.00 | 0.00 | 0.00 |
2.3 Company Locations and Facilities
CollisionSyzygy is located in Costa Mesa, California. The company contact is the vice president of Marketing and Administration.
CollisionSyzygy’s strategic business partner, Mitchell International, is headquartered in San Diego, California. Mitchell International also maintains offices in Chicago, Milwaukee, and Toronto. The company is comprised of six operating units: electronic products, publications, business systems, medical, National Auto Glass Specifications (NAGS) and the E. H. Boeckh Company.
Services
CollisionSyzygy offers a comprehensive list of services that supports the insurance claim process and “brokers” this process between the insurance carrier and the repair shop. Through current and developmental technologies, CSI is striving to increase the efficiency of this process in order to “sell more profit” to both the insurer and the repair shop who are experiencing tremendous competition from existing and new entrants to the industry. In addition, CollisionSyzygy can help the smaller insurer take advantage of the economies of scale inherent in large volume claims processing by acting as a pathway in which claims are pooled from numerous sources and handled through the vast services network managed by CSI.
3.1 Summary of Claims Process
Program. In general, our services provide a unique pathway through which insurance companies are directly referred to certified, member repair shops nationwide using our ACT software. Each CollisionSyzygy repair shop must offer the following services to our insurance company clients:
- Free computerized estimates.
- Free digital images.
- Five percent discount on all repairs.
- Free towing within a 15-mile radius.
- Free vehicle storage for up to 30 days.
- Immediate status reports using CSI technology.
Direct Computer Link. CollisionSyzygy’s proprietary software allows insurance company claims staff to:
- Obtain first loss reports.
- Dispatch appraisals, inspections and reinspections.
- Obtain “real time” status of claims progress to permit assessment of average cost and savings of physical damage losses.
- System is dynamic, yet simple to use, so any authorized person or agent with a personal computer and Internet access can monitor the claims process.
Complete Appraisal Process. Vehicle inspections are scheduled within 48 hours of assignment estimates, and vehicle images are electronically transmitted, same day, to the insurance carrier.
Active Reinspection Program
- Random inspection of between 10% and 15% of all vehicles repaired by CollisionSyzygy shops are performed to ensure quality and accuracy of repairs.
- Any non-conforming, overpriced or unnecessary repairs, determined by a CSI inspector, result in a refund back to the insurance company.
Reinspection program results in maximizing savings on physical damage losses.
Internet Salvage Recovery and Bids (Available June, 2000)
- www.salvage.com is an online auction house by which insurance companies can post vehicle photos to receive bids from prospective buyers.
- Insurers can usually obtain bids or sell salvages BEFORE settling the claims process basing offers on real values rather than guesswork.
3.2 Competitive Comparison
CollisionSyzygy is positioning itself to sell “profit” to those insurers who have used the costly, traditional distribution methods involving agents, brokers, and direct writers (working for one company). Offering services that trim claims expenses, “loss adjustment expenses,” and streamline the automotive claim administration process for insurers will directly add profits.
Various competitors have begun their siege for market share in the industry. CCC Information Services, Inc. (CCC) has built its third party administrator (TPA) services around its claims software, boasting a yearly revenue of over $10 million for 1998. Other national competitors include Crawford & Company with $208 million in claim revenues for 1998, Gallagher Bassett Services ($134 million), INSpire Insurance Solutions ($85 million), and Hertz Claim Management ($18 million). With the exception of CCC, none of these competitors have automotive information systems that permit a national network. CollisionSyzygy has already established an operating national network which positions it to uniquely compete with these larger TPA organizations.
Carstation.com has been very successful in attracting investor capital and recently raised $74 million in a venture capital deal to promote and build its business.
3.3 Sales Literature
Body Shops
CollisionSyzygy has primarily used direct-mail pieces targeted at building the repair facility network. The initial mailer offered competition-free territories to body shops who became members of CollisionSyzygy. Body shops have to meet a stringent list of requirements to qualify for membership.
CollisionSyzygy technologies were described so that body shops considering membership could appreciate what the relationship would mean. A one-time membership fee was charged for the territory. A second generation version of the body shop brochure was later introduced. The one-time fee was dramatically decreased and a non-refundable application fee was added. Effectively, the membership fee in the original mailer was cut in half when contrasted with the two fees charged by the newer brochure. The idea was to build the body shop network without reducing the standards or requirements for membership.
Insurance Companies
Informing and attracting insurance companies to CollisionSyzygy’s services has been accomplished primarily with a high quality, spiral bound brochure piece bearing a colorful icon of CollisionSyzygy’s logo. The protocol for this advertising campaign is to mail the brochure to a targeted list of insurance carriers and follow up with individual phone calls to the claims executive.
Miscellaneous and Future Advertising
One successful manner of advertising for CollisionSyzygy has been its media press releases and client testimonials. An article in Hammer and Dolly magazine, April 1998, described the company’s process at length.
A press release in June 1999, mentioned the strategic alliance between Mitchell International and CollisionSyzygy. This new relationship added database estimating systems and electronic submission of images and reporting to CollisionSyzygy’s own proprietary software platform, which manages the entire claims process–from notification, to claims submission, to claims resolution and settlement.
Due to the speed and availability of information that the Internet provides, CollisionSyzygy plans to host most of its advertising via its website. Once operational, the marketing budget will focus on encouraging both repair shops and insurance companies to visit the website to discover how each might enjoy significant savings by using the CSI process.
3.4 Fulfillment
The services provided by CollisionSyzygy involve advanced software technology, use of the Internet, and a growing network of pre-certified repair shops. Since services are accessed through the use of CollisionSyzygy’s proprietary software, high cost personnel, expensive office space, and other supporting costs can be minimized to increase overall profits for the insurance company. The repair facility can receive a steady stream of business referrals from CSI, averting the need to employ expensive marketing and advertising programs of its own.
Eventually, CollisionSyzygy expects to have as much as 99 percent of its business deriving from e-commerce over the Internet rather than direct distribution of its proprietary software to repair shops and insurers. As a precautionary measure, CollisionSyzygy ensures that all Internet users retain an up-to-date hardcopy version of its software in the event of an Internet or file server problem that could interrupt claims operations.
Currently, the insurance company notifies CollisionSyzygy of a claim assignment through computer input into CSI’s software. CollisionSyzygy then notifies the appropriate repair facility. The repair shop prepares the estimate and photo images and conveys them back to CSI for review and analysis by a staff auditor. If everything is in order, the insurance company is notified electronically that the claim is approved for payment. During this process, complete management and status reporting is available to all participants in the claims process.
- Revenue Sources:
- Fee charged insurance company for claim assignment.
- Referral fees from body shops.
- Body shop facilities prepay for 10 claim referrals in advance, on account.
- A referral fee of five dollars per referral, times 10 referrals, results in a $50 prepaid fee being paid to CollisionSyzygy by each body shop. After 10 claims have been referred by CollisionSyzygy, the body shop prepays another $50 on account.
- An appraiser’s fee is charged to insurance carrier on each claim.
- Transaction fees are billed to outside adjusters.
- Fees for salvage and sale of non-repairable vehicles are charged to both the seller (insurance company) and the buyer.
- In the future, this “auctioning” of vehicles will be accomplished very efficiently through the Internet, making this revenue source even more profitable.
- Variable Expenses:
- Two dollar warranty cost paid per claim.
- Fee paid to independent appraisers, offset by revenues created by the claim.
3.5 Technology
Technology in the industry is vital to achieving market share. It is the competitive tool that a company must use to survive this increasingly competitive industry. Technology will:
- Enhance the ease with which an insurer can outsource the claims process.
- Reduce the time needed to initiate the repair process. Currently, it takes between five days to two weeks to process a claim. This dampens the volume of business that can be processed and incurs certain costs that technology will virtually eliminate. For example, vehicle storage costs can be eliminated if a claim can be processed in a single day.
- Allow smaller insurers to enjoy volume-based discounts that were formerly reserved for their larger counterparts whose claims volume is significantly higher.
- Increase reporting access and allow a more accurate assessment of claims status.
- Increase the level of repair quality monitoring while decreasing the amount of time to perform quality inspections.
- Improve insurer’s image to customers by enhancing ability to deliver its “financial promise” made when its insurance product was purchased.
- Substituting e-commerce technologies for manual distribution of CollisionSyzygy’s ACT software. Broadening the ability to access the rather limited salvage disposal marketplace, as examples, will increase the volume of business, enhance the ability to process that business in a high quality fashion and, ultimately, increase CSI’s market share.
The software interfaces with UltraMate® and ImageMate® to offer the full technological program other competitors are striving to develop. This technology is being used to further distinguish CollisionSyzygy, Inc. as the only U.S.-based company providing generic services.
With the addition and enhancement of Internet delivery technologies, CollisionSyzygy will build upon its existing technology infrastructure to more efficiently offer its claims processing.
3.6 Future Services
CollisionSyzygy is working to develop the following future claims-related services. Estimated dates of availability are offered:
- Salvage Disposal through CollisionSyzygy’s website will greatly enhance the speed and promulgation of the auctioning process (October, 2000).
- First Notice of Loss – will use 24-hour/7-day access of call centers to report new claim information (January, 2002).
- Rental Management – uses CSI’s website for dispatching assignments to auto rental companies, monitoring for mitigation, and auditing of final billings (January, 2002).
- Claim Management – will be improved through Internet access to assist claim personnel in overseeing the entire claim process, including the dispatching of miscellaneous services with the proper authority to initiate those services more rapidly (January, 2001).
- Subrogation – uses CSI’s website for sending and receiving information and documentation to assist insurance companies in recovering damages from wrongful parties (April, 2001).
Market Analysis Summary
The auto industry is such a vast market (estimated at $700 billion worldwide), that automobile owners will always represent substantial market demand for insurance risk products and claims to be processed. There are two huge markets for CollisionSyzygy to harvest: personal and commercial lines of insurance. Within those two massive lines of business fall the many segmented markets, from vehicle manufacturers, fleet leasing, banks and lending institutions, and even the vendors (who supply the parts to fix the vehicles), to government at all levels.
Competitors for the market all seem to agree that technology, which includes advanced software and Internet gateways, is the key to capturing and processing this high volume business. The savings that result for insurance carriers is the attraction that is building the industry. Those firms that can rapidly develop and host the technologies needed to enhance profits for the insurance companies and new-entrant banks and lending institutions will prevail as the industry leaders. CollisionSyzygy is positioned, in this regard, to be the premier provider of generic services.
4.1 Market Segmentation
CollisionSyzygy positions itself as a service provider to insurance companies, auto repair shops, and auto salvage firms. The company focuses its market offerings on these segments because they are believed to be the most receptive to CSI’s value proposition. In the future, another customer segment, which includes banks and other lending institutions, will be targeted to increase the revenue stream.

| Market Analysis | |||||||
| 2000 | 2001 | 2002 | 2003 | 2004 | |||
| Potential Customers | Growth | CAGR | |||||
| Insurance Companies | 5% | 2,600 | 2,730 | 2,867 | 3,010 | 3,161 | 5.01% |
| Auto Repair Shops | 5% | 20,000 | 21,000 | 22,050 | 23,153 | 24,311 | 5.00% |
| Auto Salvage Firms | 5% | 1,000 | 1,050 | 1,103 | 1,158 | 1,216 | 5.01% |
| Other | 5% | 500 | 525 | 551 | 579 | 608 | 5.01% |
| Total | 5.00% | 24,100 | 25,305 | 26,571 | 27,900 | 29,296 | 5.00% |
4.2 Target Market Segment Strategy
The obvious place to begin target marketing is where such marketing can effectively assist in building the services platform that can be employed to enter other market segments later on. CollisionSyzygy, Inc. is pursuing the expansion of its body shop network to take advantage of insurance company claims which are geographically positioned on a national basis. This, in turn, will attract more insurance company accounts. Currently, the insurance industry is being segmented as Personal Casualty and Business Casualty. CollisionSyzygy will concentrate on the Personal Casualty side at this time. As it expands the number of insurance company accounts that see it as a resource for Personal Casualty, CSI is only a step away from convincing these same accounts to utilize its services on the commercial Business Casualty side. The ground that has already been covered in order to acquire personal casualty accounts does not need to be travelled a second time in capturing the commercial side accounts.
The salvage market segment is born from a need to dispose of non-repairable vehicles on behalf of the insurance company.
These three market segments need to be expanded to perfect the services platform and increase the financial resources of CollisionSyzygy. Using technology-based claims processing services will make it easier for CSI to enter additional market segments and to more efficiently process the business that arises from it, making CSI more profitable and reliable in the delivery of its services than its competitors.
Banks, other lending institutions, and leasing market segments will have great need to process claims on vehicles that they finance. They will not want to increase operating overhead to process these claims internally and will look to the TPA to handle claims on a cost-efficient basis.
Vehicle manufacturers will have a need to settle claims on damaged vehicles, very similar to the Fleet Leasing market segment.
Many of the vendors used in the claims settlement process become an excellent market segment to capture and involve in the process. Revenues can be generated for CollisionSyzygy in making referrals to these “outside vendors.” Examples include glass vendors, aftermarket and used parts vendors, and mobile services.
Finally, a vast market to handle claims for Government agencies could prove very profitable for CollisionSyzygy.
4.2.1 Market Needs
In designing and creating its concept, CollisionSyzygy has focused on what needs are satisfied by the offering of its services to each of its target markets. Here is a brief look at each segment and what CollisionSyzygy offers.
Repair Facilities. Since CollisionSyzygy brokers the insurance company’s claim to a member repair facility, the repair shop benefits from a steady stream of referrals without the need to spend money on its own marketing and advertising program. This increases revenues and profits.
Salvage. To reduce the costs of settling a claim, the insurance company must sell non-repairable vehicles. This is a very specialized marketplace that requires that many potential buyers be identified and the best price accepted. This process must be swiftly conducted in order to further reduce the the insurer’s costs of vehicle storage. CSIs network of foreign buyers, salvage companies, private parties, and used parts companies can satisfy this need. Add the Internet as a public auction system, and you deeply magnify the ability of finding a buyer rapidly who will pay the highest possible price.
Insurance Company. The use of CollisionSyzygy offers numerous benefits that cannot be ignored by the insurance company client:
- Pooling of claims to obtain cheapest repair shop pricing.
- Mandatory five percent pricing discount by CollisionSyzygy member repair shops.
- Online, current status management reports on repair progress and claims flow.
- Reduce personnel and equipment costs by outsourcing the claims process.
- More rapid turnover of capital reserves dollars to allow for more insurance policy sales (more revenue dollars).
- More accurate claims estimates can be processed more quickly, reducing the need for costly vehicle storage.
Fleet Leasing, Banks/Lending Institutions, and Vehicle Manufacturers. In addition to many of the benefits mentioned above, these market segments benefit from outsourcing vehicle inspections and repairs on vehicles that are self-insured.
4.2.2 Market Trends
Traditional insurance distribution has generally consisted of either independent or captive agents distributing insurance products and assisting the insurance company in servicing product claims. While this model is still predominant, increasing pressure is changing the direction of the claims processing business. A trend towards outsourcing the process to TPAs is eliminating the extra cost associated with sales commissions and in-house claims processing. Hence, the birth of the Direct Response industry seems very healthy and long lived. It is this latter approach that defines the vision of CollisionSyzygy.
According to A.M. Best and Company, an insurance company directory and ratings service, in 1995, there were over 3,350 property and casualty insurers in the United States. Annual premium collected by these companies is $270 billion. Premiums collection is growing at three percent annually. Approximately 47%, or $126 billion, is written for automobile insurance.
Each year, an average of 11% of automobile and light truck policyholders file claims on 150 million vehicles. In 1994, the insurance industry paid $23.6 billion to repair shop facilities, another $13 billion was paid for total loss claims, and $40 billion was paid for personal injury claims.
In 1996, the costs of the claims administration process was over $12 billion. Claims processing expense and claims payment expense amounted to 78.3 cents of every premium dollar collected by insurers in 1996. At present, the claims outsourcing marketplace is estimated to be $3 billion.
In a world of ever-increasing specialization, caused by the need to minimize costs, the industry is positioned to take its fair share of this huge insurance market and the enormous revenue dollars available. In the past, large insurance companies maintained sizeable resources and staff to process claims in-house. It is becoming obvious to the profit and loss statements of most insurance carriers, both large and small, that outsourcing the claims activity can produce greater profits to the bottom line. Yet, the conversion of internal processing departments to outsourcing to direct response companies, like CollisionSyzygy, has only begun. Only 12% of the U.S. auto market is serviced by direct response companies. This is expected to grow to nearly 20% by 2005.
The rapidly changing automobile insurance marketplace is experiencing price constraints as a result of increasing competition and regulatory activity. At the same time, policyholders are demanding ever-higher levels of customer service. Competitive pressures and resistance by policyholders and regulators to premium increases are causing insurance companies to focus on cost management.
The insurance industry’s focus on cost management has been accompanied by an increasing recognition that it is far easier and more cost effective to retain an existing policyholder than to attract a new customer away from a competitor. Dissatisfaction with the claims handling process is cited frequently as a cause of policy non-renewal.
Automobile insurers need to increase consumer satisfaction through a faster, more efficient claims handling procedure. This has led many property and casualty insurers to use third party administrators to provide certain functions or services that the insurers historically performed in-house. This allows the insurance carrier to focus on core competencies, reduce costs, and avoid the significant investment associated with developing, installing, operating, and maintaining information management and automation systems.
Recent U.S. government legislation has further opened the market by allowing the banking industry to enter the insurance industry for the first time.
Insurance companies selling directly to policyholders are reducing sales commission costs by not having to compensate agents or brokers. This puts pressure on the pricing of policies to consumers, making it harder for insurers who use a sales distribution force to compete. By reducing claims processing costs, those companies using a sales force can compete more effectively with those who use direct sales channels.
In order for smaller insurance companies to compete with larger insurers, they need to achieve economies of scale resulting from large volume. The expense of setting up automated systems, processes, and the hiring and training of specialized personnel to handle claims processing, on a lower volume of claims, is prohibitive. By pooling the claims of many smaller insurance carriers, the third party administrator can provide the smaller company with the economies of scale to compete with larger insurers.
New market opportunities can be more readily sought by insurers who outsource the infrastructure that would otherwise need to be built internally to support the claims processing of these new markets.
Deregulation has allowed non-traditional, or “virtual” insurance companies to enter the property and casualty (P&C) marketplace. Examples are banks, credit unions, and other financial services companies who are underwriting P&C insurance. These new market entrants generally do not have policy and claims administration infrastructure or expertise in place and are natural candidates for outsourcing. This allows these virtual companies to concentrate resources and existing expertise on the core marketing, underwriting, and other financial aspects of the P&C insurance business.
Risk distribution often requires insurance companies to discontinue selling new policies in a particular market area in which they are over-concentrated. Rather than service this business internally, these policies are often outsourced for administration and claims processing until the concentration of policies diminishes or the book of business is sold to another carrier.
4.2.3 Market Growth
The real future growth of the industry has only begun to occur. Demographics will play a significant role. The baby boomer generation totals approximately 78 million people, and are approaching the age of 50. They are the largest single component of demand trickling through to the industry. They are a mature market with sizeable disposable income. Traditionally, this group has remained loyal to the larger insurance companies, who use internal claims processing. Examples of these companies are State Farm and Allstate.
The offspring of the baby boomers, the boomlets, is nearly as large a market as the boomers. The future growth of the industry will rely on the boomlets, a higher risk group who are now reaching driving age. They do not remain loyal to the traditional, large insurance carrier model and will channel their business through the medium and small insurance carriers, thus, companies. This generation will shop and bank through the Internet 24 hours per day, 7 days per week. This is where the banking and financial service industry will concentrate its marketing efforts, increasing the need for outsourcing services.
A.M. Best and Company performed a study indicating that the ten largest insured catastrophes occurred since 1989. Hurricane Hugo occurred in 1989, Hurricane Andrew in 1992, and the Northridge earthquake in 1994. Insurance carriers are decreasing their exposure in areas prone to natural disasters. New demand created by insurers leaving markets is absorbed by reinsurers and new market entrants who have not made major infrastructure investments and will not likely wish to do so. Claims outsourcing is very attractive to these new entrants and will enable them, as already mentioned, to enter new markets without incurring substantial fixed infrastructure costs.
4.3 Service Business Analysis
The primary participants in the industry are large national firms involved in information delivery systems to many aspects of business. As such, few can be called “specialists” in the industry. CollisionSyzygy offers only one line of business – generic claims processing. While not the largest firm in the industry, CollisionSyzygy’s focus and concentration will continue to develop its market presence and reputation as the firm that insurance carrier’s will contact when a claim needs to be processed.
Body repair facilities will appreciate the fact that only CollisionSyzygy has a territorial program that preempts the need for marketing efforts (and costs) to acquire business. Not only does this save the costs of marketing, but it increases revenues because marketing time is transferred to body repair time. CSI is the one firm that is unifying the various information reporting “languages” so that claim reporting can be interpreted whether its source is ADP, Mitchell or CCC. Not all of CSI’s steady technological developments have been noticed in the marketplace yet. But, its persistent and disciplined approach to building innovations with substance will make it a market leader in the very near future.
4.3.1 Main Competitors
There are a number of competitors in the industry. Notwithstanding the possibility of future mergers and consolidations, none currently pose a serious threat to CollisionSyzygy. This is because none have mastered all facets of service delivery to the extent CSI has reached.
CCC Information Systems, Inc. is a national organization and provides the biggest threat to the industry due to its service approach to all three insurance company markets and is actively seeking bank entrants and new upstarts. CCC does have a network of certified repair shops. However, unlike CollisionSyzygy who, through its brokerage services provides business directly to its body shops, CCC’s network must spend time and resources to market to the insurance carriers for the business they receive. Furthermore, CCC claim information is limited to the CCC platform. CollisionSyzygy can operate all three information platforms as mentioned earlier.
ADP is also a national firm which specializes primarily in repair estimating systems. Through its Claims Solutions Group, ADP offers automated collision estimating systems, a total loss valuation database, property loss estimating systems, electronic management reports, medical claims review software, and business management systems to the property and casualty insurance, automotive recycling, and collision repair industries.
Crawford & Company is an international provider of third party administrator services, concentrating on traditional claims and appraisal services to the property and casualty industry. Its services include claims management, loss adjustment, health care management, risk management services, class action administration, and risk information services. Crawford & Company is based in Atlanta and has approximately 10,000 employees worldwide, operating over 700 offices in 65 countries. The corporation’s shares are publicly traded on the New York Stock Exchange under the symbols CRD.A and CRD.B.
Gallagher Bassett is another national firm serving primarily as a third-party administrator. Again, they have no program nor a program to deal with salvage.
INSpire Insurance Solutions is another third-party administrator. It does not have a salvage disposal program.
Carstation.com was founded in October, 1998 in San Francisco, California. Thus far, it has focused on parts ordering by its network of body shops. Its primary success has been its ability to raise large sums of capital from investors.
Acar.net (Automotive Care & Repair Network) is a “virtual” provider with a network of body shops. It does not have an program nor is its network even managed by Acar.
Copart is a third party administrator offering an online salvage auction. Currently, its fees are much higher than CollisionSyzygy’s. Further, where CSI’s sales are nearly instantaneous, Copart’s sales take extra time to clear. Copart Salvage Auto Auctions, founded in 1982, provides vehicle suppliers, primarily insurance companies, with a capability to sell salvage vehicles through auctions, principally to licensed dismantlers, rebuilders and used vehicle dealers. Salvage vehicles are either damaged vehicles deemed a total loss for insurance or business purposes or are recovered stolen vehicles for which an insurance settlement with the vehicle owner has already been made. Copart generates revenues primarily from auction fees paid by vehicle suppliers and vehicle buyers as well as related fees for services such as towing and storage. Copart currently operates 72 facilities in 35 states. The company is listed on the NASDAQ with the symbol CPRT.
4.3.2 Competition and Buying Patterns
What makes CollisionSyzygy, Inc. so different from its competitors is the scope of its services and the technology used to deliver those services.
- CollisionSyzygy is attempting to maximize the value it offers insurers by accelerating the claims process to achieve more savings. It does this with its ACT software which manages the entire claims process. It is building a vast network of repair shops that will allow claimants to attain swift damage resolution. The repair shops have access to additional software, through CSI, that rapidly creates accurate repair estimates and electronically transmits those estimates and any supporting data and photos to the case adjusters. Meanwhile, all participants in the claims process receive timely reporting of each case’s status.
- Online auctions will rapidly dispose of non-repairable vehicles and avoid expensive storage costs.
- Repair shops are seeking “partners” to assist in capturing the insurance business. Teaming up with CollisionSyzygy helps these shops meet the compliance check requirements imposed by the insurance carriers. CSI has established very stringent inspection procedures and member repair shops have agreed to refund revenues collected for unnecessary or excessive repairs in addition to offering discounts to the insurance carrier on regular repairs. CSI has established lifetime warranties on all repairs.
- CollisionSyzygy is capable of managing the claim information of all three industry information providers and offer consolidated reporting to the insurance client. The formats used by Mitchell International, ADP, and CCC Information Systems are quite different. CSI is developing a single specification platform which will lend uniformity to accessing claim information for all three formats, extending its ability to be utilized by all repair shops.
- CollisionSyzygy is widely known as a pioneer in the industry.
- CollisionSyzygy is the leader in handling fleet industry claims.
- Sensitivity to market direction is a trademark of CollisionSyzygy’s marketing plan. It is poised to respond quickly to adjustments in market direction and implement its responses to remain an industry leader.
- Accessibility to using CollisionSyzygy’s program is another competitive factor. Both insurance carrier and service shop can be operational within a few hours of “sign-up.”
- Geographical territories are awarded to each repair shop to avoid non-productive competitive behavior and build loyalty to CollisionSyzygy’s mission.
With the dawn of the Internet, CollisionSyzygy promises to be the first program to offer its services using a secure environment on the Internet!
4.3.3 Business Participants
The Direct Response (DR) industry has already captured over 12% of the United States auto insurance market, with considerable growth yet to come. By 2005, it is estimated that this distribution presence will grow to over 20%. The DR market has vast, open space far beyond the borders of personal line automobile insurance. The market for commercial insurance customers is also a target.
Large property and casualty insurers are scurrying towards DR distribution in an effort to remain competitive in pricing insurance products. These carriers simply cannot ignore the economy of scale caused by channeling claims in a more cost-efficient manner. Hence, the competition from DR is actually causing the DR marketplace to grow as traditional distribution insurance carriers re-think and re-tool their claims and product distribution processes.
In 1996, the U.S. federal government revised banking legislation that allowed this industry sector to enter the insurance business and become serious competitors. Both the banking and insurance industries view financial risk management products as prime investment opportunities. Rather than competing brutally against each other, some banks and insurance companies have consolidated assets to form huge conglomerates capable of harvesting the burgeoning demand for financial products that can manage risk or accumulate wealth. The $751 billion merger of Citigroup and Travelers Insurance is a prime example of such a union.
Large leasing companies have both the need and positioning to develop DR businesses that can be offered to the insurance industry. Since an auto leasing company needs to handle its own claims, it can extend that service as a business to other entities requiring the same service. Hertz Claim Management is a national provider of claims management services, having began as an in-house claim operation to manage its own auto fleet. Today, it has eight claim centers throughout the United States with revenues of $34 million.
Most of the competition, however, consists of dedicated firms attempting to gain market share through different approaches. Most firms are regional in scope, with a few national, and even fewer international firms as participants. Crawford and Company is international in scope with a concentration in the United States. Annual revenues exceed $600 million.
The most aggressive of the participants is CCC Information Services, Inc. whose target is to capture all size insurance companies through its software sales. CCC is attempting to make smaller, upstart companies reliant on its systems to prevent such companies from growing and developing in-house claims programs. Success in its approach could suggest total market domination in the Direct Response industry.
Strategy and Implementation Summary
CollisionSyzygy is positioning itself to lead the industry through developing and maintaining leading edge technologies in providing its services, by offering a value proposition to insurance carriers that is difficult for competitors to emulate, and by utilizing effective methods of marketing its services.
5.1 Strategy Pyramid
Strategy 1: BODY SHOP NETWORK EXPANSION
Territorial Franchises. As part of membership in the CollisionSyzygy network, body shops are licensed in a geographic territory that creates a feeling of loyalty and generates more business. Thus, once a member, a body shop will not have a competitor spring up across the street and receive claims referrals from CollisionSyzygy. Those firms that do have repair shop networks generally leave the repair shop to market directly to the insurance carrier for business.
Direct Business Referrals. Membership in the CollisionSyzygy service facility network means direct cases to work. Body shops pre-pay a nominal fee that gives them ten cases to work. Once the ten cases are completed, another nominal deposit buys another ten repair cases.
Monitor, Maintain Quality Standards, and Perform Inspections for Insurance Carriers. One of the primary needs for a body shop is to perform work that meets or exceeds the standards set by the insurance carrier. CollisionSyzygy performs the inspections for the body shop and keeps abreast of the quality standards required by the paying insurance carrier.
Proprietory Software. Member body shops have access to the ACT program for case process management; UltraMate® software for damage repair estimates, and ImageMate® software for processing images and electronically transmitting the documents needed to transmit the claim for handling by the insurer. This saves considerable time and expense for the body shop.
Marketing Representatives. The Internet portal can be marketed, along with CollisionSyzygy’s services, directly through the use of marketing representatives that CSI plans to implement.
Other Marketing Methods. Both the Internet and direct mail marketing can be used effectively to attract and enroll new body shops to participate in the CollisionSyzygy program.
STRATEGY 2: ATTRACT INSURANCE COMPANY ACCOUNTS
Discount on Repairs. Every claim submitted through CollisionSyzygy receives an automatic five percent discount on repairs.
Dramatic Reduction in Turnaround Time – Cost Savings. Claim processing time is drastically reduced and provides significant cost savings arising from more accurate estimates, savings from reduced in-house staff, and minimal, if non-existent, auto storage costs. Online auctions can dispose of a vehicle before the case is closed and give insurance companies more real-time knowledge of actual net costs of processing the claim.
Lifetime Repair Warranty. Repairs are warranted for life at all CollisionSyzygy repair shop facilities.
Improved Communications. ACT software allows the insurance company to keep close tabs on the progress of resolving a claim. The quicker the claim can be completed satisfactorily, the sooner financial reserves can be freed to process the next claim. This results in greater profitability to the insurance carrier because “speed” translates into lower capital reserves requirements, allowing capital to be deployed to other aspects of the company’s business.
Quality Repairs. CollisionSyzygy repair shops must meet an extremely stringent list of requirements to receive their member territory. This enhances customer satisfaction for the insurer’s claimant, thus reflecting favorably on the insurance company.
Other Special Extras. Estimates and 35 mm or digital images are FREE. Towing (within 15 mile radius) is FREE. Storage (up to 30 days) is FREE.
Build National Network. By building a national network of service facilities, in conjunction with the use of an Internet presence, CollisionSyzygy can appeal to insurance carriers located anywhere in the United States and service claims in the local area.
Marketing Representatives. The Internet portal can be marketed, along with CollisionSyzygy’s services, directly, through the use of marketing representatives that CollisionSyzygy plans to implement.
STRATEGY 3: EASE TO WORK WITH CollisionSyzygy
Internet Gateway. CollisionSyzygy is designing a website that will be the portal to its array of services. Both insurance companies and repair shops can become operational users of CollisionSyzygy’s programs within a few days of “logging on” to the CollisionSyzygy website. The current version of the ACT software would have to be enhanced to operate on the Internet.
Software Technologies. Again, ACT, ImageMate® and UltraMate® software will streamline the entire claims process. Strategy 4 will further unify the information reporting between the various industry data standards now used.
STRATEGY 4: UNIFY INFORMATION REPORTING PLATFORMS
Multi-Platform Translator. CollisionSyzygy is working on creating a single specification translation software that will make the three dominant standards of data reporting compatible: ADP, Mitchell, and CCC. This will enhance the number of service shops that can use CollisionSyzygy’s services and extend the capability of handling more insurance company accounts (and claims).
5.2 Value Proposition
Quite simply, CollisionSyzygy creates additional profits for insurance companies who use its process. A simple example can illustrate the value offered by CollisionSyzygy:
Regular Insurance Company Method for Handling Claim:
Claim is assigned to an Independent Appraiser (IA):
$80 Estimate for Repair: $2,000.
Cost to Insurance company: $2,080.
CollisionSyzygy Handles the Claim:
Handling Fee for CollisionSyzygy: $75 (highest rate paid)
Estimate for Repair, less 15% discount 1: $1,700
Five percent discount from CollisionSyzygy Shop: less $85
Cost to Insurance Company: $1,690.
COST SAVINGS – USING CollisionSyzygy: $390.
5.3 Competitive Edge
In general, there are various key points that give CollisionSyzygy a strategic edge over its competitors:
- Software Technologies. ACT software, ImageMate®, and Ultramate® software creates a complete claims submission, monitoring, and reporting program that is unmatched in the industry for ease of use and power.
- Open Information Platform. CollisionSyzygy can manage the claim information of all three information providers (CCC, ADP, and Mitchell) and offer consolidated reporting to the insurance client.
- Internet. The use of the World Wide Web will make it easy for body shops and insurance carriers to become clients of CollisionSyzygy and to use CSI’s services in processing claims.
- Experience. Few companies can boast the experience possessed by CollisionSyzygy’s CEO in managing the firm’s operations and future technological developments.
- Value. CollisionSyzygy creates a more extensive relationship with its repair shops than other firms. This results in lower turnover, higher discounts to insurance carriers, and more reliable repairs. CSI has mastered the value-added proposition being offered to the insurance industry.
- Online Salvage. Very few firms offer an effective auction for disposing of salvage. CollisionSyzygy’s program accesses a much more extensive marketplace by avoiding many of the restrictions imposed by other online auctions. Also, sales can be transacted almost immediately after a buyer is found unlike the more time-intensive closings associated with other online auctions.
- Quality Control. No other firm imposes a higher set of standards on its repair shop network than CollisionSyzygy. In exchange for rigid, quality standards and discounts to the insurance carriers, repair shops receive territorial franchises for work referred by CSI.
- Industry Acceptance and Recognition. Body repair shops and insurance companies recognize and look to CollisionSyzygy for collision repair services.
- Fleet Management Superiority. CollisionSyzygy can manage the collision repairs for the fleet industry and is superior to all of the existing fleet management companies.
- Generic Direct Repair. CollisionSyzygy is virtually the only generic repair firm in the industry. None of its processes are tied to a proprietory insurance company system.
5.4 Marketing Strategy
Marketing strategy will depend upon the target market being sought by CollisionSyzygy, which is as follows:
Service Repair Shops. CollisionSyzygy will use direct mail brochures, industry trade magazine ads, and the CollisionSyzygy website to attract new members to its repair network. The Internet will assist greatly in making CSI’s presence known to repair shops all over the country.
Insurance Companies. In addition to direct mail brochures, property, and casualty insurance trade magazine advertising and Internet exposure, CollisionSyzygy will use direct marketing representatives. In addition, Mr. Smith’s expertise can be expressed through trade articles which will give CollisionSyzygy additional market exposure and credibility.
Insurance Companies – Commercial Lines. Once a significant foothold has been established in the personal lines business, CollisionSyzygy can expand upon those same relationships to build a commercial business. All of the methods described above can be used in addition to direct marketing representatives of CSI accessing the commercial line business with existing and new client firms.
Trade Shows. Large trade shows are the mark of this industry because so many different businesses are attracted to learn about new technologies and, perhaps, prospect new business for their firms. Noteworthy is the world’s largest annual exposition, nicknamed NACE and known as International Autobody Congress and Exposition. The 18th NACE exposition will be held in the year 2000. More than 35,000 collision repair professionals from all over the world attend NACE. CollisionSyzygy plans to attend the NACE expositions, each year, to maintain its industry presence and to develop new clientele.
5.4.1 Pricing Strategy
In general, the pricing of CollisionSyzygy’s services is the backbone of the strategy to create value for the insurance carriers while delivering these services more cost effectively than its competitors.
Section 5.2 has already examined how value is created when an insurance carrier decides to outsource a claim to CollisionSyzygy versus processing that claim internally. Much of the lower pricing arises from discounts created through volume relationships with CSI’s vendors. The volume offered to the service providers (body shops, outside adjusters) reduces their marketing expenses (both in personnel costs and advertising materials) and more fully utilizes fixed capital assets. These savings are available for discount pricing to the insurance companies. In addition, more accurate cost estimates, through the use of UltraMate® software technology, allows cost control and monitoring that further enhances the value proposition to the insurance carrier. The effectiveness of CollisionSyzygy’s online auction has literally taken an area of unknown cost results and converted it to a quantifiable outcome that gives the insurance company additional control over the cost of the claims process.
CollisionSyzygy has built its pricing strategy to maximize the value proposition to the insurance company while making it difficult for competitors to be selected for their pricing. The first 100 claims per month provide a thin profit margin of 15%. Claims above 100 jump the average profit to 35% per claim. Five percent of this profit is spent on the standard discount offered to an insurer on every claim.
5.4.2 Promotion Strategy
The promotion strategy for CollisionSyzygy will include the use of the following methods:
- Direct mail brochures and mailers.
- Internet marketing.
- Full-time account representatives.
- Referrals from repair shops and insurance companies.
- Magazine advertising and professional trade articles.
- Annual NACE trade show and other smaller, regional trade events.
5.5 Sales Strategy
After becoming familiar with CollisionSyzygy’s services and capabilities, repair shops will want to join the CollisionSyzygy service network because:
- Marketing is performed for them by CollisionSyzygy. Indeed, business is directly awarded to a repair shop through its membership in the CollisionSyzygy network.
- Insurance company standards and inspections are managed and performed by CollisionSyzygy.
- Various types of expenses are minimized and fixed asset utilization is maximized by a relationship with CollisionSyzygy.
- Information management and reporting, claim cost estimating and data communication is made swift and cost effective through the use of CollisionSyzygy technologies and utilizes a translation platform that crosses the three leading methods: ADP, CCC, and Mitchell.
Insurance companies and other risk management providers will become CollisionSyzygy clients because:
- In general, it is much less expensive to outsource claims to CollisionSyzygy than to process claims internally or use CollisionSyzygy’s competitors.
- Turnaround time on claims processing will release valuable capital reserves that can be used to acquire additional new insurance business.
- Proficiency in training new internal personnel will be attained more rapidly and at a lower cost when outsourcing to CollisionSyzygy.
- Service technologies will be upgraded and maintained by CollisionSyzygy rather than by the insurance carrier.
- Live human beings will be available to assist in servicing insurance accounts–not just websites and email.
Full-time marketing representatives will be available to answer inquiries, assist in demonstrations, set up software, and for training insurance and body shop personnel on CollisionSyzygy’s specific claims process.
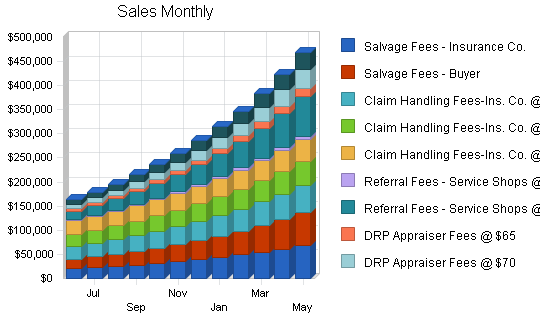
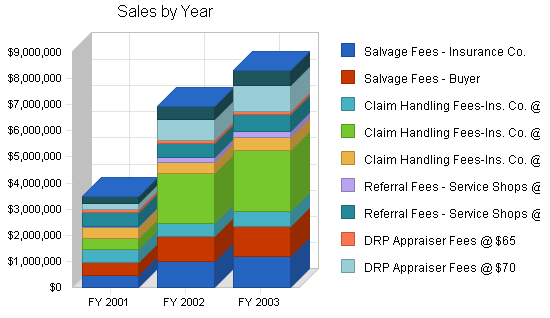
5.5.1 Sales Forecast
The unique and comprehensive array of claim processing services, offered by CollisionSyzygy, will allow it to rapidly build sales. Furthermore, the depth of the market–both individual and commercial–will handsomely reward the market leaders and innovators like CSI. Much of the revenue CollisionSyzygy earns is merely a reversion of a portion of the profits created for the CSI client. The following chart estimates sales from June 1, 2000 to May 31, 2001, and reflects the additional infrastructure created by the capital investment.
| Sales Forecast | |||
| FY 2001 | FY 2002 | FY 2003 | |
| Unit Sales | |||
| Salvage Fees – Insurance Co. | 9,540 | 19,540 | 23,448 |
| Salvage Fees – Buyer | 9,540 | 19,540 | 23,448 |
| Claim Handling Fees-Ins. Co. @ $45 | 10,740 | 10,740 | 12,888 |
| Claim Handling Fees-Ins. Co. @ $50 | 8,640 | 38,640 | 46,368 |
| Claim Handling Fees-Ins. Co. @ $70 | 6,180 | 6,180 | 7,416 |
| Referral Fees – Service Shops @ $5 | 8,340 | 38,340 | 46,008 |
| Referral Fees – Service Shops @ $30 | 17,220 | 17,220 | 20,664 |
| DRP Appraiser Fees @ $65 | 1,800 | 1,800 | 2,160 |
| DRP Appraiser Fees @ $70 | 3,552 | 11,552 | 13,862 |
| Dispatch Fees | 49,185 | 99,200 | 119,040 |
| Other | 0 | 0 | 0 |
| Total Unit Sales | 124,737 | 262,752 | 315,302 |
| Unit Prices | FY 2001 | FY 2002 | FY 2003 |
| Salvage Fees – Insurance Co. | $50.00 | $50.00 | $50.00 |
| Salvage Fees – Buyer | $50.00 | $50.00 | $50.00 |
| Claim Handling Fees-Ins. Co. @ $45 | $45.00 | $45.00 | $45.00 |
| Claim Handling Fees-Ins. Co. @ $50 | $50.00 | $50.00 | $50.00 |
| Claim Handling Fees-Ins. Co. @ $70 | $70.00 | $70.00 | $70.00 |
| Referral Fees – Service Shops @ $5 | $5.00 | $5.00 | $5.00 |
| Referral Fees – Service Shops @ $30 | $30.00 | $30.00 | $30.00 |
| DRP Appraiser Fees @ $65 | $65.00 | $65.00 | $65.00 |
| DRP Appraiser Fees @ $70 | $70.00 | $70.00 | $70.00 |
| Dispatch Fees | $5.00 | $5.00 | $5.00 |
| Other | $0.00 | $0.00 | $0.00 |
| Sales | |||
| Salvage Fees – Insurance Co. | $477,016 | $977,000 | $1,172,400 |
| Salvage Fees – Buyer | $477,016 | $977,000 | $1,172,400 |
| Claim Handling Fees-Ins. Co. @ $45 | $483,308 | $483,300 | $579,960 |
| Claim Handling Fees-Ins. Co. @ $50 | $431,983 | $1,932,000 | $2,318,400 |
| Claim Handling Fees-Ins. Co. @ $70 | $432,580 | $432,600 | $519,120 |
| Referral Fees – Service Shops @ $5 | $41,699 | $191,700 | $230,040 |
| Referral Fees – Service Shops @ $30 | $516,588 | $516,600 | $619,920 |
| DRP Appraiser Fees @ $65 | $117,007 | $117,000 | $140,400 |
| DRP Appraiser Fees @ $70 | $248,656 | $808,640 | $970,368 |
| Dispatch Fees | $245,927 | $496,000 | $595,200 |
| Other | $0 | $0 | $0 |
| Total Sales | $3,471,781 | $6,931,840 | $8,318,208 |
| Direct Unit Costs | FY 2001 | FY 2002 | FY 2003 |
| Salvage Fees – Insurance Co. | $7.26 | $7.62 | $8.00 |
| Salvage Fees – Buyer | $7.26 | $7.62 | $8.00 |
| Claim Handling Fees-Ins. Co. @ $45 | $6.53 | $6.86 | $7.20 |
| Claim Handling Fees-Ins. Co. @ $50 | $7.26 | $7.62 | $8.00 |
| Claim Handling Fees-Ins. Co. @ $70 | $10.16 | $10.66 | $11.20 |
| Referral Fees – Service Shops @ $5 | $0.73 | $0.76 | $0.80 |
| Referral Fees – Service Shops @ $30 | $4.35 | $4.57 | $4.80 |
| DRP Appraiser Fees @ $65 | $9.43 | $9.90 | $10.40 |
| DRP Appraiser Fees @ $70 | $10.16 | $10.66 | $11.20 |
| Dispatch Fees | $0.73 | $0.76 | $0.80 |
| Other | $0.00 | $0.00 | $0.00 |
| Direct Cost of Sales | |||
| Salvage Fees – Insurance Co. | $69,215 | $148,851 | $187,553 |
| Salvage Fees – Buyer | $69,215 | $148,851 | $187,553 |
| Claim Handling Fees-Ins. Co. @ $45 | $70,128 | $73,633 | $92,778 |
| Claim Handling Fees-Ins. Co. @ $50 | $62,681 | $294,351 | $370,882 |
| Claim Handling Fees-Ins. Co. @ $70 | $62,768 | $65,909 | $83,045 |
| Referral Fees – Service Shops @ $5 | $6,051 | $29,207 | $36,800 |
| Referral Fees – Service Shops @ $30 | $74,957 | $78,707 | $99,171 |
| DRP Appraiser Fees @ $65 | $16,978 | $17,826 | $22,460 |
| DRP Appraiser Fees @ $70 | $36,080 | $123,201 | $155,233 |
| Dispatch Fees | $35,684 | $75,568 | $95,216 |
| Other | $0 | $0 | $0 |
| Subtotal Direct Cost of Sales | $503,757 | $1,056,105 | $1,330,692 |
5.6 Strategic Alliances
The primary strategic alliance is the UltraMate® and UltraImage® software systems provided by Mitchell International. These systems make it possible for repair estimates to be quickly and accurately created and for claim data and images to be transmitted to CollisionSyzygy and the insurance carrier in handling a claim.
Another key alliance is the body shop network which receives the claim assignments from CollisionSyzygy. The growing size of this alliance with CSI will enhance its capacity to accept and service new claims business from insurance carriers. A national density of collision repair shops will create a certain “liquidity” for insurance carriers to use CollisionSyzygy in handling their claims.
5.7 Milestones
The following table outlines key milestones in CollisionSyzygy’s progress of becoming the premier independent, generic company. CollisionSyzygy’s plan for success includes a very comprehensive, one-stop series of programs and services to capture the claims market and build the service repair shop network to process that business.

| Milestones | |||||
| Milestone | Start Date | End Date | Budget | Manager | Department |
| Internet & E-Commerce Service Platform | 3/1/2000 | 4/15/2000 | $50,000 | William | N/A |
| Online Salvage Auction | 6/1/2000 | 12/28/2000 | $75,000 | William | N/A |
| Compatibile Information Reporting | 3/1/2000 | 5/1/2000 | $50,000 | William | N/A |
| Launch Sales Force Marketing | 6/1/2000 | 12/31/2000 | $125,000 | William | N/A |
| Expand to Commercial Service Offerings | 1/1/2001 | 3/31/2001 | $40,000 | William | N/A |
| 7 Day/24-Hour Claims Center Access | 7/1/2000 | 2/28/2001 | $60,000 | William | N/A |
| Rental Management Services-Internet | 8/1/2000 | 12/28/2000 | $50,000 | William | N/A |
| Subrogation Services-Internet | 10/1/2000 | 2/28/2001 | $75,000 | William | N/A |
| Attend NACE Trade Show | 8/1/2000 | 12/15/2000 | $150,000 | William | N/A |
| Office Phone System | 6/1/2000 | 7/15/2000 | $15,000 | Karen | N/A |
| Computers & Office Furniture | 6/1/2000 | 6/30/2000 | $25,000 | William/Karen | N/A |
| File Server | 6/1/2000 | 6/30/2000 | $50,000 | William | N/A |
| ISP Connections (12) | 6/1/2000 | 6/30/2000 | $12,000 | IS Mgr. | N/A |
| Create Promo Packages | 6/1/2000 | 7/15/2000 | $97,500 | Karen | N/A |
| Operating Expense Float – 6 months | 6/1/2000 | 12/31/2000 | $951,204 | N/A | N/A |
| Regional Trade Shows/Exhibitions | 5/1/2000 | 12/31/2000 | $125,000 | William/Karen | N/A |
| Totals | $1,950,704 | ||||
Management Summary
William Smith is the founder and president of CollisionSyzygy. He has begun the process of expanding the company with positions needed to gain momentum in accomplishing the key milestones listed in the last section.
Karen Zabo has a substantial background in banking management and will lead the administration and marketing side of the business as vice president. Her primary functions include overall management of administrative activities, and supervising the customer service and sales representative departments.
Harry Bannister has significant trade skills and management experience in the collision repair business. He will serve as vice president of Operations. His job will be to oversee and manage the technical aspects of CollisionSyzygy, including staff appraisers, the body shop network, and the independent appraisers.
**Resume’ material removed for confidentiality.
6.1 Management Team Gaps
6.2 Personnel Plan
The following table estimates personnel costs from June 1, 2000 to May 31, 2002.
| Personnel Plan | |||
| FY 2001 | FY 2002 | FY 2003 | |
| President | $120,000 | $144,000 | $172,800 |
| Vice-President Operations | $85,000 | $97,750 | $112,413 |
| Vice-President Administration | $85,000 | $97,750 | $112,413 |
| IS Manager | $85,000 | $97,750 | $112,413 |
| CFO | $41,665 | $115,000 | $132,250 |
| COO | $41,665 | $115,000 | $132,250 |
| Software Developers (2) | $150,000 | $172,500 | $198,375 |
| Staff Appraisers (Total) | $320,004 | $640,000 | $736,000 |
| Customer Service Rep’s (Total) | $162,000 | $324,000 | $372,600 |
| Marketing Rep’s (Total) | $99,996 | $250,000 | $287,500 |
| Marketing Rep 10% x Net Income Bonus | $136,560 | $196,200 | $225,630 |
| Operations Manager | $35,415 | $97,750 | $112,413 |
| Administrative Manager | $31,250 | $86,250 | $99,188 |
| Total People | 24 | 43 | 43 |
| Total Payroll | $1,393,555 | $2,433,950 | $2,806,243 |
Financial Plan
The information contained in the Financial Plan section assumes that an equity investment is made into CollisionSyzygy, during June, 2000, and that the following capital investments are made:
| File Server |
$50,000 |
| ISP Lines |
$12,000 |
| New Phone System |
$25,000 |
| 15 New Computers |
$22,500 |
| Office Furniture |
$10,000 |
| Misc. Computer Supplies |
$15,000 |
| Total |
$134,500 |
Furthermore, the equity investment allows for the addition of key personnel as mentioned earlier in this business plan. Key promotional programs and travel expenses, including the attendance at the annual NACE Exposition, will require capital and operating expenses totaling approximately $444,500.
With these capital and personnel investments, CollisionSyzygy expects to achieve significant sales growth. For the period ending May 31, 2001, sales are expected to be (whopping), growing to (knock me over with a feather) by June 30, 2003. Cost of Sales should be (wow)%. Net profits after taxes and miscellaneous expenses should range from (alright!)%, for the period ending May 31, 2001, to (sound the fanfare)% for the period ending May 31, 2003.
7.1 Important Assumptions
Calculations throughout this business plan have been based upon key assumptions which are summarized in the following table. The following brief glossary will explain the terms used:
Payment Days is the average number of days (30) which takes CollisionSyzygy to pay its bills.
Collection Days is the average number of days (60) needed to collect an invoice issued by CollisionSyzygy.
Tax Rate refers to the corporate tax rate used in the calculations.
Sales on Credit % (98%) is an important assumption that helps to determine the Accounts Receivable balance. This becomes part of the formula used in the Balance Sheet for the Accounts Receivable row.
Personnel burden (10%) is the sum of employer taxes and benefits paid over and above salaries on behalf of employees. This estimate is multiplied against salaries in the Personnel table. It is also factored into the Profit and Loss table.
| General Assumptions | |||
| FY 2001 | FY 2002 | FY 2003 | |
| Plan Month | 1 | 2 | 3 |
| Current Interest Rate | 12.00% | 12.00% | 12.00% |
| Long-term Interest Rate | 10.00% | 10.00% | 10.00% |
| Tax Rate | 35.00% | 35.00% | 35.00% |
| Other | 0 | 0 | 0 |
7.2 Break-even Analysis
Estimated average monthly fixed expenses, average per-unit revenue, and average variable costs were used, as shown below, by the company to determine the sales level needed per month to break even. As mentioned before, claims processing business is profitable only when high volumes are reached. The company management believes CollisionSyzygy will reach its break-even sales volume by the fourth month of operations.

| Break-even Analysis | |
| Monthly Units Break-even | 7,335 |
| Monthly Revenue Break-even | $204,148 |
| Assumptions: | |
| Average Per-Unit Revenue | $27.83 |
| Average Per-Unit Variable Cost | $4.04 |
| Estimated Monthly Fixed Cost | $174,526 |
7.3 Projected Profit and Loss
June and July, 2000 are expected to result in slight losses as CollisionSyzygy uses the venture equity to virtually retool its operation for significantly higher sales generation. A net after-tax loss for June, 2000 is estimated, with monthly after-tax profits by May 31, 2001. A jump in personnel costs, expected in January, 2001 as the new CFO and COO additions are made, reduces profits from the prior month, December, 2000.
By May 31, 2002, after-tax profits for the year should climb to nearly (yippie) on gross margin (sales after Cost of Sales) of (whoa Nellie!). After-tax profit margin should be approximately (green w/envy)%.
By May 31, 2003, after-tax profits for the year should reach (yowzah!) on gross margin of (huzzah-huzzah). An after-tax profit margin of (O-M-G)% is expected.


| Pro Forma Profit and Loss | |||
| FY 2001 | FY 2002 | FY 2003 | |
| Sales | $3,471,781 | $6,931,840 | $8,318,208 |
| Direct Cost of Sales | $503,757 | $1,056,105 | $1,330,692 |
| Other | $0 | $0 | $0 |
| Total Cost of Sales | $503,757 | $1,056,105 | $1,330,692 |
| Gross Margin | $2,968,024 | $5,875,735 | $6,987,516 |
| Gross Margin % | 85.49% | 84.76% | 84.00% |
| Expenses | |||
| Payroll | $1,393,555 | $2,433,950 | $2,806,243 |
| Sales and Marketing and Other Expenses | $444,500 | $466,725 | $490,061 |
| Depreciation | $26,904 | $26,904 | $26,904 |
| Leased Equipment | $0 | $0 | $0 |
| Utilities | $12,000 | $12,600 | $13,230 |
| Insurance | $24,000 | $25,200 | $26,460 |
| Rent | $54,000 | $56,700 | $59,535 |
| Payroll Taxes | $139,356 | $243,395 | $280,624 |
| Other | $0 | $0 | $0 |
| Total Operating Expenses | $2,094,315 | $3,265,474 | $3,703,058 |
| Profit Before Interest and Taxes | $873,709 | $2,610,261 | $3,284,459 |
| EBITDA | $900,613 | $2,637,165 | $3,311,363 |
| Interest Expense | $0 | $0 | $0 |
| Taxes Incurred | $305,798 | $913,591 | $1,149,561 |
| Net Profit | $567,911 | $1,696,670 | $2,134,898 |
| Net Profit/Sales | 16.36% | 24.48% | 25.67% |
7.4 Projected Cash Flow
After July, 2000, cash flow from operations continues an upward trend and results in a positive cash balance for the period ending May 31, 2001. The following chart illustrates monthly cash flows for June, 2000 through May 31, 2001. As the Pro Forma Cash Flow table shows, it is possible for CollisionSyzygy to have a cash balance twice the size of the net capital injection.

| Pro Forma Cash Flow | |||
| FY 2001 | FY 2002 | FY 2003 | |
| Cash Received | |||
| Cash from Operations | |||
| Cash Sales | $69,436 | $138,637 | $166,364 |
| Cash from Receivables | $2,671,342 | $5,934,512 | $7,807,786 |
| Subtotal Cash from Operations | $2,740,778 | $6,073,149 | $7,974,150 |
| Additional Cash Received | |||
| Sales Tax, VAT, HST/GST Received | $0 | $0 | $0 |
| New Current Borrowing | $0 | $0 | $0 |
| New Other Liabilities (interest-free) | $0 | $0 | $0 |
| New Long-term Liabilities | $0 | $0 | $0 |
| Sales of Other Current Assets | $0 | $0 | $0 |
| Sales of Long-term Assets | $0 | $0 | $0 |
| New Investment Received | $2,000,000 | $0 | $0 |
| Subtotal Cash Received | $4,740,778 | $6,073,149 | $7,974,150 |
| Expenditures | FY 2001 | FY 2002 | FY 2003 |
| Expenditures from Operations | |||
| Cash Spending | $1,393,555 | $2,433,950 | $2,806,243 |
| Bill Payments | $1,362,952 | $2,738,301 | $3,302,833 |
| Subtotal Spent on Operations | $2,756,507 | $5,172,251 | $6,109,076 |
| Additional Cash Spent | |||
| Sales Tax, VAT, HST/GST Paid Out | $0 | $0 | $0 |
| Principal Repayment of Current Borrowing | $0 | $0 | $0 |
| Other Liabilities Principal Repayment | $0 | $0 | $0 |
| Long-term Liabilities Principal Repayment | $0 | $0 | $0 |
| Purchase Other Current Assets | $0 | $0 | $0 |
| Purchase Long-term Assets | $134,500 | $0 | $0 |
| Dividends | $0 | $0 | $0 |
| Subtotal Cash Spent | $2,891,007 | $5,172,251 | $6,109,076 |
| Net Cash Flow | $1,849,771 | $900,898 | $1,865,074 |
| Cash Balance | $3,811,099 | $4,711,998 | $6,577,071 |
7.5 Projected Balance Sheet
The following Balance sheet shows the year-end values for 2001 through 2003. It reflects the capital contribution. The contribution is reduced by a shareholder loan, from Mr. Smith.
| Pro Forma Balance Sheet | |||
| FY 2001 | FY 2002 | FY 2003 | |
| Assets | |||
| Current Assets | |||
| Cash | $3,811,099 | $4,711,998 | $6,577,071 |
| Accounts Receivable | $861,600 | $1,720,291 | $2,064,349 |
| Other Current Assets | $0 | $0 | $0 |
| Total Current Assets | $4,672,699 | $6,432,289 | $8,641,421 |
| Long-term Assets | |||
| Long-term Assets | $326,791 | $326,791 | $326,791 |
| Accumulated Depreciation | $67,568 | $94,472 | $121,376 |
| Total Long-term Assets | $259,223 | $232,319 | $205,415 |
| Total Assets | $4,931,922 | $6,664,608 | $8,846,836 |
| Liabilities and Capital | FY 2001 | FY 2002 | FY 2003 |
| Current Liabilities | |||
| Accounts Payable | $192,010 | $228,026 | $275,356 |
| Current Borrowing | $0 | $0 | $0 |
| Other Current Liabilities | $0 | $0 | $0 |
| Subtotal Current Liabilities | $192,010 | $228,026 | $275,356 |
| Long-term Liabilities | $0 | $0 | $0 |
| Total Liabilities | $192,010 | $228,026 | $275,356 |
| Paid-in Capital | $3,907,335 | $3,907,335 | $3,907,335 |
| Retained Earnings | $264,666 | $832,577 | $2,529,247 |
| Earnings | $567,911 | $1,696,670 | $2,134,898 |
| Total Capital | $4,739,912 | $6,436,582 | $8,571,480 |
| Total Liabilities and Capital | $4,931,922 | $6,664,608 | $8,846,836 |
| Net Worth | $4,739,912 | $6,436,582 | $8,571,480 |
7.6 Business Ratios
CollisionSyzygy is virtually debt-free, making it more resistant to economic downturn.
Profitability ratios indicate strong, after-tax profit margins for the period ending May 31, 2001 to the period ending May 31, 2003. Return on equity (ROE) is also very strong for the same period range.
Activity Ratios indicate that asset turnover (sales divided by assets) should be 1.27 for the first year. Sales on credit should average approximately 16 times the average accounts receivable balance.
Liquidity of the firm’s cash position is excellent. The current ratio (short-term assets divided by short-term debt) indicate that CollisionSyzygy has short-term assets to cover each dollar of short-term debt. Furthermore, subtracting out any expected accounts receivable, the firm still has about (beaucoup bucks) for each dollar of short-term debt.
Net working capital does reflect the cash investment.
The following table summarizes the financial health of CollisionSyzygy. Industry profile ratios based on the Standard Industrial Classification (SIC) code 6411, Insurance Agents Brokers and Service, are shown for comparison.
| Ratio Analysis | ||||
| FY 2001 | FY 2002 | FY 2003 | Industry Profile | |
| Sales Growth | 106.02% | 99.66% | 20.00% | 2.40% |
| Percent of Total Assets | ||||
| Accounts Receivable | 17.47% | 25.81% | 23.33% | 26.30% |
| Other Current Assets | 0.00% | 0.00% | 0.00% | 64.30% |
| Total Current Assets | 94.74% | 96.51% | 97.68% | 90.60% |
| Long-term Assets | 5.26% | 3.49% | 2.32% | 9.40% |
| Total Assets | 100.00% | 100.00% | 100.00% | 100.00% |
| Current Liabilities | 3.89% | 3.42% | 3.11% | 48.20% |
| Long-term Liabilities | 0.00% | 0.00% | 0.00% | 9.50% |
| Total Liabilities | 3.89% | 3.42% | 3.11% | 57.70% |
| Net Worth | 96.11% | 96.58% | 96.89% | 42.30% |
| Percent of Sales | ||||
| Sales | 100.00% | 100.00% | 100.00% | 100.00% |
| Gross Margin | 85.49% | 84.76% | 84.00% | 100.00% |
| Selling, General & Administrative Expenses | 69.13% | 60.29% | 58.34% | 60.10% |
| Advertising Expenses | 10.73% | 5.64% | 4.94% | 1.70% |
| Profit Before Interest and Taxes | 25.17% | 37.66% | 39.49% | 5.20% |
| Main Ratios | ||||
| Current | 24.34 | 28.21 | 31.38 | 1.66 |
| Quick | 24.34 | 28.21 | 31.38 | 1.45 |
| Total Debt to Total Assets | 3.89% | 3.42% | 3.11% | 57.70% |
| Pre-tax Return on Net Worth | 18.43% | 40.55% | 38.32% | 5.80% |
| Pre-tax Return on Assets | 17.72% | 39.17% | 37.13% | 13.70% |
| Additional Ratios | FY 2001 | FY 2002 | FY 2003 | |
| Net Profit Margin | 16.36% | 24.48% | 25.67% | n.a |
| Return on Equity | 11.98% | 26.36% | 24.91% | n.a |
| Activity Ratios | ||||
| Accounts Receivable Turnover | 3.95 | 3.95 | 3.95 | n.a |
| Collection Days | 56 | 69 | 85 | n.a |
| Accounts Payable Turnover | 7.73 | 12.17 | 12.17 | n.a |
| Payment Days | 28 | 28 | 27 | n.a |
| Total Asset Turnover | 0.70 | 1.04 | 0.94 | n.a |
| Debt Ratios | ||||
| Debt to Net Worth | 0.04 | 0.04 | 0.03 | n.a |
| Current Liab. to Liab. | 1.00 | 1.00 | 1.00 | n.a |
| Liquidity Ratios | ||||
| Net Working Capital | $4,480,689 | $6,204,263 | $8,366,065 | n.a |
| Interest Coverage | 0.00 | 0.00 | 0.00 | n.a |
| Additional Ratios | ||||
| Assets to Sales | 1.42 | 0.96 | 1.06 | n.a |
| Current Debt/Total Assets | 4% | 3% | 3% | n.a |
| Acid Test | 19.85 | 20.66 | 23.89 | n.a |
| Sales/Net Worth | 0.73 | 1.08 | 0.97 | n.a |
| Dividend Payout | 0.00 | 0.00 | 0.00 | n.a |
Appendix
| Sales Forecast | |||||||||||||
| Jun | Jul | Aug | Sep | Oct | Nov | Dec | Jan | Feb | Mar | Apr | May | ||
| Unit Sales | |||||||||||||
| Salvage Fees – Insurance Co. | 0% | 400 | 447 | 500 | 559 | 625 | 699 | 782 | 874 | 977 | 1,092 | 1,221 | 1,364 |
| Salvage Fees – Buyer | 0% | 400 | 447 | 500 | 559 | 625 | 699 | 782 | 874 | 977 | 1,092 | 1,221 | 1,364 |
| Claim Handling Fees-Ins. Co. @ $45 | 0% | 600 | 642 | 687 | 735 | 787 | 842 | 901 | 964 | 1,032 | 1,104 | 1,181 | 1,265 |
| Claim Handling Fees-Ins. Co. @ $50 | 0% | 500 | 532 | 566 | 602 | 641 | 682 | 726 | 772 | 822 | 875 | 931 | 990 |
| Claim Handling Fees-Ins. Co. @ $70 | 0% | 400 | 418 | 437 | 456 | 477 | 498 | 520 | 544 | 568 | 593 | 619 | 650 |
| Referral Fees – Service Shops @ $5 | 0% | 300 | 343 | 392 | 448 | 512 | 586 | 669 | 765 | 875 | 1,000 | 1,144 | 1,306 |
| Referral Fees – Service Shops @ $30 | 0% | 600 | 689 | 791 | 908 | 1,043 | 1,198 | 1,376 | 1,580 | 1,814 | 2,083 | 2,392 | 2,746 |
| DRP Appraiser Fees @ $65 | 0% | 75 | 84 | 94 | 105 | 118 | 132 | 147 | 165 | 185 | 206 | 231 | 259 |
| DRP Appraiser Fees @ $70 | 0% | 125 | 143 | 164 | 188 | 216 | 248 | 284 | 326 | 374 | 429 | 491 | 563 |
| Dispatch Fees | 0% | 2,000 | 2,246 | 2,523 | 2,833 | 3,182 | 3,574 | 4,014 | 4,508 | 5,063 | 5,686 | 6,386 | 7,172 |
| Other | 0% | 0 | 0 | 0 | 0 | 0 | 0 | 0 | 0 | 0 | 0 | 0 | 0 |
| Total Unit Sales | 5,400 | 5,992 | 6,654 | 7,396 | 8,226 | 9,157 | 10,200 | 11,371 | 12,685 | 14,160 | 15,817 | 17,680 | |
| Unit Prices | Jun | Jul | Aug | Sep | Oct | Nov | Dec | Jan | Feb | Mar | Apr | May | |
| Salvage Fees – Insurance Co. | $50.00 | $50.00 | $50.00 | $50.00 | $50.00 | $50.00 | $50.00 | $50.00 | $50.00 | $50.00 | $50.00 | $50.00 | |
| Salvage Fees – Buyer | $50.00 | $50.00 | $50.00 | $50.00 | $50.00 | $50.00 | $50.00 | $50.00 | $50.00 | $50.00 | $50.00 | $50.00 | |
| Claim Handling Fees-Ins. Co. @ $45 | $45.00 | $45.00 | $45.00 | $45.00 | $45.00 | $45.00 | $45.00 | $45.00 | $45.00 | $45.00 | $45.00 | $45.00 | |
| Claim Handling Fees-Ins. Co. @ $50 | $50.00 | $50.00 | $50.00 | $50.00 | $50.00 | $50.00 | $50.00 | $50.00 | $50.00 | $50.00 | $50.00 | $50.00 | |
| Claim Handling Fees-Ins. Co. @ $70 | $70.00 | $70.00 | $70.00 | $70.00 | $70.00 | $70.00 | $70.00 | $70.00 | $70.00 | $70.00 | $70.00 | $70.00 | |
| Referral Fees – Service Shops @ $5 | $5.00 | $5.00 | $5.00 | $5.00 | $5.00 | $5.00 | $5.00 | $5.00 | $5.00 | $5.00 | $5.00 | $5.00 | |
| Referral Fees – Service Shops @ $30 | $30.00 | $30.00 | $30.00 | $30.00 | $30.00 | $30.00 | $30.00 | $30.00 | $30.00 | $30.00 | $30.00 | $30.00 | |
| DRP Appraiser Fees @ $65 | $65.00 | $65.00 | $65.00 | $65.00 | $65.00 | $65.00 | $65.00 | $65.00 | $65.00 | $65.00 | $65.00 | $65.00 | |
| DRP Appraiser Fees @ $70 | $70.00 | $70.00 | $70.00 | $70.00 | $70.00 | $70.00 | $70.00 | $70.00 | $70.00 | $70.00 | $70.00 | $70.00 | |
| Dispatch Fees | $5.00 | $5.00 | $5.00 | $5.00 | $5.00 | $5.00 | $5.00 | $5.00 | $5.00 | $5.00 | $5.00 | $5.00 | |
| Other | $0.00 | $0.00 | $0.00 | $0.00 | $0.00 | $0.00 | $0.00 | $0.00 | $0.00 | $0.00 | $0.00 | $0.00 | |
| Sales | |||||||||||||
| Salvage Fees – Insurance Co. | $20,000 | $22,362 | $25,003 | $27,956 | $31,257 | $34,949 | $39,076 | $43,691 | $48,851 | $54,621 | $61,050 | $68,200 | |
| Salvage Fees – Buyer | $20,000 | $22,362 | $25,003 | $27,956 | $31,257 | $34,949 | $39,076 | $43,691 | $48,851 | $54,621 | $61,050 | $68,200 | |
| Claim Handling Fees-Ins. Co. @ $45 | $27,000 | $28,893 | $30,918 | $33,085 | $35,405 | $37,887 | $40,542 | $43,384 | $46,426 | $49,680 | $53,163 | $56,925 | |
| Claim Handling Fees-Ins. Co. @ $50 | $25,000 | $26,602 | $28,308 | $30,122 | $32,053 | $34,108 | $36,294 | $38,620 | $41,096 | $43,730 | $46,533 | $49,516 | |
| Claim Handling Fees-Ins. Co. @ $70 | $28,000 | $29,254 | $30,565 | $31,934 | $33,365 | $34,860 | $36,421 | $38,053 | $39,758 | $41,539 | $43,330 | $45,500 | |
| Referral Fees – Service Shops @ $5 | $1,500 | $1,715 | $1,960 | $2,240 | $2,561 | $2,928 | $3,347 | $3,825 | $4,373 | $4,999 | $5,720 | $6,532 | |
| Referral Fees – Service Shops @ $30 | $18,000 | $20,669 | $23,735 | $27,255 | $31,296 | $35,938 | $41,267 | $47,387 | $54,415 | $62,484 | $71,751 | $82,391 | |
| DRP Appraiser Fees @ $65 | $4,875 | $5,456 | $6,105 | $6,833 | $7,646 | $8,557 | $9,576 | $10,717 | $11,993 | $13,421 | $15,020 | $16,809 | |
| DRP Appraiser Fees @ $70 | $8,750 | $10,034 | $11,506 | $13,193 | $15,129 | $17,348 | $19,893 | $22,812 | $26,158 | $29,996 | $34,396 | $39,442 | |
| Dispatch Fees | $10,000 | $11,231 | $12,614 | $14,166 | $15,910 | $17,869 | $20,068 | $22,539 | $25,313 | $28,429 | $31,929 | $35,859 | |
| Other | $0 | $0 | $0 | $0 | $0 | $0 | $0 | $0 | $0 | $0 | $0 | $0 | |
| Total Sales | $163,125 | $178,578 | $195,716 | $214,741 | $235,880 | $259,391 | $285,562 | $314,720 | $347,234 | $383,519 | $423,941 | $469,374 | |
| Direct Unit Costs | Jun | Jul | Aug | Sep | Oct | Nov | Dec | Jan | Feb | Mar | Apr | May | |
| Salvage Fees – Insurance Co. | 0.00% | $7.26 | $7.26 | $7.26 | $7.26 | $7.26 | $7.26 | $7.26 | $7.26 | $7.26 | $7.26 | $7.26 | $7.26 |
| Salvage Fees – Buyer | 0.00% | $7.26 | $7.26 | $7.26 | $7.26 | $7.26 | $7.26 | $7.26 | $7.26 | $7.26 | $7.26 | $7.26 | $7.26 |
| Claim Handling Fees-Ins. Co. @ $45 | 0.00% | $6.53 | $6.53 | $6.53 | $6.53 | $6.53 | $6.53 | $6.53 | $6.53 | $6.53 | $6.53 | $6.53 | $6.53 |
| Claim Handling Fees-Ins. Co. @ $50 | 0.00% | $7.26 | $7.26 | $7.26 | $7.26 | $7.26 | $7.26 | $7.26 | $7.26 | $7.26 | $7.26 | $7.26 | $7.26 |
| Claim Handling Fees-Ins. Co. @ $70 | 0.00% | $10.16 | $10.16 | $10.16 | $10.16 | $10.16 | $10.16 | $10.16 | $10.16 | $10.16 | $10.16 | $10.16 | $10.16 |
| Referral Fees – Service Shops @ $5 | 0.00% | $0.73 | $0.73 | $0.73 | $0.73 | $0.73 | $0.73 | $0.73 | $0.73 | $0.73 | $0.73 | $0.73 | $0.73 |
| Referral Fees – Service Shops @ $30 | 0.00% | $4.35 | $4.35 | $4.35 | $4.35 | $4.35 | $4.35 | $4.35 | $4.35 | $4.35 | $4.35 | $4.35 | $4.35 |
| DRP Appraiser Fees @ $65 | 0.00% | $9.43 | $9.43 | $9.43 | $9.43 | $9.43 | $9.43 | $9.43 | $9.43 | $9.43 | $9.43 | $9.43 | $9.43 |
| DRP Appraiser Fees @ $70 | 0.00% | $10.16 | $10.16 | $10.16 | $10.16 | $10.16 | $10.16 | $10.16 | $10.16 | $10.16 | $10.16 | $10.16 | $10.16 |
| Dispatch Fees | 0.00% | $0.73 | $0.73 | $0.73 | $0.73 | $0.73 | $0.73 | $0.73 | $0.73 | $0.73 | $0.73 | $0.73 | $0.73 |
| Other | 0.00% | $0.00 | $0.00 | $0.00 | $0.00 | $0.00 | $0.00 | $0.00 | $0.00 | $0.00 | $0.00 | $0.00 | $0.00 |
| Direct Cost of Sales | |||||||||||||
| Salvage Fees – Insurance Co. | $2,902 | $3,245 | $3,628 | $4,056 | $4,535 | $5,071 | $5,670 | $6,340 | $7,088 | $7,925 | $8,858 | $9,896 | |
| Salvage Fees – Buyer | $2,902 | $3,245 | $3,628 | $4,056 | $4,535 | $5,071 | $5,670 | $6,340 | $7,088 | $7,925 | $8,858 | $9,896 | |
| Claim Handling Fees-Ins. Co. @ $45 | $3,918 | $4,192 | $4,486 | $4,801 | $5,137 | $5,497 | $5,883 | $6,295 | $6,736 | $7,209 | $7,714 | $8,260 | |
| Claim Handling Fees-Ins. Co. @ $50 | $3,628 | $3,860 | $4,107 | $4,371 | $4,651 | $4,949 | $5,266 | $5,604 | $5,963 | $6,345 | $6,752 | $7,185 | |
| Claim Handling Fees-Ins. Co. @ $70 | $4,063 | $4,245 | $4,435 | $4,634 | $4,841 | $5,058 | $5,285 | $5,522 | $5,769 | $6,027 | $6,287 | $6,602 | |
| Referral Fees – Service Shops @ $5 | $218 | $249 | $284 | $325 | $372 | $425 | $486 | $555 | $635 | $725 | $830 | $948 | |
| Referral Fees – Service Shops @ $30 | $2,612 | $2,999 | $3,444 | $3,955 | $4,541 | $5,215 | $5,988 | $6,876 | $7,896 | $9,067 | $10,411 | $11,955 | |
| DRP Appraiser Fees @ $65 | $707 | $792 | $886 | $991 | $1,109 | $1,242 | $1,389 | $1,555 | $1,740 | $1,947 | $2,179 | $2,439 | |
| DRP Appraiser Fees @ $70 | $1,270 | $1,456 | $1,669 | $1,914 | $2,195 | $2,517 | $2,887 | $3,310 | $3,796 | $4,352 | $4,991 | $5,723 | |
| Dispatch Fees | $1,451 | $1,630 | $1,830 | $2,056 | $2,309 | $2,593 | $2,912 | $3,270 | $3,673 | $4,125 | $4,633 | $5,203 | |
| Other | $0 | $0 | $0 | $0 | $0 | $0 | $0 | $0 | $0 | $0 | $0 | $0 | |
| Subtotal Direct Cost of Sales | $23,670 | $25,912 | $28,398 | $31,159 | $34,226 | $37,638 | $41,435 | $45,666 | $50,384 | $55,649 | $61,514 | $68,106 | |
| Personnel Plan | |||||||||||||
| Jun | Jul | Aug | Sep | Oct | Nov | Dec | Jan | Feb | Mar | Apr | May | ||
| President | 0% | $10,000 | $10,000 | $10,000 | $10,000 | $10,000 | $10,000 | $10,000 | $10,000 | $10,000 | $10,000 | $10,000 | $10,000 |
| Vice-President Operations | 0% | $7,083 | $7,083 | $7,083 | $7,083 | $7,083 | $7,083 | $7,083 | $7,083 | $7,084 | $7,084 | $7,084 | $7,084 |
| Vice-President Administration | 0% | $7,083 | $7,083 | $7,083 | $7,083 | $7,083 | $7,083 | $7,083 | $7,083 | $7,084 | $7,084 | $7,084 | $7,084 |
| IS Manager | 0% | $7,083 | $7,083 | $7,083 | $7,083 | $7,083 | $7,083 | $7,083 | $7,083 | $7,084 | $7,084 | $7,084 | $7,084 |
| CFO | 0% | $0 | $0 | $0 | $0 | $0 | $0 | $0 | $8,333 | $8,333 | $8,333 | $8,333 | $8,333 |
| COO | 0% | $0 | $0 | $0 | $0 | $0 | $0 | $0 | $8,333 | $8,333 | $8,333 | $8,333 | $8,333 |
| Software Developers (2) | 0% | $12,500 | $12,500 | $12,500 | $12,500 | $12,500 | $12,500 | $12,500 | $12,500 | $12,500 | $12,500 | $12,500 | $12,500 |
| Staff Appraisers (Total) | 0% | $26,667 | $26,667 | $26,667 | $26,667 | $26,667 | $26,667 | $26,667 | $26,667 | $26,667 | $26,667 | $26,667 | $26,667 |
| Customer Service Rep’s (Total) | 0% | $13,500 | $13,500 | $13,500 | $13,500 | $13,500 | $13,500 | $13,500 | $13,500 | $13,500 | $13,500 | $13,500 | $13,500 |
| Marketing Rep’s (Total) | 0% | $8,333 | $8,333 | $8,333 | $8,333 | $8,333 | $8,333 | $8,333 | $8,333 | $8,333 | $8,333 | $8,333 | $8,333 |
| Marketing Rep 10% x Net Income Bonus | 0% | $11,380 | $11,380 | $11,380 | $11,380 | $11,380 | $11,380 | $11,380 | $11,380 | $11,380 | $11,380 | $11,380 | $11,380 |
| Operations Manager | 0% | $0 | $0 | $0 | $0 | $0 | $0 | $0 | $7,083 | $7,083 | $7,083 | $7,083 | $7,083 |
| Administrative Manager | 0% | $0 | $0 | $0 | $0 | $0 | $0 | $0 | $6,250 | $6,250 | $6,250 | $6,250 | $6,250 |
| Total People | 22 | 22 | 22 | 22 | 22 | 22 | 22 | 24 | 24 | 24 | 24 | 24 | |
| Total Payroll | $103,629 | $103,629 | $103,629 | $103,629 | $103,629 | $103,629 | $103,629 | $133,628 | $133,631 | $133,631 | $133,631 | $133,631 | |
| General Assumptions | |||||||||||||
| Jun | Jul | Aug | Sep | Oct | Nov | Dec | Jan | Feb | Mar | Apr | May | ||
| Plan Month | 1 | 2 | 3 | 4 | 5 | 6 | 7 | 8 | 9 | 10 | 11 | 12 | |
| Current Interest Rate | 12.00% | 12.00% | 12.00% | 12.00% | 12.00% | 12.00% | 12.00% | 12.00% | 12.00% | 12.00% | 12.00% | 12.00% | |
| Long-term Interest Rate | 10.00% | 10.00% | 10.00% | 10.00% | 10.00% | 10.00% | 10.00% | 10.00% | 10.00% | 10.00% | 10.00% | 10.00% | |
| Tax Rate | 35.00% | 35.00% | 35.00% | 35.00% | 35.00% | 35.00% | 35.00% | 35.00% | 35.00% | 35.00% | 35.00% | 35.00% | |
| Other | 0 | 0 | 0 | 0 | 0 | 0 | 0 | 0 | 0 | 0 | 0 | 0 | |
| Pro Forma Profit and Loss | |||||||||||||
| Jun | Jul | Aug | Sep | Oct | Nov | Dec | Jan | Feb | Mar | Apr | May | ||
| Sales | $163,125 | $178,578 | $195,716 | $214,741 | $235,880 | $259,391 | $285,562 | $314,720 | $347,234 | $383,519 | $423,941 | $469,374 | |
| Direct Cost of Sales | $23,670 | $25,912 | $28,398 | $31,159 | $34,226 | $37,638 | $41,435 | $45,666 | $50,384 | $55,649 | $61,514 | $68,106 | |
| Other | $0 | $0 | $0 | $0 | $0 | $0 | $0 | $0 | $0 | $0 | $0 | $0 | |
| Total Cost of Sales | $23,670 | $25,912 | $28,398 | $31,159 | $34,226 | $37,638 | $41,435 | $45,666 | $50,384 | $55,649 | $61,514 | $68,106 | |
| Gross Margin | $139,455 | $152,666 | $167,317 | $183,582 | $201,654 | $221,753 | $244,127 | $269,054 | $296,850 | $327,871 | $362,427 | $401,267 | |
| Gross Margin % | 85.49% | 85.49% | 85.49% | 85.49% | 85.49% | 85.49% | 85.49% | 85.49% | 85.49% | 85.49% | 85.49% | 85.49% | |
| Expenses | |||||||||||||
| Payroll | $103,629 | $103,629 | $103,629 | $103,629 | $103,629 | $103,629 | $103,629 | $133,628 | $133,631 | $133,631 | $133,631 | $133,631 | |
| Sales and Marketing and Other Expenses | $37,042 | $37,042 | $37,042 | $37,042 | $37,042 | $37,042 | $37,042 | $37,042 | $37,042 | $37,042 | $37,040 | $37,040 | |
| Depreciation | $2,242 | $2,242 | $2,242 | $2,242 | $2,242 | $2,242 | $2,242 | $2,242 | $2,242 | $2,242 | $2,242 | $2,242 | |
| Leased Equipment | $0 | $0 | $0 | $0 | $0 | $0 | $0 | $0 | $0 | $0 | $0 | $0 | |
| Utilities | $1,000 | $1,000 | $1,000 | $1,000 | $1,000 | $1,000 | $1,000 | $1,000 | $1,000 | $1,000 | $1,000 | $1,000 | |
| Insurance | $2,000 | $2,000 | $2,000 | $2,000 | $2,000 | $2,000 | $2,000 | $2,000 | $2,000 | $2,000 | $2,000 | $2,000 | |
| Rent | $4,500 | $4,500 | $4,500 | $4,500 | $4,500 | $4,500 | $4,500 | $4,500 | $4,500 | $4,500 | $4,500 | $4,500 | |
| Payroll Taxes | 10% | $10,363 | $10,363 | $10,363 | $10,363 | $10,363 | $10,363 | $10,363 | $13,363 | $13,363 | $13,363 | $13,363 | $13,363 |
| Other | $0 | $0 | $0 | $0 | $0 | $0 | $0 | $0 | $0 | $0 | $0 | $0 | |
| Total Operating Expenses | $160,776 | $160,776 | $160,776 | $160,776 | $160,776 | $160,776 | $160,776 | $193,775 | $193,778 | $193,778 | $193,776 | $193,776 | |
| Profit Before Interest and Taxes | ($21,320) | ($8,110) | $6,541 | $22,806 | $40,878 | $60,977 | $83,351 | $75,279 | $103,072 | $134,092 | $168,651 | $207,491 | |
| EBITDA | ($19,078) | ($5,868) | $8,783 | $25,048 | $43,120 | $63,219 | $85,593 | $77,521 | $105,314 | $136,334 | $170,893 | $209,733 | |
| Interest Expense | $0 | $0 | $0 | $0 | $0 | $0 | $0 | $0 | $0 | $0 | $0 | $0 | |
| Taxes Incurred | ($7,462) | ($2,838) | $2,290 | $7,982 | $14,307 | $21,342 | $29,173 | $26,348 | $36,075 | $46,932 | $59,028 | $72,622 | |
| Net Profit | ($13,858) | ($5,271) | $4,252 | $14,824 | $26,571 | $39,635 | $54,178 | $48,931 | $66,997 | $87,160 | $109,623 | $134,869 | |
| Net Profit/Sales | -8.50% | -2.95% | 2.17% | 6.90% | 11.26% | 15.28% | 18.97% | 15.55% | 19.29% | 22.73% | 25.86% | 28.73% | |
| Pro Forma Cash Flow | |||||||||||||
| Jun | Jul | Aug | Sep | Oct | Nov | Dec | Jan | Feb | Mar | Apr | May | ||
| Cash Received | |||||||||||||
| Cash from Operations | |||||||||||||
| Cash Sales | $3,263 | $3,572 | $3,914 | $4,295 | $4,718 | $5,188 | $5,711 | $6,294 | $6,945 | $7,670 | $8,479 | $9,387 | |
| Cash from Receivables | $65,299 | $70,627 | $160,367 | $175,566 | $192,423 | $211,137 | $231,931 | $255,058 | $280,803 | $309,488 | $341,474 | $377,170 | |
| Subtotal Cash from Operations | $68,561 | $74,199 | $164,282 | $179,861 | $197,141 | $216,324 | $237,642 | $261,352 | $287,748 | $317,158 | $349,953 | $386,557 | |
| Additional Cash Received | |||||||||||||
| Sales Tax, VAT, HST/GST Received | 0.00% | $0 | $0 | $0 | $0 | $0 | $0 | $0 | $0 | $0 | $0 | $0 | $0 |
| New Current Borrowing | $0 | $0 | $0 | $0 | $0 | $0 | $0 | $0 | $0 | $0 | $0 | $0 | |
| New Other Liabilities (interest-free) | $0 | $0 | $0 | $0 | $0 | $0 | $0 | $0 | $0 | $0 | $0 | $0 | |
| New Long-term Liabilities | $0 | $0 | $0 | $0 | $0 | $0 | $0 | $0 | $0 | $0 | $0 | $0 | |
| Sales of Other Current Assets | $0 | $0 | $0 | $0 | $0 | $0 | $0 | $0 | $0 | $0 | $0 | $0 | |
| Sales of Long-term Assets | $0 | $0 | $0 | $0 | $0 | $0 | $0 | $0 | $0 | $0 | $0 | $0 | |
| New Investment Received | $2,000,000 | $0 | $0 | $0 | $0 | $0 | $0 | $0 | $0 | $0 | $0 | $0 | |
| Subtotal Cash Received | $2,068,561 | $74,199 | $164,282 | $179,861 | $197,141 | $216,324 | $237,642 | $261,352 | $287,748 | $317,158 | $349,953 | $386,557 | |
| Expenditures | Jun | Jul | Aug | Sep | Oct | Nov | Dec | Jan | Feb | Mar | Apr | May | |
| Expenditures from Operations | |||||||||||||
| Cash Spending | $103,629 | $103,629 | $103,629 | $103,629 | $103,629 | $103,629 | $103,629 | $133,628 | $133,631 | $133,631 | $133,631 | $133,631 | |
| Bill Payments | $73,921 | $71,341 | $78,232 | $85,875 | $94,359 | $103,787 | $114,272 | $125,660 | $130,400 | $144,901 | $161,085 | $179,118 | |
| Subtotal Spent on Operations | $177,550 | $174,970 | $181,861 | $189,504 | $197,988 | $207,416 | $217,901 | $259,288 | $264,031 | $278,532 | $294,716 | $312,749 | |
| Additional Cash Spent | |||||||||||||
| Sales Tax, VAT, HST/GST Paid Out | $0 | $0 | $0 | $0 | $0 | $0 | $0 | $0 | $0 | $0 | $0 | $0 | |
| Principal Repayment of Current Borrowing | $0 | $0 | $0 | $0 | $0 | $0 | $0 | $0 | $0 | $0 | $0 | $0 | |
| Other Liabilities Principal Repayment | $0 | $0 | $0 | $0 | $0 | $0 | $0 | $0 | $0 | $0 | $0 | $0 | |
| Long-term Liabilities Principal Repayment | $0 | $0 | $0 | $0 | $0 | $0 | $0 | $0 | $0 | $0 | $0 | $0 | |
| Purchase Other Current Assets | $0 | $0 | $0 | $0 | $0 | $0 | $0 | $0 | $0 | $0 | $0 | $0 | |
| Purchase Long-term Assets | $134,500 | $0 | $0 | $0 | $0 | $0 | $0 | $0 | $0 | $0 | $0 | $0 | |
| Dividends | $0 | $0 | $0 | $0 | $0 | $0 | $0 | $0 | $0 | $0 | $0 | $0 | |
| Subtotal Cash Spent | $312,050 | $174,970 | $181,861 | $189,504 | $197,988 | $207,416 | $217,901 | $259,288 | $264,031 | $278,532 | $294,716 | $312,749 | |
| Net Cash Flow | $1,756,511 | ($100,771) | ($17,579) | ($9,643) | ($847) | $8,909 | $19,741 | $2,065 | $23,717 | $38,626 | $55,237 | $73,808 | |
| Cash Balance | $3,717,839 | $3,617,067 | $3,599,488 | $3,589,845 | $3,588,998 | $3,597,906 | $3,617,647 | $3,619,712 | $3,643,428 | $3,682,054 | $3,737,291 | $3,811,099 | |
| Pro Forma Balance Sheet | |||||||||||||
| Jun | Jul | Aug | Sep | Oct | Nov | Dec | Jan | Feb | Mar | Apr | May | ||
| Assets | Starting Balances | ||||||||||||
| Current Assets | |||||||||||||
| Cash | $1,961,328 | $3,717,839 | $3,617,067 | $3,599,488 | $3,589,845 | $3,588,998 | $3,597,906 | $3,617,647 | $3,619,712 | $3,643,428 | $3,682,054 | $3,737,291 | $3,811,099 |
| Accounts Receivable | $130,597 | $225,161 | $329,540 | $360,974 | $395,854 | $434,594 | $477,660 | $525,580 | $578,948 | $638,434 | $704,795 | $778,783 | $861,600 |
| Other Current Assets | $0 | $0 | $0 | $0 | $0 | $0 | $0 | $0 | $0 | $0 | $0 | $0 | $0 |
| Total Current Assets | $2,091,925 | $3,943,000 | $3,946,607 | $3,960,462 | $3,985,699 | $4,023,592 | $4,075,567 | $4,143,227 | $4,198,660 | $4,281,862 | $4,386,849 | $4,516,075 | $4,672,699 |
| Long-term Assets | |||||||||||||
| Long-term Assets | $192,291 | $326,791 | $326,791 | $326,791 | $326,791 | $326,791 | $326,791 | $326,791 | $326,791 | $326,791 | $326,791 | $326,791 | $326,791 |
| Accumulated Depreciation | $40,664 | $42,906 | $45,148 | $47,390 | $49,632 | $51,874 | $54,116 | $56,358 | $58,600 | $60,842 | $63,084 | $65,326 | $67,568 |
| Total Long-term Assets | $151,627 | $283,885 | $281,643 | $279,401 | $277,159 | $274,917 | $272,675 | $270,433 | $268,191 | $265,949 | $263,707 | $261,465 | $259,223 |
| Total Assets | $2,243,552 | $4,226,885 | $4,228,250 | $4,239,863 | $4,262,858 | $4,298,509 | $4,348,242 | $4,413,660 | $4,466,851 | $4,547,811 | $4,650,556 | $4,777,540 | $4,931,922 |
| Liabilities and Capital | Jun | Jul | Aug | Sep | Oct | Nov | Dec | Jan | Feb | Mar | Apr | May | |
| Current Liabilities | |||||||||||||
| Accounts Payable | $71,551 | $68,742 | $75,379 | $82,740 | $90,911 | $99,991 | $110,089 | $121,329 | $125,588 | $139,552 | $155,137 | $172,497 | $192,010 |
| Current Borrowing | $0 | $0 | $0 | $0 | $0 | $0 | $0 | $0 | $0 | $0 | $0 | $0 | $0 |
| Other Current Liabilities | $0 | $0 | $0 | $0 | $0 | $0 | $0 | $0 | $0 | $0 | $0 | $0 | $0 |
| Subtotal Current Liabilities | $71,551 | $68,742 | $75,379 | $82,740 | $90,911 | $99,991 | $110,089 | $121,329 | $125,588 | $139,552 | $155,137 | $172,497 | $192,010 |
| Long-term Liabilities | $0 | $0 | $0 | $0 | $0 | $0 | $0 | $0 | $0 | $0 | $0 | $0 | $0 |
| Total Liabilities | $71,551 | $68,742 | $75,379 | $82,740 | $90,911 | $99,991 | $110,089 | $121,329 | $125,588 | $139,552 | $155,137 | $172,497 | $192,010 |
| Paid-in Capital | $1,907,335 | $3,907,335 | $3,907,335 | $3,907,335 | $3,907,335 | $3,907,335 | $3,907,335 | $3,907,335 | $3,907,335 | $3,907,335 | $3,907,335 | $3,907,335 | $3,907,335 |
| Retained Earnings | $144,336 | $264,666 | $264,666 | $264,666 | $264,666 | $264,666 | $264,666 | $264,666 | $264,666 | $264,666 | $264,666 | $264,666 | $264,666 |
| Earnings | $120,330 | ($13,858) | ($19,130) | ($14,878) | ($54) | $26,517 | $66,152 | $120,330 | $169,262 | $236,258 | $323,418 | $433,042 | $567,911 |
| Total Capital | $2,172,001 | $4,158,143 | $4,152,871 | $4,157,123 | $4,171,947 | $4,198,518 | $4,238,153 | $4,292,331 | $4,341,263 | $4,408,259 | $4,495,419 | $4,605,043 | $4,739,912 |
| Total Liabilities and Capital | $2,243,552 | $4,226,885 | $4,228,250 | $4,239,863 | $4,262,858 | $4,298,509 | $4,348,242 | $4,413,660 | $4,466,851 | $4,547,811 | $4,650,556 | $4,777,540 | $4,931,922 |
| Net Worth | $2,172,001 | $4,158,143 | $4,152,871 | $4,157,123 | $4,171,947 | $4,198,518 | $4,238,153 | $4,292,331 | $4,341,263 | $4,408,259 | $4,495,419 | $4,605,043 | $4,739,912 |


