
Portland Mobile Auto Inspectors
Executive Summary
Portland Mobile Auto Inspectors is a mobile car inspection service for prospective used car buyers practicing due diligence. Portland Mobile Auto Inspectors travels around Metropolitan Portland with all of the necessary test equipment to inspect used cars. Service calls are made by appointment during the day, evenings, as well as weekends. All a customer needs to do is schedule an appointment and meet the Portland Mobile Auto Inspectors at the place where the vehicle currently is. Within one to one-and-a-half hours the inspection is complete and the customer is given a detailed custom printout that indicates the tests performed and the results, thereby indicating the condition of the vehicle.
Portland Mobile Auto Inspectors will eliminate the current dilemma that used car purchasers face of mechanics offering inspections during normal business hours which are not accessible to most people who work during the day.
Portland Mobile Auto Inspectors, a sole proprietorship, is forecasted to reach profitability by month six and will generate $93,000 in revenues by year three.
1.1 Objectives
The objectives for the first three years of operation include:
- To create a service-based company whose primary goal is to exceed customer’s expectations.
- To increase the customer base by 20% per year.
- To develop a sustainable start-up business.
1.2 Mission
Portland Mobile Auto Inspectors’ mission is to provide customers with convenient, thorough, used car inspections. We exist to attract and maintain customers. When we adhere to this maxim, everything else will fall into place. Our services will exceed the expectations of our customers.
1.3 Keys to Success
The keys to success will be providing a service that is in demand and will exceed customer’s expectations.
Company Summary
Portland Mobile Auto Inspectors is a mobile used car inspection service. Portland Mobile Auto Inspectors will inspect a used car to determine the actual condition of the car, not the stated condition. This information will be invaluable for the used car purchaser. This service will give the purchaser piece of mind when purchasing a used car, whether from a private seller or a dealer. Portland Mobile Auto Inspectors can travel to wherever the car is within Metropolitan Portland.
2.1 Company Ownership
Portland Mobile Auto Inspectors will be a sole proprietorship founded and owned by Dan Jalopee.
2.2 Start-up Summary
Portland Mobile Auto Inspectors will incur the following start-up costs:
- A laptop computer system with portable printer, car adaptor, Microsoft Office and QuickBooks Pro.
- Company van.
- Portable hydraulic lift and wheel ramps.
- Brake disc vernier caliper.
- Coolant system temperature gauge.
- Diagnostic engine analyzer.
| Start-up Funding | |
| Start-up Expenses to Fund | $1,500 |
| Start-up Assets to Fund | $30,500 |
| Total Funding Required | $32,000 |
| Assets | |
| Non-cash Assets from Start-up | $19,000 |
| Cash Requirements from Start-up | $11,500 |
| Additional Cash Raised | $0 |
| Cash Balance on Starting Date | $11,500 |
| Total Assets | $30,500 |
| Liabilities and Capital | |
| Liabilities | |
| Current Borrowing | $0 |
| Long-term Liabilities | $0 |
| Accounts Payable (Outstanding Bills) | $0 |
| Other Current Liabilities (interest-free) | $0 |
| Total Liabilities | $0 |
| Capital | |
| Planned Investment | |
| Dan | $32,000 |
| Investor 2 | $0 |
| Other | $0 |
| Additional Investment Requirement | $0 |
| Total Planned Investment | $32,000 |
| Loss at Start-up (Start-up Expenses) | ($1,500) |
| Total Capital | $30,500 |
| Total Capital and Liabilities | $30,500 |
| Total Funding | $32,000 |
| Start-up | |
| Requirements | |
| Start-up Expenses | |
| Legal | $500 |
| Website development | $1,000 |
| Research and Development | $0 |
| Expensed Equipment | $0 |
| Other | $0 |
| Total Start-up Expenses | $1,500 |
| Start-up Assets | |
| Cash Required | $11,500 |
| Other Current Assets | $0 |
| Long-term Assets | $19,000 |
| Total Assets | $30,500 |
| Total Requirements | $32,000 |
Services
Portland Mobile Auto Inspectors will offer the following tests for a used car inspection:
Cranking History Test:
This is a test for the strength of the battery. A battery reading above 9.60 volts would indicate a good battery. Alternator amp readings show the alternators ability, or inability, to keep the battery charged.
Electronic Compression Test:
This test shows engine cylinder compression (power) uniformity. Good compression is shown by a high % number with all readings being within a 10% range.
Ignition Primary Test:
This test looks for bad primary components such as the ignition coil.
Spark Burn Analysis Test:
This test looks for bad secondary components such as ignition wires and distributor caps. 0.8 to 2.3 burn time milliseconds is the typical range limits. Short burn times could be caused by breaks in ignition wires, a worn rotor button, etc. Long burn times could be from fouled spark plugs, a rich fuel mixture, etc.
Power Balance Test:
This test measures each cylinder contribution relative to the others by turning off the spark plugs one at a time. All of the % drop numbers should be within 10% of one another. Out of range readings will be compared to other tests to confirm a problem.
In addition to these major tests, the following other information will be determined:
- Life of brake pads and condition of the calipers and discs/drums.
- Usable life of the tires.
- Temperature range of the engine coolant.
- Condition of the exterior body.
- Condition of instrument cluster and all working electric features within the interior of the vehicle.
- Condition of the belts and hoses, CV joints and boots, exhaust, suspension components, emergency brake.
The results of the inspection are delivered on the spot in a 100 point inspection regime. From the information provided with the inspection, the client will know exactly what is wrong with the car. This is useful because depending on the condition of the car, it might dissuade the person from purchasing it, or will be used as leverage to reduce the price to account for the needed repairs.
Market Analysis Summary
The market for used car inspections is made up of people typically purchasing vehicles over $5,000. While the cost of the inspection is $100, not a significant sum, not all people get an inspection. This occurs for one of two reasons, 1) they are unable to due to the restrictive business hours of traditional mechanics, 2) the people do not recognize the strong cost benefit analysis argument for spending $100 to find out everything that could be wrong with a used car before it is purchased.
These people will be targeted with a marketing message that communicates the thoroughness of the inspections, as well as the newfound convenience relative to other service providers.
4.1 Market Segmentation
Portland Mobile Auto Inspectors’ target customer will be a used car buyer, typically looking for a car over $5,000. The used car buyer purchasing a car below $5,000 typically is looking for basic transportation and is not all that concerned with the possible problems that might affect the vehicle. In general they accept the fact that there are going to be problems with the car and they are not willing to pay someone to tell them that there are a many things wrong with the car which they cannot afford to fix.
Portland Mobile Auto Inspectors’ customer is buying a used car for one of two reasons, 1) they cannot afford what the want in a new car, or 2) they recognize the value that they gain by purchasing a used car. This value is generating by the fact that a new car will depreciate the most, 20%, within the first year.
The target customer has typically done their research and narrowed down their search to a few different vehicles. They have looked at the car and found that it meets their needs. The last step is to make sure the car is in good condition.

| Market Analysis | |||||||
| Year 1 | Year 2 | Year 3 | Year 4 | Year 5 | |||
| Potential Customers | Growth | CAGR | |||||
| Used car purchasers | 9% | 33,457 | 36,468 | 39,750 | 43,328 | 47,228 | 9.00% |
| Other | 0% | 0 | 0 | 0 | 0 | 0 | 0.00% |
| Total | 9.00% | 33,457 | 36,468 | 39,750 | 43,328 | 47,228 | 9.00% |

4.2 Target Market Segment Strategy
The target segment will be focused upon using:
- Yellow Page advertisement: the ad will be used to advertise Portland Mobile Auto Inspectors to people who are in need of an inspection and do not already have a mechanic in mind.
- Website: the website will be developed to provide information about Portland Mobile Auto Inspectors services to the public. The site will be submitted to all the popular search engines so when an person types in a wide range of common terms, Portland Mobile Auto Inspectors website will be featured at the top of the search list.
- Partnerships with AAA and other similar organizations: Portland Mobile Auto Inspectors will develop strategic relationships with automobile associations such as AAA so that a large number of association members are brought to it.
4.3 Service Business Analysis
The car inspection business is serviced by two types of companies. Mobile inspection companies such as Portland Mobile Auto Inspectors, and a variety of different mechanics/garages. There currently is only one other mobile inspection service.
There are many different mechanics that offer inspection services. Some will advertise their service to the general public as well as to their customers. These mechanics are marketing their inspection service and are trying to derive a decent amount of revenue from their service offering.
There are other mechanics that will perform an inspection service if it is requested, but it is not marketed as a normal service.
The disadvantage to the traditional mechanics is their hours of availability. Most mechanics only have business hours during the week. This is in conflict with the fact that most people who are looking for used cars have jobs during the day and therefore generally do not have the opportunity to use the mechanic-based inspection service because they are typically looking for cars on the weekends or evenings.
4.3.1 Competition and Buying Patterns
Please see the previous section Service Business Analysis which details the competitors in the industry as well as the buying patterns of the consumers.
Strategy and Implementation Summary
Portland Mobile Auto Inspectors’ strategy to gain customers will based on an emphasis of their competitive edges. These include a sophisticated level of automobile repair expertise as well as the thoroughness of the inspection. Portland Mobile Auto Inspectors sales strategy will be to communicate these competitive advantages. The advantage of convenience should be quite obvious to the consumer.
5.1 Competitive Edge
Portland Mobile Auto Inspectors’ competitive edge is its level of expertise and thoroughness of the inspections. Dan, owner and chief technician is industry certified as a master mechanic. This certification provides him the requisite background and knowledge to perform any and all aspects of the inspection.
In addition to Dan’s expertise, Portland Mobile Auto Inspectors’s other competitive edge is the thoroughness of the inspection. With the use of sophisticated test equipment, Portland Mobile Auto Inspectors is able to offer the same level of completeness of an inspection that a stationary mechanic would otherwise be able to offer. No aspect of the vehicle is left uninspected. Portland Mobile Auto Inspectors’s inspection will provide the necessary confidence to purchase a used car.
5.2 Sales Strategy
The sales strategy will be based on communicating Dan’s automobile experience and the thoroughness of the inspection. While Dan is capable of performing a thorough inspection, there will be a bit of ambivalence of the prospective customer that must be overcome in regards to how thorough an inspection can be without a garage.
With this information communicated, it will not be difficult to convince the prospective customer as the mobile inspection service is significantly more convenient than the current service offerings.
5.2.1 Sales Forecast
First month will be used to set up the mobile office. There will be no sales activity during this time period. Beginning with the second month, there will be some sales activity, and it is forecasted that sales will steadily grow thereafter. Profitability will be reached by month six.

| Sales Forecast | |||
| Year 1 | Year 2 | Year 3 | |
| Sales | |||
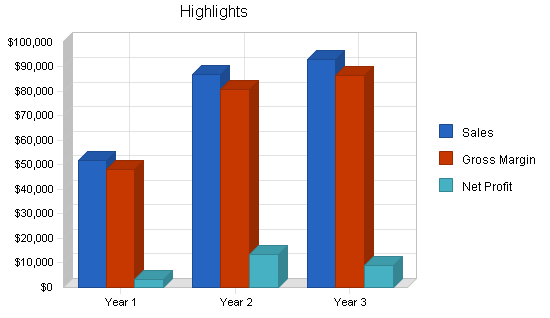
| Used car purchasers | $51,900 | $87,000 | $93,000 |
| Other | $0 | $0 | $0 |
| Total Sales | $51,900 | $87,000 | $93,000 |
| Direct Cost of Sales | Year 1 | Year 2 | Year 3 |
| Used car purchasers | $3,633 | $6,090 | $6,510 |
| Other | $0 | $0 | $0 |
| Subtotal Direct Cost of Sales | $3,633 | $6,090 | $6,510 |
5.3 Milestones
Portland Mobile Auto Inspectors will have several milestones early on:
- Business plan completion. This will be done as a roadmap for the organization. This will be an indispensable tool for the ongoing performance and improvement of the company.
- Set up of the mobile office.
- Profitability.
| Milestones | |||||
| Milestone | Start Date | End Date | Budget | Manager | Department |
| Business plan completion | 1/1/2001 | 2/1/2001 | $0 | ABC | Marketing |
| Set up of the mobile office | 1/1/2001 | 2/1/2001 | $0 | ABC | Department |
| Profitability | 1/1/2001 | 6/31/2001 | $0 | ABC | Department |
| Totals | $0 | ||||
Web Plan Summary
The website will be used as a means of describing the services that Portland Mobile Auto Inspectors offers. It will provide background of Dan’s automobile experience as well as all of the different tests that Dan will do when inspecting a used automobile. If a prospective client is interested in scheduling a service appointment it can be done either via email of through a phone call.
6.1 Website Marketing Strategy
The website will be submitted to a variety of different search engines. Each search engine submission will be tailored to that individual engine.
6.2 Development Requirements
Dan will hire a computer science major from the University of Portland to develop the website.
Management Summary
Dan Jalopee received his BS from the University of Portland in communication. Armed with his education, Dan went to work as a mechanic at a european car clinic.
As a youngster Dan had learned how to disassemble and repair his VW bug. Dan started at the bottom of the totum pole at the car clinic, changing oil and repairing/changing tires. Dan was a quick learner and moved up the organization quickly, taking on more sophisticated tasks. After three years at the clinic, Dan was working on all aspects of car repair. Dan thoroughly enjoyed his job but he was mentally challenged when diagnosing the problems.
After working at the car clinic for two and half years Dan became restless and wanted to run his own business. He considered opening a garage but ruled that out as it would require too much capital. On a suggestion from a friend Dan looked into a mobile car inspection, an unfilled niche, in servicing used car buyers.
7.1 Personnel Plan
Portland Mobile Auto Inspectors will be a one man operation. Armed with a laptop computer and a mobile phone, Dan will be able to make appointments and serve the customers alone with the independence of his vehicle.
| Personnel Plan | |||
| Year 1 | Year 2 | Year 3 | |
| Owner | $36,000 | $54,000 | $66,000 |
| Name or Title | $0 | $0 | $0 |
| Name or Title | $0 | $0 | $0 |
| Other | $0 | $0 | $0 |
| Total People | 0 | 0 | 0 |
| Total Payroll | $36,000 | $54,000 | $66,000 |
Financial Plan
The following sections will outline important financial information.
8.1 Important Assumptions
The following table details important financial assumptions.
| General Assumptions | |||
| Year 1 | Year 2 | Year 3 | |
| Plan Month | 1 | 2 | 3 |
| Current Interest Rate | 10.00% | 10.00% | 10.00% |
| Long-term Interest Rate | 10.00% | 10.00% | 10.00% |
| Tax Rate | 30.00% | 30.00% | 30.00% |
| Other | 0 | 0 | 0 |
8.2 Projected Profit and Loss
The following table will indicate projected profit and loss.

| Pro Forma Profit and Loss | |||
| Year 1 | Year 2 | Year 3 | |
| Sales | $51,900 | $87,000 | $93,000 |
| Direct Cost of Sales | $3,633 | $6,090 | $6,510 |
| Other Production Expenses | $0 | $0 | $0 |
| Total Cost of Sales | $3,633 | $6,090 | $6,510 |
| Gross Margin | $48,267 | $80,910 | $86,490 |
| Gross Margin % | 93.00% | 93.00% | 93.00% |
| Expenses | |||
| Payroll | $36,000 | $54,000 | $66,000 |
| Sales and Marketing and Other Expenses | $1,200 | $1,200 | $1,200 |
| Depreciation | $3,804 | $3,804 | $3,804 |
| Leased Equipment | $0 | $0 | $0 |
| Utilities | $1,500 | $1,500 | $1,500 |
| Insurance | $1,200 | $1,200 | $1,200 |
| Rent | $0 | $0 | $0 |
| Payroll Taxes | $0 | $0 | $0 |
| Other | $0 | $0 | $0 |
| Total Operating Expenses | $43,704 | $61,704 | $73,704 |
| Profit Before Interest and Taxes | $4,563 | $19,206 | $12,786 |
| EBITDA | $8,367 | $23,010 | $16,590 |
| Interest Expense | $0 | $0 | $0 |
| Taxes Incurred | $1,369 | $5,762 | $3,836 |
| Net Profit | $3,194 | $13,444 | $8,950 |
| Net Profit/Sales | 6.15% | 15.45% | 9.62% |
8.3 Break-even Analysis
The Break-even Analysis indicates that $4,400 will be needed in monthly revenue to reach the break-even point.

| Break-even Analysis | |
| Monthly Revenue Break-even | $3,916 |
| Assumptions: | |
| Average Percent Variable Cost | 7% |
| Estimated Monthly Fixed Cost | $3,642 |
8.4 Projected Cash Flow
The following chart and table will indicate projected cash flow.

| Pro Forma Cash Flow | |||
| Year 1 | Year 2 | Year 3 | |
| Cash Received | |||
| Cash from Operations | |||
| Cash Sales | $51,900 | $87,000 | $93,000 |
| Subtotal Cash from Operations | $51,900 | $87,000 | $93,000 |
| Additional Cash Received | |||
| Sales Tax, VAT, HST/GST Received | $0 | $0 | $0 |
| New Current Borrowing | $0 | $0 | $0 |
| New Other Liabilities (interest-free) | $0 | $0 | $0 |
| New Long-term Liabilities | $0 | $0 | $0 |
| Sales of Other Current Assets | $0 | $0 | $0 |
| Sales of Long-term Assets | $0 | $0 | $0 |
| New Investment Received | $0 | $0 | $0 |
| Subtotal Cash Received | $51,900 | $87,000 | $93,000 |
| Expenditures | Year 1 | Year 2 | Year 3 |
| Expenditures from Operations | |||
| Cash Spending | $36,000 | $54,000 | $66,000 |
| Bill Payments | $5,765 | $17,594 | $14,370 |
| Subtotal Spent on Operations | $41,765 | $71,594 | $80,370 |
| Additional Cash Spent | |||
| Sales Tax, VAT, HST/GST Paid Out | $0 | $0 | $0 |
| Principal Repayment of Current Borrowing | $0 | $0 | $0 |
| Other Liabilities Principal Repayment | $0 | $0 | $0 |
| Long-term Liabilities Principal Repayment | $0 | $0 | $0 |
| Purchase Other Current Assets | $0 | $0 | $0 |
| Purchase Long-term Assets | $0 | $0 | $0 |
| Dividends | $0 | $0 | $0 |
| Subtotal Cash Spent | $41,765 | $71,594 | $80,370 |
| Net Cash Flow | $10,135 | $15,406 | $12,630 |
| Cash Balance | $21,635 | $37,041 | $49,671 |
8.5 Projected Balance Sheet
The following table will indicate the projected balance sheet.
| Pro Forma Balance Sheet | |||
| Year 1 | Year 2 | Year 3 | |
| Assets | |||
| Current Assets | |||
| Cash | $21,635 | $37,041 | $49,671 |
| Other Current Assets | $0 | $0 | $0 |
| Total Current Assets | $21,635 | $37,041 | $49,671 |
| Long-term Assets | |||
| Long-term Assets | $19,000 | $19,000 | $19,000 |
| Accumulated Depreciation | $3,804 | $7,608 | $11,412 |
| Total Long-term Assets | $15,196 | $11,392 | $7,588 |
| Total Assets | $36,831 | $48,433 | $57,259 |
| Liabilities and Capital | Year 1 | Year 2 | Year 3 |
| Current Liabilities | |||
| Accounts Payable | $3,137 | $1,295 | $1,171 |
| Current Borrowing | $0 | $0 | $0 |
| Other Current Liabilities | $0 | $0 | $0 |
| Subtotal Current Liabilities | $3,137 | $1,295 | $1,171 |
| Long-term Liabilities | $0 | $0 | $0 |
| Total Liabilities | $3,137 | $1,295 | $1,171 |
| Paid-in Capital | $32,000 | $32,000 | $32,000 |
| Retained Earnings | ($1,500) | $1,694 | $15,138 |
| Earnings | $3,194 | $13,444 | $8,950 |
| Total Capital | $33,694 | $47,138 | $56,089 |
| Total Liabilities and Capital | $36,831 | $48,433 | $57,259 |
| Net Worth | $33,694 | $47,138 | $56,088 |
8.6 Business Ratios
The following table shows our ratios comparison to our industry classification, Automotive services, nec (SIC#7549).
| Ratio Analysis | ||||
| Year 1 | Year 2 | Year 3 | Industry Profile | |
| Sales Growth | 0.00% | 67.63% | 6.90% | 6.10% |
| Percent of Total Assets | ||||
| Other Current Assets | 0.00% | 0.00% | 0.00% | 30.69% |
| Total Current Assets | 58.74% | 76.48% | 86.75% | 55.12% |
| Long-term Assets | 41.26% | 23.52% | 13.25% | 44.88% |
| Total Assets | 100.00% | 100.00% | 100.00% | 100.00% |
| Current Liabilities | 8.52% | 2.67% | 2.04% | 21.25% |
| Long-term Liabilities | 0.00% | 0.00% | 0.00% | 29.25% |
| Total Liabilities | 8.52% | 2.67% | 2.04% | 50.50% |
| Net Worth | 91.48% | 97.33% | 97.96% | 49.50% |
| Percent of Sales | ||||
| Sales | 100.00% | 100.00% | 100.00% | 100.00% |
| Gross Margin | 93.00% | 93.00% | 93.00% | 100.00% |
| Selling, General & Administrative Expenses | 95.77% | 67.89% | 65.31% | 74.40% |
| Advertising Expenses | 2.31% | 1.38% | 1.29% | 1.76% |
| Profit Before Interest and Taxes | 8.79% | 22.08% | 13.75% | 2.09% |
| Main Ratios | ||||
| Current | 6.90 | 28.61 | 42.42 | 2.06 |
| Quick | 6.90 | 28.61 | 42.42 | 1.37 |
| Total Debt to Total Assets | 8.52% | 2.67% | 2.04% | 54.70% |
| Pre-tax Return on Net Worth | 13.54% | 40.74% | 22.80% | 6.05% |
| Pre-tax Return on Assets | 12.39% | 39.65% | 22.33% | 13.36% |
| Additional Ratios | Year 1 | Year 2 | Year 3 | |
| Net Profit Margin | 6.15% | 15.45% | 9.62% | n.a |
| Return on Equity | 9.48% | 28.52% | 15.96% | n.a |
| Activity Ratios | ||||
| Accounts Payable Turnover | 2.84 | 12.17 | 12.17 | n.a |
| Payment Days | 70 | 51 | 32 | n.a |
| Total Asset Turnover | 1.41 | 1.80 | 1.62 | n.a |
| Debt Ratios | ||||
| Debt to Net Worth | 0.09 | 0.03 | 0.02 | n.a |
| Current Liab. to Liab. | 1.00 | 1.00 | 1.00 | n.a |
| Liquidity Ratios | ||||
| Net Working Capital | $18,498 | $35,746 | $48,500 | n.a |
| Interest Coverage | 0.00 | 0.00 | 0.00 | n.a |
| Additional Ratios | ||||
| Assets to Sales | 0.71 | 0.56 | 0.62 | n.a |
| Current Debt/Total Assets | 9% | 3% | 2% | n.a |
| Acid Test | 6.90 | 28.61 | 42.42 | n.a |
| Sales/Net Worth | 1.54 | 1.85 | 1.66 | n.a |
| Dividend Payout | 0.00 | 0.00 | 0.00 | n.a |
Appendix
| Sales Forecast | |||||||||||||
| Month 1 | Month 2 | Month 3 | Month 4 | Month 5 | Month 6 | Month 7 | Month 8 | Month 9 | Month 10 | Month 11 | Month 12 | ||
| Sales | |||||||||||||
| Used car purchasers | 0% | $0 | $1,200 | $1,900 | $2,300 | $3,600 | $4,500 | $5,100 | $5,500 | $5,900 | $6,500 | $7,400 | $8,000 |
| Other | 0% | $0 | $0 | $0 | $0 | $0 | $0 | $0 | $0 | $0 | $0 | $0 | $0 |
| Total Sales | $0 | $1,200 | $1,900 | $2,300 | $3,600 | $4,500 | $5,100 | $5,500 | $5,900 | $6,500 | $7,400 | $8,000 | |
| Direct Cost of Sales | Month 1 | Month 2 | Month 3 | Month 4 | Month 5 | Month 6 | Month 7 | Month 8 | Month 9 | Month 10 | Month 11 | Month 12 | |
| Used car purchasers | $0 | $84 | $133 | $161 | $252 | $315 | $357 | $385 | $413 | $455 | $518 | $560 | |
| Other | $0 | $0 | $0 | $0 | $0 | $0 | $0 | $0 | $0 | $0 | $0 | $0 | |
| Subtotal Direct Cost of Sales | $0 | $84 | $133 | $161 | $252 | $315 | $357 | $385 | $413 | $455 | $518 | $560 | |
| Personnel Plan | |||||||||||||
| Month 1 | Month 2 | Month 3 | Month 4 | Month 5 | Month 6 | Month 7 | Month 8 | Month 9 | Month 10 | Month 11 | Month 12 | ||
| Owner | 0% | $3,000 | $3,000 | $3,000 | $3,000 | $3,000 | $3,000 | $3,000 | $3,000 | $3,000 | $3,000 | $3,000 | $3,000 |
| Name or Title | 0% | $0 | $0 | $0 | $0 | $0 | $0 | $0 | $0 | $0 | $0 | $0 | $0 |
| Name or Title | 0% | $0 | $0 | $0 | $0 | $0 | $0 | $0 | $0 | $0 | $0 | $0 | $0 |
| Other | 0% | $0 | $0 | $0 | $0 | $0 | $0 | $0 | $0 | $0 | $0 | $0 | $0 |
| Total People | 0 | 0 | 0 | 0 | 0 | 0 | 0 | 0 | 0 | 0 | 0 | 0 | |
| Total Payroll | $3,000 | $3,000 | $3,000 | $3,000 | $3,000 | $3,000 | $3,000 | $3,000 | $3,000 | $3,000 | $3,000 | $3,000 | |
| General Assumptions | |||||||||||||
| Month 1 | Month 2 | Month 3 | Month 4 | Month 5 | Month 6 | Month 7 | Month 8 | Month 9 | Month 10 | Month 11 | Month 12 | ||
| Plan Month | 1 | 2 | 3 | 4 | 5 | 6 | 7 | 8 | 9 | 10 | 11 | 12 | |
| Current Interest Rate | 10.00% | 10.00% | 10.00% | 10.00% | 10.00% | 10.00% | 10.00% | 10.00% | 10.00% | 10.00% | 10.00% | 10.00% | |
| Long-term Interest Rate | 10.00% | 10.00% | 10.00% | 10.00% | 10.00% | 10.00% | 10.00% | 10.00% | 10.00% | 10.00% | 10.00% | 10.00% | |
| Tax Rate | 30.00% | 30.00% | 30.00% | 30.00% | 30.00% | 30.00% | 30.00% | 30.00% | 30.00% | 30.00% | 30.00% | 30.00% | |
| Other | 0 | 0 | 0 | 0 | 0 | 0 | 0 | 0 | 0 | 0 | 0 | 0 | |
| Pro Forma Profit and Loss | |||||||||||||
| Month 1 | Month 2 | Month 3 | Month 4 | Month 5 | Month 6 | Month 7 | Month 8 | Month 9 | Month 10 | Month 11 | Month 12 | ||
| Sales | $0 | $1,200 | $1,900 | $2,300 | $3,600 | $4,500 | $5,100 | $5,500 | $5,900 | $6,500 | $7,400 | $8,000 | |
| Direct Cost of Sales | $0 | $84 | $133 | $161 | $252 | $315 | $357 | $385 | $413 | $455 | $518 | $560 | |
| Other Production Expenses | $0 | $0 | $0 | $0 | $0 | $0 | $0 | $0 | $0 | $0 | $0 | $0 | |
| Total Cost of Sales | $0 | $84 | $133 | $161 | $252 | $315 | $357 | $385 | $413 | $455 | $518 | $560 | |
| Gross Margin | $0 | $1,116 | $1,767 | $2,139 | $3,348 | $4,185 | $4,743 | $5,115 | $5,487 | $6,045 | $6,882 | $7,440 | |
| Gross Margin % | 0.00% | 93.00% | 93.00% | 93.00% | 93.00% | 93.00% | 93.00% | 93.00% | 93.00% | 93.00% | 93.00% | 93.00% | |
| Expenses | |||||||||||||
| Payroll | $3,000 | $3,000 | $3,000 | $3,000 | $3,000 | $3,000 | $3,000 | $3,000 | $3,000 | $3,000 | $3,000 | $3,000 | |
| Sales and Marketing and Other Expenses | $100 | $100 | $100 | $100 | $100 | $100 | $100 | $100 | $100 | $100 | $100 | $100 | |
| Depreciation | $317 | $317 | $317 | $317 | $317 | $317 | $317 | $317 | $317 | $317 | $317 | $317 | |
| Leased Equipment | $0 | $0 | $0 | $0 | $0 | $0 | $0 | $0 | $0 | $0 | $0 | $0 | |
| Utilities | $125 | $125 | $125 | $125 | $125 | $125 | $125 | $125 | $125 | $125 | $125 | $125 | |
| Insurance | $100 | $100 | $100 | $100 | $100 | $100 | $100 | $100 | $100 | $100 | $100 | $100 | |
| Rent | $0 | $0 | $0 | $0 | $0 | $0 | $0 | $0 | $0 | $0 | $0 | $0 | |
| Payroll Taxes | 15% | $0 | $0 | $0 | $0 | $0 | $0 | $0 | $0 | $0 | $0 | $0 | $0 |
| Other | $0 | $0 | $0 | $0 | $0 | $0 | $0 | $0 | $0 | $0 | $0 | $0 | |
| Total Operating Expenses | $3,642 | $3,642 | $3,642 | $3,642 | $3,642 | $3,642 | $3,642 | $3,642 | $3,642 | $3,642 | $3,642 | $3,642 | |
| Profit Before Interest and Taxes | ($3,642) | ($2,526) | ($1,875) | ($1,503) | ($294) | $543 | $1,101 | $1,473 | $1,845 | $2,403 | $3,240 | $3,798 | |
| EBITDA | ($3,325) | ($2,209) | ($1,558) | ($1,186) | $23 | $860 | $1,418 | $1,790 | $2,162 | $2,720 | $3,557 | $4,115 | |
| Interest Expense | $0 | $0 | $0 | $0 | $0 | $0 | $0 | $0 | $0 | $0 | $0 | $0 | |
| Taxes Incurred | ($1,093) | ($758) | ($563) | ($451) | ($88) | $163 | $330 | $442 | $554 | $721 | $972 | $1,139 | |
| Net Profit | ($2,549) | ($1,768) | ($1,313) | ($1,052) | ($206) | $380 | $771 | $1,031 | $1,292 | $1,682 | $2,268 | $2,659 | |
| Net Profit/Sales | 0.00% | -147.35% | -69.08% | -45.74% | -5.72% | 8.45% | 15.11% | 18.75% | 21.89% | 25.88% | 30.65% | 33.23% | |
| Pro Forma Cash Flow | |||||||||||||
| Month 1 | Month 2 | Month 3 | Month 4 | Month 5 | Month 6 | Month 7 | Month 8 | Month 9 | Month 10 | Month 11 | Month 12 | ||
| Cash Received | |||||||||||||
| Cash from Operations | |||||||||||||
| Cash Sales | $0 | $1,200 | $1,900 | $2,300 | $3,600 | $4,500 | $5,100 | $5,500 | $5,900 | $6,500 | $7,400 | $8,000 | |
| Subtotal Cash from Operations | $0 | $1,200 | $1,900 | $2,300 | $3,600 | $4,500 | $5,100 | $5,500 | $5,900 | $6,500 | $7,400 | $8,000 | |
| Additional Cash Received | |||||||||||||
| Sales Tax, VAT, HST/GST Received | 0.00% | $0 | $0 | $0 | $0 | $0 | $0 | $0 | $0 | $0 | $0 | $0 | $0 |
| New Current Borrowing | $0 | $0 | $0 | $0 | $0 | $0 | $0 | $0 | $0 | $0 | $0 | $0 | |
| New Other Liabilities (interest-free) | $0 | $0 | $0 | $0 | $0 | $0 | $0 | $0 | $0 | $0 | $0 | $0 | |
| New Long-term Liabilities | $0 | $0 | $0 | $0 | $0 | $0 | $0 | $0 | $0 | $0 | $0 | $0 | |
| Sales of Other Current Assets | $0 | $0 | $0 | $0 | $0 | $0 | $0 | $0 | $0 | $0 | $0 | $0 | |
| Sales of Long-term Assets | $0 | $0 | $0 | $0 | $0 | $0 | $0 | $0 | $0 | $0 | $0 | $0 | |
| New Investment Received | $0 | $0 | $0 | $0 | $0 | $0 | $0 | $0 | $0 | $0 | $0 | $0 | |
| Subtotal Cash Received | $0 | $1,200 | $1,900 | $2,300 | $3,600 | $4,500 | $5,100 | $5,500 | $5,900 | $6,500 | $7,400 | $8,000 | |
| Expenditures | Month 1 | Month 2 | Month 3 | Month 4 | Month 5 | Month 6 | Month 7 | Month 8 | Month 9 | Month 10 | Month 11 | Month 12 | |
| Expenditures from Operations | |||||||||||||
| Cash Spending | $3,000 | $3,000 | $3,000 | $3,000 | $3,000 | $3,000 | $3,000 | $3,000 | $3,000 | $3,000 | $3,000 | $3,000 | |
| Bill Payments | ($768) | ($1,091) | ($442) | ($100) | $50 | $499 | $810 | $1,017 | $1,157 | $1,298 | $1,511 | $1,822 | |
| Subtotal Spent on Operations | $2,232 | $1,909 | $2,558 | $2,900 | $3,050 | $3,499 | $3,810 | $4,017 | $4,157 | $4,298 | $4,511 | $4,822 | |
| Additional Cash Spent | |||||||||||||
| Sales Tax, VAT, HST/GST Paid Out | $0 | $0 | $0 | $0 | $0 | $0 | $0 | $0 | $0 | $0 | $0 | $0 | |
| Principal Repayment of Current Borrowing | $0 | $0 | $0 | $0 | $0 | $0 | $0 | $0 | $0 | $0 | $0 | $0 | |
| Other Liabilities Principal Repayment | $0 | $0 | $0 | $0 | $0 | $0 | $0 | $0 | $0 | $0 | $0 | $0 | |
| Long-term Liabilities Principal Repayment | $0 | $0 | $0 | $0 | $0 | $0 | $0 | $0 | $0 | $0 | $0 | $0 | |
| Purchase Other Current Assets | $0 | $0 | $0 | $0 | $0 | $0 | $0 | $0 | $0 | $0 | $0 | $0 | |
| Purchase Long-term Assets | $0 | $0 | $0 | $0 | $0 | $0 | $0 | $0 | $0 | $0 | $0 | $0 | |
| Dividends | $0 | $0 | $0 | $0 | $0 | $0 | $0 | $0 | $0 | $0 | $0 | $0 | |
| Subtotal Cash Spent | $2,232 | $1,909 | $2,558 | $2,900 | $3,050 | $3,499 | $3,810 | $4,017 | $4,157 | $4,298 | $4,511 | $4,822 | |
| Net Cash Flow | ($2,232) | ($709) | ($658) | ($600) | $550 | $1,001 | $1,290 | $1,483 | $1,743 | $2,202 | $2,889 | $3,178 | |
| Cash Balance | $9,268 | $8,558 | $7,900 | $7,300 | $7,850 | $8,850 | $10,141 | $11,624 | $13,367 | $15,569 | $18,457 | $21,635 | |
| Pro Forma Balance Sheet | |||||||||||||
| Month 1 | Month 2 | Month 3 | Month 4 | Month 5 | Month 6 | Month 7 | Month 8 | Month 9 | Month 10 | Month 11 | Month 12 | ||
| Assets | Starting Balances | ||||||||||||
| Current Assets | |||||||||||||
| Cash | $11,500 | $9,268 | $8,558 | $7,900 | $7,300 | $7,850 | $8,850 | $10,141 | $11,624 | $13,367 | $15,569 | $18,457 | $21,635 |
| Other Current Assets | $0 | $0 | $0 | $0 | $0 | $0 | $0 | $0 | $0 | $0 | $0 | $0 | $0 |
| Total Current Assets | $11,500 | $9,268 | $8,558 | $7,900 | $7,300 | $7,850 | $8,850 | $10,141 | $11,624 | $13,367 | $15,569 | $18,457 | $21,635 |
| Long-term Assets | |||||||||||||
| Long-term Assets | $19,000 | $19,000 | $19,000 | $19,000 | $19,000 | $19,000 | $19,000 | $19,000 | $19,000 | $19,000 | $19,000 | $19,000 | $19,000 |
| Accumulated Depreciation | $0 | $317 | $634 | $951 | $1,268 | $1,585 | $1,902 | $2,219 | $2,536 | $2,853 | $3,170 | $3,487 | $3,804 |
| Total Long-term Assets | $19,000 | $18,683 | $18,366 | $18,049 | $17,732 | $17,415 | $17,098 | $16,781 | $16,464 | $16,147 | $15,830 | $15,513 | $15,196 |
| Total Assets | $30,500 | $27,951 | $26,924 | $25,949 | $25,032 | $25,265 | $25,948 | $26,922 | $28,088 | $29,514 | $31,399 | $33,970 | $36,831 |
| Liabilities and Capital | Month 1 | Month 2 | Month 3 | Month 4 | Month 5 | Month 6 | Month 7 | Month 8 | Month 9 | Month 10 | Month 11 | Month 12 | |
| Current Liabilities | |||||||||||||
| Accounts Payable | $0 | $0 | $742 | $1,079 | $1,214 | $1,653 | $1,956 | $2,159 | $2,294 | $2,429 | $2,631 | $2,935 | $3,137 |
| Current Borrowing | $0 | $0 | $0 | $0 | $0 | $0 | $0 | $0 | $0 | $0 | $0 | $0 | $0 |
| Other Current Liabilities | $0 | $0 | $0 | $0 | $0 | $0 | $0 | $0 | $0 | $0 | $0 | $0 | $0 |
| Subtotal Current Liabilities | $0 | $0 | $742 | $1,079 | $1,214 | $1,653 | $1,956 | $2,159 | $2,294 | $2,429 | $2,631 | $2,935 | $3,137 |
| Long-term Liabilities | $0 | $0 | $0 | $0 | $0 | $0 | $0 | $0 | $0 | $0 | $0 | $0 | $0 |
| Total Liabilities | $0 | $0 | $742 | $1,079 | $1,214 | $1,653 | $1,956 | $2,159 | $2,294 | $2,429 | $2,631 | $2,935 | $3,137 |
| Paid-in Capital | $32,000 | $32,000 | $32,000 | $32,000 | $32,000 | $32,000 | $32,000 | $32,000 | $32,000 | $32,000 | $32,000 | $32,000 | $32,000 |
| Retained Earnings | ($1,500) | ($1,500) | ($1,500) | ($1,500) | ($1,500) | ($1,500) | ($1,500) | ($1,500) | ($1,500) | ($1,500) | ($1,500) | ($1,500) | ($1,500) |
| Earnings | $0 | ($2,549) | ($4,318) | ($5,630) | ($6,682) | ($6,888) | ($6,508) | ($5,737) | ($4,706) | ($3,415) | ($1,733) | $535 | $3,194 |
| Total Capital | $30,500 | $27,951 | $26,182 | $24,870 | $23,818 | $23,612 | $23,992 | $24,763 | $25,794 | $27,085 | $28,768 | $31,036 | $33,694 |
| Total Liabilities and Capital | $30,500 | $27,951 | $26,924 | $25,949 | $25,032 | $25,265 | $25,948 | $26,922 | $28,088 | $29,514 | $31,399 | $33,970 | $36,831 |
| Net Worth | $30,500 | $27,951 | $26,182 | $24,870 | $23,818 | $23,612 | $23,992 | $24,763 | $25,794 | $27,085 | $28,768 | $31,036 | $33,694 |

