
Legal Associates Temp Agency
Executive Summary
The Legal Associated Temp Agency (LATA) is a full-service temp agency providing Portland/Vancouver with qualified, experienced temp attorneys. This market has been addressed to some extent by larger, general temp agencies, but has not been fully served. LATA will offer a much higher quality alternative to the current offering of temp attorneys. LATA will appeal to small- to mid-sized law firms who are in need of some temp legal help for individual projects.
LATA will also be attractive to firms that are looking for a new associate but want to try out the attorney for a trial period. LATA’s service will allow the firm to use a temp attorney for up to three months and then decide if they want to convert them into a full-time employee. This significantly reduces the risk associated with hiring new employees who you are not quite familiar with. The Portland legal market is currently undeserved and LATA will easily find their niche.
The projected growth rate for LATA is 107% by year three, with gross margins at 100% as a percent of sales.
1.1 Objectives
The objectives for the first three years of operation include:
- To create a service-based company whose primary goal is to exceed customers’ expectations.
- The utilization of LATA in at least 30 different law firms in the Portland/Vancouver legal community.
- To increase LATA’s clients by 20% per year through superior performance and word of mouth referrals.
- To develop a profitable, sustainable business serving the Portland legal community.
1.2 Mission
The Legal Associates Temp Agency’s mission is to provide the customer with legal professionals for whatever needs they may have. We exist to attract and maintain customers. When we adhere to this maxim, everything else will fall into place. Our services will exceed the expectations of our customers.
Company Summary
The Legal Associates Temp Agency (LATA), soon to be located in Portland, OR, will offer clients temp legal professionals. LATA will provide existing law firms with temp attorneys, both generalists as well as specialists. Law firms may use LATA’s attorneys for limited duration projects, or may decide to convert our attorneys into one of their employees.
LATA will target two types of firms. The first is mid-size firms which typically have larger variance of workload from month to month than larger firms. LATA will also be serving smaller-size firms who need temp attorneys at times to help ease the work load.
LATA will operate out of a commercial office located in a professional building in downtown Portland. LATA, once up and running, will consist of five people. LATA’s projected growth indicates a steady increase in sales after the first few months of set up.
2.1 Company Ownership
LATA will be an Oregon Corporation, with Steve Stopgap as the sole shareholder.
2.2 Start-up Summary
LATA’s start-up costs will include all of the equipment needed for the office, website creation, and advertising costs.
The office will require a computer system with a total of five workstations and a dedicated machine to be used as a terminal. The computers will need the minimum specifications: 500 megahertz Celeron/Pentium processor, 64 megabytes of RAM, 6 gigabyte hard drive and one computer with a CD-RW. A laser printer and DSL router will also be needed.
Advertising costs will be associated with the need to increase visibility of LATA to its prospective customers, including a website to communicate their message.

| Start-up | |
| Requirements | |
| Start-up Expenses | |
| Legal | $0 |
| Stationery etc. | $200 |
| Brochures | $500 |
| Website Development | $500 |
| Other | $0 |
| Total Start-up Expenses | $1,200 |
| Start-up Assets | |
| Cash Required | $58,800 |
| Other Current Assets | $0 |
| Long-term Assets | $5,000 |
| Total Assets | $63,800 |
| Total Requirements | $65,000 |
| Start-up Funding | |
| Start-up Expenses to Fund | $1,200 |
| Start-up Assets to Fund | $63,800 |
| Total Funding Required | $65,000 |
| Assets | |
| Non-cash Assets from Start-up | $5,000 |
| Cash Requirements from Start-up | $58,800 |
| Additional Cash Raised | $0 |
| Cash Balance on Starting Date | $58,800 |
| Total Assets | $63,800 |
| Liabilities and Capital | |
| Liabilities | |
| Current Borrowing | $0 |
| Long-term Liabilities | $0 |
| Accounts Payable (Outstanding Bills) | $0 |
| Other Current Liabilities (interest-free) | $0 |
| Total Liabilities | $0 |
| Capital | |
| Planned Investment | |
| Investor 1 | $65,000 |
| Other | $0 |
| Additional Investment Requirement | $0 |
| Total Planned Investment | $65,000 |
| Loss at Start-up (Start-up Expenses) | ($1,200) |
| Total Capital | $63,800 |
| Total Capital and Liabilities | $63,800 |
| Total Funding | $65,000 |
Services
The Legal Associated Temp Agency will provide law firms with experienced temp attorneys. LATA will have both generalist and specialty temp attorneys who are able “enter a firm/project on their feet running” with minimal training and supervision. LATA’s services will be attractive to firms who need help quickly and do not have the time or money to interview, hire, and train an attorney for the short term project.
LATA also provides temp attorneys to firms who want to use LATA’s service as a replacement for their HR department. In this situation, LATA will perform all of the HR functions of interviewing, training, hiring, and payroll, allowing the firm to quickly bring someone on board and use them for several months as a probationary period, if they like the attorney they may then convert them into a full-time employee while paying LATA a small fee to allow us to give up our rights to the temp attorney.
Market Analysis Summary
LATA will be focusing on two groups of attorneys that have a need for temp attorneys. The first group is mid-size firms. They are characterized by having seven to 15 attorneys on staff. The mid-size firms will often need help on a project of limited duration and will bring on board a temp attorney to help out on an ongoing case that they have.
The second target group is a small law firm, characterized by having one to six attorneys. For a small firm, they will typically get a client who has needs that, because of current work loads, cannot be fulfilled. The small law firm will then bring the temp attorney on board and hand them the case to work on from start to finish.
Currently, there are several legal-only temp firms. While they are quite similar to LATA, there is plenty of room in the Portland as evidenced by the growth of these companies. Additionally, there are temp agencies that have attorneys as clients but do not specialize in the temping for the practice of law. Firms use these general temp agencies, but there is the trend toward specialization of temp services. Law firms are realizing that there is more value for them to get a temp attorney from a legal temp firm who better understands the firm’s needs.
4.1 Market Segmentation
LATA’s customers can be divided into two different groups:
- The first group consists of mid-size law firms. These firms have between seven and 15 attorneys. These firms will at times need help on a project. The project is typically of a limited duration. The firm would contact a temp agency such as LATA and bring on the temp attorney to help out with the project. The temp attorney would typically assist with case instead of actually taking it over.
- The second group is small law firms. These are solo practitioners or firms up to six attorneys. They might have a client who brings them a case which they did not have the time for but do not want to turn away. So they get the client’s consent to use an attorney that is not formally a part of the firm, hire a temp attorney, and allow the temp to take care of the case while they have a limited supervisory role.
In addition to these two groups there might be other miscellaneous customers that do not fit neatly into a segment.

| Market Analysis | |||||||
| Year 1 | Year 2 | Year 3 | Year 4 | Year 5 | |||
| Potential Customers | Growth | CAGR | |||||
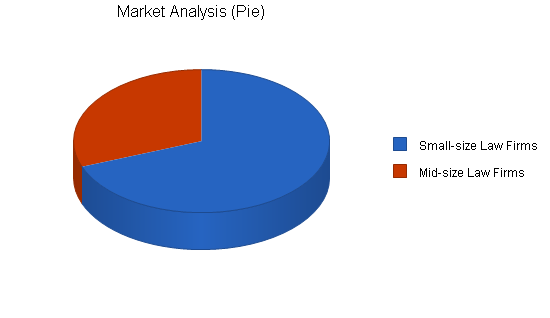
| Small-size Law Firms | 9% | 345 | 376 | 410 | 447 | 487 | 9.00% |
| Mid-size Law Firms | 8% | 154 | 166 | 179 | 193 | 208 | 7.80% |
| Total | 8.64% | 499 | 542 | 589 | 640 | 695 | 8.64% |
4.2 Target Market Segment Strategy
LATA is specifically targeting the small- and mid-size law firms because they are the most likely to use a temp service consistently. LATA’s strategy for marketing its service will be based on a couple different forms of communication:
- Advertisements in the bar journal. All attorneys that are licensed to practice in the state get the bar journal and frequently refer to the bar journals classified section for job related information. The bar journal is the #1 source for reaching the legal community.
- Advertisements in the yellow pages. The yellow pages is a typical resource that people use when searching for specific things.
- Website. LATA is developing a website that highlights the different services that we offer. The website will be easily found using common terms in a search engine.
- General networking. Because LATA’s president is an attorney, he will be networking with fellow attorneys at functions such as continuing legal education seminars (CLE).
4.3 Service Business Analysis
The temp agency in Portland is similar in size to comparable cities in other states. Most agencies have some degree of specialization. Some firms serve IT companies, some serve clerical needs. Most firms do not specialize in such a narrow area as the practice of law. If they served law firms, it is generally a part of a larger professional group practice.
Companies that are in need for temp workers will contact a temp agency and tell them what type of workers they need. The temp agency will have a list of potential workers that they have previously interviewed and screened out highly-qualified applicants for specific skills. The company will then pay the temp agency an hourly wage and the temp agency pays their temp worker. The margins in the temp industry are typically 14%-20%. The value that the temp agencies develop for the companies is that they do all the job posting, interviewing, screening, hiring, and payroll, etc. If the client is unhappy with the temp worker most temp agencies will take back the worker and replace them with someone else. This is quite attractive for many companies who do not have the time or resources to invest into finding temp help.
4.3.1 Competition and Buying Patterns
There are many different temp firms in Portland. On a nationwide scale, the largest franchise temp agencies make up 40% of the market. Portland has a similar makeup with several large franchise agencies. There are also many independent temp companies. Typically, both the franchise or independently owned companies are either generalists or concentrate on a broad group of skills like professionals or IT. It is quite rare for a company to be specific enough to only serve a single profession. While concentrating on a single profession limits the market size of the firm, it allows the temp firm to offer a higher level of service for that specific market niche.
There is a recent trend of companies hiring temp workers and converting them to full-time employees. This allows them to spend less money up front on the worker and also allows them a trial period with the employee. While any employer can set up a trial or probationary period for a worker, the temp set up allows them to do this without investing much money into hiring or training of the worker. In essence it allows the firm to pay the temp agency to be their HR department, converting the temp worker into an employee of the firm after they have been impressed with the temp’s work product and personality. This makes hiring significantly less risky as you are able to “try before you buy.”
Strategy and Implementation Summary
LATA will be aggressively courting small- to mid-size law firms. This will be done through a mixture of advertising, networking, website traffic, and phone calls. Many of our target firms have at some point needed a temp attorney but the previous options have been limited and somewhat of a compromise. LATA will provide a service that has not been fully developed up until now. Once firms are aware of this improved service offering, LATA is confident that they will be able convert interested firms into clients.
5.1 Competitive Edge
LATA’s competitive edge is its concentration on the legal market, specifically attorneys. While concentrating on such a narrow skill set reduces the overall market size, it allows LATA to better serve those customers that are within this space. LATA will offer a higher level of service and attention than a general temp agency could offer. This higher level of service will be translated into a more predictive screening process for choosing attorneys. Using Steve’s experience as a practicing attorney, as well as cutting edge HR techniques, will develop a more accurate method of predictive interviews (structured behavioral interviews). Additionally, Steve’s legal background will allow him to develop the behavioral situations that attorneys are likely to encounter.
Steve will be able to add value through the training process that he develops to allow the temp attorney to seamlessly jump into a project and exceed all of the expectations that the firm has. These expectations will be developed through the relationship that LATA forms with the firm when they enter into a contract.
Although there are a fair amount of attorneys in the Portland market, it is still a close knit group of professionals. The bar is a self regulating association with its own rules of conduct which creates ties within the legal community. Because of these circumstances, many attorneys know each other within the community, especially the longer they practice in the area.
Having the legal community so close knit will be a competitive advantage for LATA because Steve practiced in the community for 10 years and has developed a large network of colleagues. LATA will have developed instant credibility because of the years of law practice that Steve has under his belt. This credibility will help LATA overcome any initial reluctance a firm might have regarding hiring a temp due to the trust bond that Steve has established while practicing in the Portland community.
5.2 Sales Strategy
LATA’s sales strategy will be based on an initial disbursement of materials that showcase our services. Once this peaks the interest of the law firm LATA will use personal selling techniques to bring in customers. Steve will be able to communicate to sales leads our elite level of interviewing, training, and general convenience that we offer firms. While at first glace it may appear inefficient for the president to be doing all of the sales qualifying and closing, yet it actually is quite logical. Most of the relationships that LATA develops will be premised on the assumption that they are long term so time spent by Steve with a firm up front will pay off in the long run as we turn the initial customer into a long-term customer.
Another strategy will be using statistical evidence to show how LATA can save the firm money by using our service and by passing the normal hiring process or work project process. By showing the prospective firm quantitative data that LATA can reduce costs, LATA expects to to turn the lead into a closed sale.
LATA will be charging firms an hourly rate that might initially seem high, but after you factor in the costs of interviewing, payroll, and training, it will seem quite reasonable. For LATA it will be on the high end of the margins continuum for the industry, but it will be earned as LATA will be doing more training than most temp firms. While an attorney is presumably already trained in legal research, writing and other legal activities, LATA will be training them in ways in which they can make their transition into the organization more seamless.
5.2.1 Sales Forecast
The first two months will be setting up the office and developing the interviewing process and training courses. LATA will also have the website online by the end of month two and the printed material ready to go. All of the advertisements will be submitted so by month three LATA will be “online” (so to speak). Months three through five will be slow but steady. LATA will have some temp activity that will increase as it becomes more visible. By month six things will be ramping up and will keep LATA quite busy. By month 12 or 13 things will have gotten quite busy and Steve will be looking to hire a new sales person so he can focus on business development.
The first four to five months will be a bit heavy administratively, but LATA believes that the administrative expense will be worthwhile as it will allow the company to grow more painlessly when it gets busier by month six.


| Sales Forecast | |||
| Year 1 | Year 2 | Year 3 | |
| Sales | |||
| Small-size Law Firms | $44,749 | $105,874 | $110,478 |
| Medium-size Law Firms | $61,474 | $113,587 | $125,477 |
| Total Sales | $106,223 | $219,461 | $235,955 |
| Direct Cost of Sales | Year 1 | Year 2 | Year 3 |
| Small-size Law Firms | $0 | $0 | $0 |
| Medium-size Law Firms | $0 | $0 | $0 |
| Subtotal Direct Cost of Sales | $0 | $0 | $0 |
5.3 Milestones
LATA will have several milestones early on:
- Business plan completion.
- Office set-up.
- Completion of website and sales literature.
- Development of the training program.
- Usage of LATA’s services in 30+ firms.
| Milestones | |||||
| Milestone | Start Date | End Date | Budget | Manager | Department |
| Business plan completion | 1/1/2001 | 1/1/2001 | $0 | Steve | Marketing |
| Office set-up | 1/1/2001 | 4/1/1999 | $0 | Steve | Department |
| Completion of website and sales literature | 1/1/2001 | 2/1/2001 | $0 | ABC | Department |
| Development of the hiring/training program | 1/1/2001 | 4/1/2001 | $0 | ABC | Department |
| LATA’s services in over 30 law firms | 3/1/2001 | 3/1/2002 | $0 | everyone | Department |
| Totals | $0 | ||||
Management Summary
LATA is owned and operated by Steve Stopgap. It will be formed as an Oregon Corporation. LATA will be incorporated to eliminate personal liability for Steve.
Steve Stopgap has a degree in philosophy from Middlebury College. Steve spent four years after college managing an outdoor sports store. Steve’s primary responsibilities were, inventory control, interviewing and hiring, as well as sales training. Steve decided to go to law school and complete his childhood dream (and appease his parent’s wishes) to become an attorney. After law school at Willamette University, Steve practiced for a medium-size firm in Portland for 10 years. The practice of law was enjoyable most of the time and he was given a wide range of cases. Throughout his practice Steve did a lot of litigation and negotiation, allowing him to become familiar with many colleagues throughout the Portland legal community. Toward the end of his practice, he felt like he was constantly working for someone else and had little control over his career. He decided to leave and start his own legal temp firm, sensing the great need Portland had for quality temp attorneys.
6.1 Personnel Plan
The staff consists of Steve working full time for LATA. In addition to Steve there will be an office manager in charge of managing the office and conducting the interview, a receptionist/secretary, HR person, and an associate salesperson. The office manager will be a salaried employee as this person needs to be a stable foundation for the office. The receptionist and HR person will be hourly workers. The account manager will be an hourly worker with a bonus payment system to create a financial incentive for superior service.
| Personnel Plan | |||
| Year 1 | Year 2 | Year 3 | |
| President | $24,000 | $26,000 | $28,000 |
| Office Manager | $33,000 | $35,000 | $37,000 |
| Receptionist/Secretary | $15,840 | $17,214 | $19,458 |
| HR Person | $15,840 | $17,214 | $19,458 |
| Account Manager | $27,000 | $35,478 | $37,584 |
| Total People | 5 | 5 | 5 |
| Total Payroll | $115,680 | $130,906 | $141,500 |
Financial Plan
The following sections will outline financial assumption/projections.
7.1 Important Assumptions
The following table highlights some of the important financial assumptions for LATA.
| General Assumptions | |||
| Year 1 | Year 2 | Year 3 | |
| Plan Month | 1 | 2 | 3 |
| Current Interest Rate | 10.00% | 10.00% | 10.00% |
| Long-term Interest Rate | 10.00% | 10.00% | 10.00% |
| Tax Rate | 25.42% | 25.00% | 25.42% |
| Other | 0 | 0 | 0 |
7.2 Break-even Analysis
The Break-even Analysis table and chart below show the monthly break-even sales figure.

| Break-even Analysis | |
| Monthly Revenue Break-even | $13,525 |
| Assumptions: | |
| Average Percent Variable Cost | 0% |
| Estimated Monthly Fixed Cost | $13,525 |
7.3 Projected Profit and Loss
The following table will indicate projected profit and loss.


| Pro Forma Profit and Loss | |||
| Year 1 | Year 2 | Year 3 | |
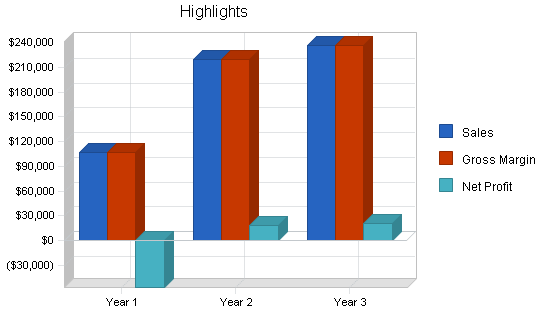
| Sales | $106,223 | $219,461 | $235,955 |
| Direct Cost of Sales | $0 | $0 | $0 |
| Other | $0 | $0 | $0 |
| Total Cost of Sales | $0 | $0 | $0 |
| Gross Margin | $106,223 | $219,461 | $235,955 |
| Gross Margin % | 100.00% | 100.00% | 100.00% |
| Expenses | |||
| Payroll | $115,680 | $130,906 | $141,500 |
| Sales and Marketing and Other Expenses | $3,000 | $16,600 | $16,600 |
| Depreciation | $1,668 | $1,666 | $1,666 |
| Utilities | $600 | $600 | $600 |
| Insurance | $6,000 | $6,100 | $6,200 |
| Rent | $18,000 | $19,000 | $19,500 |
| Payroll Taxes | $17,352 | $19,636 | $21,225 |
| Other | $0 | $0 | $0 |
| Total Operating Expenses | $162,300 | $194,508 | $207,291 |
| Profit Before Interest and Taxes | ($56,077) | $24,953 | $28,664 |
| EBITDA | ($54,409) | $26,619 | $30,330 |
| Interest Expense | $650 | $975 | $325 |
| Taxes Incurred | $0 | $5,995 | $7,203 |
| Net Profit | ($56,727) | $17,984 | $21,136 |
| Net Profit/Sales | -53.40% | 8.19% | 8.96% |
7.4 Projected Cash Flow
The following chart and table will indicate projected cash flow.

| Pro Forma Cash Flow | |||
| Year 1 | Year 2 | Year 3 | |
| Cash Received | |||
| Cash from Operations | |||
| Cash Sales | $0 | $0 | $0 |
| Cash from Receivables | $69,063 | $179,847 | $230,185 |
| Subtotal Cash from Operations | $69,063 | $179,847 | $230,185 |
| Additional Cash Received | |||
| Sales Tax, VAT, HST/GST Received | $0 | $0 | $0 |
| New Current Borrowing | $13,000 | $0 | $0 |
| New Other Liabilities (interest-free) | $0 | $0 | $0 |
| New Long-term Liabilities | $0 | $0 | $0 |
| Sales of Other Current Assets | $0 | $0 | $0 |
| Sales of Long-term Assets | $0 | $0 | $0 |
| New Investment Received | $46,000 | $0 | $0 |
| Subtotal Cash Received | $128,063 | $179,847 | $230,185 |
| Expenditures | Year 1 | Year 2 | Year 3 |
| Expenditures from Operations | |||
| Cash Spending | $115,680 | $130,906 | $141,500 |
| Bill Payments | $41,696 | $67,148 | $71,427 |
| Subtotal Spent on Operations | $157,376 | $198,054 | $212,927 |
| Additional Cash Spent | |||
| Sales Tax, VAT, HST/GST Paid Out | $0 | $0 | $0 |
| Principal Repayment of Current Borrowing | $0 | $6,500 | $6,500 |
| Other Liabilities Principal Repayment | $0 | $0 | $0 |
| Long-term Liabilities Principal Repayment | $0 | $0 | $0 |
| Purchase Other Current Assets | $0 | $0 | $0 |
| Purchase Long-term Assets | $0 | $0 | $0 |
| Dividends | $0 | $0 | $0 |
| Subtotal Cash Spent | $157,376 | $204,554 | $219,427 |
| Net Cash Flow | ($29,313) | ($24,707) | $10,758 |
| Cash Balance | $29,487 | $4,780 | $15,538 |
7.5 Projected Balance Sheet
The following table will indicate the projected balance sheet.
| Pro Forma Balance Sheet | |||
| Year 1 | Year 2 | Year 3 | |
| Assets | |||
| Current Assets | |||
| Cash | $29,487 | $4,780 | $15,538 |
| Accounts Receivable | $37,160 | $76,774 | $82,544 |
| Other Current Assets | $0 | $0 | $0 |
| Total Current Assets | $66,647 | $81,554 | $98,082 |
| Long-term Assets | |||
| Long-term Assets | $5,000 | $5,000 | $5,000 |
| Accumulated Depreciation | $1,668 | $3,334 | $5,000 |
| Total Long-term Assets | $3,332 | $1,666 | $0 |
| Total Assets | $69,979 | $83,220 | $98,082 |
| Liabilities and Capital | Year 1 | Year 2 | Year 3 |
| Current Liabilities | |||
| Accounts Payable | $3,906 | $5,663 | $5,889 |
| Current Borrowing | $13,000 | $6,500 | $0 |
| Other Current Liabilities | $0 | $0 | $0 |
| Subtotal Current Liabilities | $16,906 | $12,163 | $5,889 |
| Long-term Liabilities | $0 | $0 | $0 |
| Total Liabilities | $16,906 | $12,163 | $5,889 |
| Paid-in Capital | $111,000 | $111,000 | $111,000 |
| Retained Earnings | ($1,200) | ($57,927) | ($39,943) |
| Earnings | ($56,727) | $17,984 | $21,136 |
| Total Capital | $53,073 | $71,057 | $92,193 |
| Total Liabilities and Capital | $69,979 | $83,220 | $98,082 |
| Net Worth | $53,073 | $71,057 | $92,193 |
7.6 Business Ratios
Business ratios for the years of this plan are shown below. Industry profile ratios based on the NAICS code 561310, Employment Placement Agencies, are shown for comparison.
| Ratio Analysis | ||||
| Year 1 | Year 2 | Year 3 | Industry Profile | |
| Sales Growth | 0.00% | 106.60% | 7.52% | 11.37% |
| Percent of Total Assets | ||||
| Accounts Receivable | 53.10% | 92.25% | 84.16% | 10.25% |
| Other Current Assets | 0.00% | 0.00% | 0.00% | 50.16% |
| Total Current Assets | 95.24% | 98.00% | 100.00% | 64.49% |
| Long-term Assets | 4.76% | 2.00% | 0.00% | 35.51% |
| Total Assets | 100.00% | 100.00% | 100.00% | 100.00% |
| Current Liabilities | 24.16% | 14.62% | 6.00% | 27.96% |
| Long-term Liabilities | 0.00% | 0.00% | 0.00% | 26.35% |
| Total Liabilities | 24.16% | 14.62% | 6.00% | 54.31% |
| Net Worth | 75.84% | 85.38% | 94.00% | 45.69% |
| Percent of Sales | ||||
| Sales | 100.00% | 100.00% | 100.00% | 100.00% |
| Gross Margin | 100.00% | 100.00% | 100.00% | 100.00% |
| Selling, General & Administrative Expenses | 153.40% | 91.81% | 90.99% | 67.20% |
| Advertising Expenses | 1.69% | 0.18% | 0.17% | 1.87% |
| Profit Before Interest and Taxes | -52.79% | 11.37% | 12.15% | 3.25% |
| Main Ratios | ||||
| Current | 3.94 | 6.70 | 16.65 | 1.57 |
| Quick | 3.94 | 6.70 | 16.65 | 1.10 |
| Total Debt to Total Assets | 24.16% | 14.62% | 6.00% | 63.70% |
| Pre-tax Return on Net Worth | -106.88% | 33.75% | 30.74% | 6.19% |
| Pre-tax Return on Assets | -81.06% | 28.81% | 28.89% | 17.06% |
| Additional Ratios | Year 1 | Year 2 | Year 3 | |
| Net Profit Margin | -53.40% | 8.19% | 8.96% | n.a |
| Return on Equity | -106.88% | 25.31% | 22.93% | n.a |
| Activity Ratios | ||||
| Accounts Receivable Turnover | 2.86 | 2.86 | 2.86 | n.a |
| Collection Days | 54 | 95 | 123 | n.a |
| Accounts Payable Turnover | 11.68 | 12.17 | 12.17 | n.a |
| Payment Days | 27 | 25 | 29 | n.a |
| Total Asset Turnover | 1.52 | 2.64 | 2.41 | n.a |
| Debt Ratios | ||||
| Debt to Net Worth | 0.32 | 0.17 | 0.06 | n.a |
| Current Liab. to Liab. | 1.00 | 1.00 | 1.00 | n.a |
| Liquidity Ratios | ||||
| Net Working Capital | $49,741 | $69,391 | $92,193 | n.a |
| Interest Coverage | -86.27 | 25.59 | 88.20 | n.a |
| Additional Ratios | ||||
| Assets to Sales | 0.66 | 0.38 | 0.42 | n.a |
| Current Debt/Total Assets | 24% | 15% | 6% | n.a |
| Acid Test | 1.74 | 0.39 | 2.64 | n.a |
| Sales/Net Worth | 2.00 | 3.09 | 2.56 | n.a |
| Dividend Payout | 0.00 | 0.00 | 0.00 | n.a |
Appendix
| Sales Forecast | |||||||||||||
| Month 1 | Month 2 | Month 3 | Month 4 | Month 5 | Month 6 | Month 7 | Month 8 | Month 9 | Month 10 | Month 11 | Month 12 | ||
| Sales | |||||||||||||
| Small-size Law Firms | 0% | $0 | $0 | $800 | $900 | $2,200 | $3,100 | $3,545 | $4,874 | $6,574 | $6,987 | $7,784 | $7,985 |
| Medium-size Law Firms | 0% | $0 | $0 | $1,500 | $1,654 | $3,621 | $4,500 | $4,878 | $5,574 | $8,744 | $9,001 | $10,547 | $11,455 |
| Total Sales | $0 | $0 | $2,300 | $2,554 | $5,821 | $7,600 | $8,423 | $10,448 | $15,318 | $15,988 | $18,331 | $19,440 | |
| Direct Cost of Sales | Month 1 | Month 2 | Month 3 | Month 4 | Month 5 | Month 6 | Month 7 | Month 8 | Month 9 | Month 10 | Month 11 | Month 12 | |
| Small-size Law Firms | $0 | $0 | $0 | $0 | $0 | $0 | $0 | $0 | $0 | $0 | $0 | $0 | |
| Medium-size Law Firms | $0 | $0 | $0 | $0 | $0 | $0 | $0 | $0 | $0 | $0 | $0 | $0 | |
| Subtotal Direct Cost of Sales | $0 | $0 | $0 | $0 | $0 | $0 | $0 | $0 | $0 | $0 | $0 | $0 | |
| Personnel Plan | |||||||||||||
| Month 1 | Month 2 | Month 3 | Month 4 | Month 5 | Month 6 | Month 7 | Month 8 | Month 9 | Month 10 | Month 11 | Month 12 | ||
| President | 0% | $2,000 | $2,000 | $2,000 | $2,000 | $2,000 | $2,000 | $2,000 | $2,000 | $2,000 | $2,000 | $2,000 | $2,000 |
| Office Manager | 0% | $0 | $3,000 | $3,000 | $3,000 | $3,000 | $3,000 | $3,000 | $3,000 | $3,000 | $3,000 | $3,000 | $3,000 |
| Receptionist/Secretary | 0% | $0 | $1,440 | $1,440 | $1,440 | $1,440 | $1,440 | $1,440 | $1,440 | $1,440 | $1,440 | $1,440 | $1,440 |
| HR Person | 0% | $0 | $1,440 | $1,440 | $1,440 | $1,440 | $1,440 | $1,440 | $1,440 | $1,440 | $1,440 | $1,440 | $1,440 |
| Account Manager | 0% | $0 | $0 | $0 | $3,000 | $3,000 | $3,000 | $3,000 | $3,000 | $3,000 | $3,000 | $3,000 | $3,000 |
| Total People | 1 | 4 | 4 | 5 | 5 | 5 | 5 | 5 | 5 | 5 | 5 | 5 | |
| Total Payroll | $2,000 | $7,880 | $7,880 | $10,880 | $10,880 | $10,880 | $10,880 | $10,880 | $10,880 | $10,880 | $10,880 | $10,880 | |
| General Assumptions | |||||||||||||
| Month 1 | Month 2 | Month 3 | Month 4 | Month 5 | Month 6 | Month 7 | Month 8 | Month 9 | Month 10 | Month 11 | Month 12 | ||
| Plan Month | 1 | 2 | 3 | 4 | 5 | 6 | 7 | 8 | 9 | 10 | 11 | 12 | |
| Current Interest Rate | 10.00% | 10.00% | 10.00% | 10.00% | 10.00% | 10.00% | 10.00% | 10.00% | 10.00% | 10.00% | 10.00% | 10.00% | |
| Long-term Interest Rate | 10.00% | 10.00% | 10.00% | 10.00% | 10.00% | 10.00% | 10.00% | 10.00% | 10.00% | 10.00% | 10.00% | 10.00% | |
| Tax Rate | 30.00% | 25.00% | 25.00% | 25.00% | 25.00% | 25.00% | 25.00% | 25.00% | 25.00% | 25.00% | 25.00% | 25.00% | |
| Other | 0 | 0 | 0 | 0 | 0 | 0 | 0 | 0 | 0 | 0 | 0 | 0 | |
| Pro Forma Profit and Loss | |||||||||||||
| Month 1 | Month 2 | Month 3 | Month 4 | Month 5 | Month 6 | Month 7 | Month 8 | Month 9 | Month 10 | Month 11 | Month 12 | ||
| Sales | $0 | $0 | $2,300 | $2,554 | $5,821 | $7,600 | $8,423 | $10,448 | $15,318 | $15,988 | $18,331 | $19,440 | |
| Direct Cost of Sales | $0 | $0 | $0 | $0 | $0 | $0 | $0 | $0 | $0 | $0 | $0 | $0 | |
| Other | $0 | $0 | $0 | $0 | $0 | $0 | $0 | $0 | $0 | $0 | $0 | $0 | |
| Total Cost of Sales | $0 | $0 | $0 | $0 | $0 | $0 | $0 | $0 | $0 | $0 | $0 | $0 | |
| Gross Margin | $0 | $0 | $2,300 | $2,554 | $5,821 | $7,600 | $8,423 | $10,448 | $15,318 | $15,988 | $18,331 | $19,440 | |
| Gross Margin % | 0.00% | 0.00% | 100.00% | 100.00% | 100.00% | 100.00% | 100.00% | 100.00% | 100.00% | 100.00% | 100.00% | 100.00% | |
| Expenses | |||||||||||||
| Payroll | $2,000 | $7,880 | $7,880 | $10,880 | $10,880 | $10,880 | $10,880 | $10,880 | $10,880 | $10,880 | $10,880 | $10,880 | |
| Sales and Marketing and Other Expenses | $250 | $250 | $250 | $250 | $250 | $250 | $250 | $250 | $250 | $250 | $250 | $250 | |
| Depreciation | $139 | $139 | $139 | $139 | $139 | $139 | $139 | $139 | $139 | $139 | $139 | $139 | |
| Utilities | $50 | $50 | $50 | $50 | $50 | $50 | $50 | $50 | $50 | $50 | $50 | $50 | |
| Insurance | $500 | $500 | $500 | $500 | $500 | $500 | $500 | $500 | $500 | $500 | $500 | $500 | |
| Rent | $1,500 | $1,500 | $1,500 | $1,500 | $1,500 | $1,500 | $1,500 | $1,500 | $1,500 | $1,500 | $1,500 | $1,500 | |
| Payroll Taxes | 15% | $300 | $1,182 | $1,182 | $1,632 | $1,632 | $1,632 | $1,632 | $1,632 | $1,632 | $1,632 | $1,632 | $1,632 |
| Other | $0 | $0 | $0 | $0 | $0 | $0 | $0 | $0 | $0 | $0 | $0 | $0 | |
| Total Operating Expenses | $4,739 | $11,501 | $11,501 | $14,951 | $14,951 | $14,951 | $14,951 | $14,951 | $14,951 | $14,951 | $14,951 | $14,951 | |
| Profit Before Interest and Taxes | ($4,739) | ($11,501) | ($9,201) | ($12,397) | ($9,130) | ($7,351) | ($6,528) | ($4,503) | $367 | $1,037 | $3,380 | $4,489 | |
| EBITDA | ($4,600) | ($11,362) | ($9,062) | ($12,258) | ($8,991) | ($7,212) | ($6,389) | ($4,364) | $506 | $1,176 | $3,519 | $4,628 | |
| Interest Expense | $0 | $0 | $0 | $0 | $0 | $0 | $108 | $108 | $108 | $108 | $108 | $108 | |
| Taxes Incurred | $0 | $0 | $0 | $0 | $0 | $0 | $0 | $0 | $0 | $0 | $0 | $0 | |
| Net Profit | ($4,739) | ($11,501) | ($9,201) | ($12,397) | ($9,130) | ($7,351) | ($6,636) | ($4,611) | $259 | $929 | $3,272 | $4,381 | |
| Net Profit/Sales | 0.00% | 0.00% | -400.04% | -485.40% | -156.85% | -96.72% | -78.79% | -44.14% | 1.69% | 5.81% | 17.85% | 22.53% | |
| Pro Forma Cash Flow | |||||||||||||
| Month 1 | Month 2 | Month 3 | Month 4 | Month 5 | Month 6 | Month 7 | Month 8 | Month 9 | Month 10 | Month 11 | Month 12 | ||
| Cash Received | |||||||||||||
| Cash from Operations | |||||||||||||
| Cash Sales | $0 | $0 | $0 | $0 | $0 | $0 | $0 | $0 | $0 | $0 | $0 | $0 | |
| Cash from Receivables | $0 | $0 | $0 | $77 | $2,308 | $2,663 | $5,880 | $7,627 | $8,491 | $10,610 | $15,340 | $16,066 | |
| Subtotal Cash from Operations | $0 | $0 | $0 | $77 | $2,308 | $2,663 | $5,880 | $7,627 | $8,491 | $10,610 | $15,340 | $16,066 | |
| Additional Cash Received | |||||||||||||
| Sales Tax, VAT, HST/GST Received | 0.00% | $0 | $0 | $0 | $0 | $0 | $0 | $0 | $0 | $0 | $0 | $0 | $0 |
| New Current Borrowing | $0 | $0 | $0 | $0 | $0 | $0 | $13,000 | $0 | $0 | $0 | $0 | $0 | |
| New Other Liabilities (interest-free) | $0 | $0 | $0 | $0 | $0 | $0 | $0 | $0 | $0 | $0 | $0 | $0 | |
| New Long-term Liabilities | $0 | $0 | $0 | $0 | $0 | $0 | $0 | $0 | $0 | $0 | $0 | $0 | |
| Sales of Other Current Assets | $0 | $0 | $0 | $0 | $0 | $0 | $0 | $0 | $0 | $0 | $0 | $0 | |
| Sales of Long-term Assets | $0 | $0 | $0 | $0 | $0 | $0 | $0 | $0 | $0 | $0 | $0 | $0 | |
| New Investment Received | $0 | $0 | $0 | $0 | $0 | $46,000 | $0 | $0 | $0 | $0 | $0 | $0 | |
| Subtotal Cash Received | $0 | $0 | $0 | $77 | $2,308 | $48,663 | $18,880 | $7,627 | $8,491 | $10,610 | $15,340 | $16,066 | |
| Expenditures | Month 1 | Month 2 | Month 3 | Month 4 | Month 5 | Month 6 | Month 7 | Month 8 | Month 9 | Month 10 | Month 11 | Month 12 | |
| Expenditures from Operations | |||||||||||||
| Cash Spending | $2,000 | $7,880 | $7,880 | $10,880 | $10,880 | $10,880 | $10,880 | $10,880 | $10,880 | $10,880 | $10,880 | $10,880 | |
| Bill Payments | $87 | $2,629 | $3,482 | $3,497 | $3,932 | $3,932 | $3,936 | $4,040 | $4,040 | $4,040 | $4,040 | $4,040 | |
| Subtotal Spent on Operations | $2,087 | $10,509 | $11,362 | $14,377 | $14,812 | $14,812 | $14,816 | $14,920 | $14,920 | $14,920 | $14,920 | $14,920 | |
| Additional Cash Spent | |||||||||||||
| Sales Tax, VAT, HST/GST Paid Out | $0 | $0 | $0 | $0 | $0 | $0 | $0 | $0 | $0 | $0 | $0 | $0 | |
| Principal Repayment of Current Borrowing | $0 | $0 | $0 | $0 | $0 | $0 | $0 | $0 | $0 | $0 | $0 | $0 | |
| Other Liabilities Principal Repayment | $0 | $0 | $0 | $0 | $0 | $0 | $0 | $0 | $0 | $0 | $0 | $0 | |
| Long-term Liabilities Principal Repayment | $0 | $0 | $0 | $0 | $0 | $0 | $0 | $0 | $0 | $0 | $0 | $0 | |
| Purchase Other Current Assets | $0 | $0 | $0 | $0 | $0 | $0 | $0 | $0 | $0 | $0 | $0 | $0 | |
| Purchase Long-term Assets | $0 | $0 | $0 | $0 | $0 | $0 | $0 | $0 | $0 | $0 | $0 | $0 | |
| Dividends | $0 | $0 | $0 | $0 | $0 | $0 | $0 | $0 | $0 | $0 | $0 | $0 | |
| Subtotal Cash Spent | $2,087 | $10,509 | $11,362 | $14,377 | $14,812 | $14,812 | $14,816 | $14,920 | $14,920 | $14,920 | $14,920 | $14,920 | |
| Net Cash Flow | ($2,087) | ($10,509) | ($11,362) | ($14,300) | ($12,504) | $33,851 | $4,065 | ($7,293) | ($6,430) | ($4,310) | $420 | $1,146 | |
| Cash Balance | $56,713 | $46,204 | $34,842 | $20,542 | $8,038 | $41,889 | $45,954 | $38,661 | $32,231 | $27,921 | $28,341 | $29,487 | |
| Pro Forma Balance Sheet | |||||||||||||
| Month 1 | Month 2 | Month 3 | Month 4 | Month 5 | Month 6 | Month 7 | Month 8 | Month 9 | Month 10 | Month 11 | Month 12 | ||
| Assets | Starting Balances | ||||||||||||
| Current Assets | |||||||||||||
| Cash | $58,800 | $56,713 | $46,204 | $34,842 | $20,542 | $8,038 | $41,889 | $45,954 | $38,661 | $32,231 | $27,921 | $28,341 | $29,487 |
| Accounts Receivable | $0 | $0 | $0 | $2,300 | $4,777 | $8,290 | $13,227 | $15,770 | $18,590 | $25,418 | $30,795 | $33,786 | $37,160 |
| Other Current Assets | $0 | $0 | $0 | $0 | $0 | $0 | $0 | $0 | $0 | $0 | $0 | $0 | $0 |
| Total Current Assets | $58,800 | $56,713 | $46,204 | $37,142 | $25,319 | $16,328 | $55,116 | $61,723 | $57,251 | $57,649 | $58,716 | $62,127 | $66,647 |
| Long-term Assets | |||||||||||||
| Long-term Assets | $5,000 | $5,000 | $5,000 | $5,000 | $5,000 | $5,000 | $5,000 | $5,000 | $5,000 | $5,000 | $5,000 | $5,000 | $5,000 |
| Accumulated Depreciation | $0 | $139 | $278 | $417 | $556 | $695 | $834 | $973 | $1,112 | $1,251 | $1,390 | $1,529 | $1,668 |
| Total Long-term Assets | $5,000 | $4,861 | $4,722 | $4,583 | $4,444 | $4,305 | $4,166 | $4,027 | $3,888 | $3,749 | $3,610 | $3,471 | $3,332 |
| Total Assets | $63,800 | $61,574 | $50,926 | $41,725 | $29,763 | $20,633 | $59,282 | $65,750 | $61,139 | $61,398 | $62,326 | $65,598 | $69,979 |
| Liabilities and Capital | Month 1 | Month 2 | Month 3 | Month 4 | Month 5 | Month 6 | Month 7 | Month 8 | Month 9 | Month 10 | Month 11 | Month 12 | |
| Current Liabilities | |||||||||||||
| Accounts Payable | $0 | $2,513 | $3,366 | $3,366 | $3,801 | $3,801 | $3,801 | $3,906 | $3,906 | $3,906 | $3,906 | $3,906 | $3,906 |
| Current Borrowing | $0 | $0 | $0 | $0 | $0 | $0 | $0 | $13,000 | $13,000 | $13,000 | $13,000 | $13,000 | $13,000 |
| Other Current Liabilities | $0 | $0 | $0 | $0 | $0 | $0 | $0 | $0 | $0 | $0 | $0 | $0 | $0 |
| Subtotal Current Liabilities | $0 | $2,513 | $3,366 | $3,366 | $3,801 | $3,801 | $3,801 | $16,906 | $16,906 | $16,906 | $16,906 | $16,906 | $16,906 |
| Long-term Liabilities | $0 | $0 | $0 | $0 | $0 | $0 | $0 | $0 | $0 | $0 | $0 | $0 | $0 |
| Total Liabilities | $0 | $2,513 | $3,366 | $3,366 | $3,801 | $3,801 | $3,801 | $16,906 | $16,906 | $16,906 | $16,906 | $16,906 | $16,906 |
| Paid-in Capital | $65,000 | $65,000 | $65,000 | $65,000 | $65,000 | $65,000 | $111,000 | $111,000 | $111,000 | $111,000 | $111,000 | $111,000 | $111,000 |
| Retained Earnings | ($1,200) | ($1,200) | ($1,200) | ($1,200) | ($1,200) | ($1,200) | ($1,200) | ($1,200) | ($1,200) | ($1,200) | ($1,200) | ($1,200) | ($1,200) |
| Earnings | $0 | ($4,739) | ($16,240) | ($25,441) | ($37,838) | ($46,968) | ($54,319) | ($60,955) | ($65,567) | ($65,308) | ($64,379) | ($61,108) | ($56,727) |
| Total Capital | $63,800 | $59,061 | $47,560 | $38,359 | $25,962 | $16,832 | $55,481 | $48,845 | $44,233 | $44,492 | $45,421 | $48,692 | $53,073 |
| Total Liabilities and Capital | $63,800 | $61,574 | $50,926 | $41,725 | $29,763 | $20,633 | $59,282 | $65,750 | $61,139 | $61,398 | $62,326 | $65,598 | $69,979 |
| Net Worth | $63,800 | $59,061 | $47,560 | $38,359 | $25,962 | $16,832 | $55,481 | $48,845 | $44,233 | $44,492 | $45,421 | $48,692 | $53,073 |


