
The Athlete's Foot
Executive Summary
The Athlete’s Foot store in Pine Ridge Square will become the athletic footwear headquarters for the City of Coral Springs, Florida.
There are 29,000 school-aged children, of which over 11,000 participate in the city’s 16 structured athletic programs. There are 27 schools, with varying degrees of athletic programs, within three miles of the proposed location.
There are 57,000 adults between the ages of 20 and 54 within three miles of the center. That is the prime age of Florida’s running community. In January’s Walt Disney Marathon & 1/2 Marathon in Orlando, there were approximately 250 participants from Coral Springs, Coconut Creek, and Parkland. That is just an example of the abundance of dedicated runners in the community. There are no stores in Coral Springs which offer a collection of “serious” running shoes, or offer the novice or “less serious” runner a quality selection and education on the proper style, fit, and sizing for their needs.
The Athlete’s Foot will focus on the above two market segments. By capturing those primary customers, the balance of residents with sports shoe needs will be drawn to us, the obvious headquarters for athletic footwear.
The store will be located at the intersection of University Drive and Wiles Road. The key co-tenants are: Fresh Market, Bed Bath & Beyond, Blockbuster Video, Play It Again Sports (they do not sell athletic shoes), a 10,000 sq. ft. daycare center, a children’s and young men’s specialty clothing store, a learning center, four restaurants, and several other youth-oriented businesses. At the same intersection are: Kmart, Steinmart, Winn Dixie, McDonald’s, Wendy’s, three banks, six additional restaurants, and three gas stations. In total, there is approximately 400,000 sq ft of retail space at this intersection. University Drive is being extended north through Boca Raton. Wiles Road is being extended east, through Coconut Creek. There are approximately 55,000 cars per day traveling through the intersection.
There is minimal competition within Coral Springs. There are several “Mall” stores, which cater to a fashion athletic footwear customer. They offer limited service and virtually no technical knowledge or expertise for running shoes. As well, they make minimal effort at capturing the “sports specific” footwear, such as soccer, baseball, or football cleats, or related accessories.
The Athlete’s Foot will be a franchise of The Athlete’s Foot, Inc., recognized as the world’s leader in athletic footwear franchising. The Athlete’s Foot has over 700 company owned and franchised stores in 33 countries. By becoming an Athlete’s Foot franchise, we benefit from a comprehensive support program that includes:
- Access to special vendor discounts including; Nike, Reebok, Fila, New Balance, Adidas, Converse, Brooks, etc.
- Advice and assistance in real estate selection and negotiation
- Proven store design, fixturing, and layout
- Planned merchandising system, assortment direction, and coordinated inventory control
- Comprehensive training in all facets of the athletic footwear business through required seminars and workshops
- Ongoing support through video, monthly publications, regional meetings, and co-franchise networking
- National Advertising Program and assistance with the local advertising campaign
- The most sophisticated “Fit Technician” and Research and Development programs in the industry.
1.1 Objectives
The primary objectives of the business plan for The Athlete’s Foot are outlined below.
- To make The Athlete’s Foot the headquarters for athletic footwear by offering knowledgeable and professional customer service. Customer service will be measured through repeat business (our goal is that 50% of our customers will return within 6 months for an additional purchase) and multiple sales (our goal is that 30% of our non-running and 60% of our running shoe sales are accompanied by an additional purchase).
- To be an active participant and supporter of the Coral Springs Athletic Community and to develop a youth and adult running club to promote a healthy lifestyle through exercise. Our goal is to have 150 running club members by the end of the 18th month of club operation.
- To achieve a 33% increase in sales year two and maintain a minimum annual increase of 15% thereafter.
1.2 Mission
The Athlete’s Foot is a retail store specializing in the sale of true athletic footwear for the entire family. The store will emphasis the sale of children’s athletic shoes and a full assortment of men’s, women’s, and children’s running shoes and accessories. We will provide consumers with technical knowledge on the proper fit and style of athletic footwear for their various needs. We will be the only full-service athletic footwear store with quality, knowledgeable sales help in this city of 100,000 people.
Our goal is to be the headquarters for the Coral Springs athlete. Coral Springs has one of the largest and most sophisticated community athletic programs in the United States. There are approximately 29,000 school-aged children within three miles of the planned store location.
We believe that to attain our headquarters position, we will need to become a visible member of the athletic community through sponsorship, seminars, team and league promotions and the development of a community running program.
Company Summary
The Athlete’s Foot sells quality athletic footwear for the entire family, specializing in running shoes and accessories. We have selected a location in a renovated shopping center anchored by Fresh Market, Bed Bath and Beyond, Blockbuster Video, and four restaurants. The balance of tenants caters primarily to children. The quality of our customer service and the lack of competition in the city will allow us to quickly become the footwear headquarters for the local individual athlete and various teams, leagues and schools. This Athlete’s Foot store, while part of a worldwide chain, will be family owned and operated.
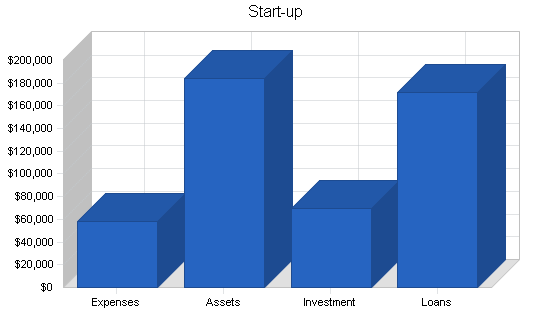
2.1 Start-up Summary
The start-up costs include:
- Store build out the store and operations
- Inventory control, (computers and cash registers)
- The foot scanner and fixture
- Opening inventory
- Franchise Fee.
Start-up costs will be financed through a combination of owner investment, short-term loans and lines of credit, and long-term borrowing. The start-up chart and table show the distribution of the planned financing.
| Start-up Funding | |
| Start-up Expenses to Fund | $58,000 |
| Start-up Assets to Fund | $184,000 |
| Total Funding Required | $242,000 |
| Assets | |
| Non-cash Assets from Start-up | $156,000 |
| Cash Requirements from Start-up | $28,000 |
| Additional Cash Raised | $0 |
| Cash Balance on Starting Date | $28,000 |
| Total Assets | $184,000 |
| Liabilities and Capital | |
| Liabilities | |
| Current Borrowing | $20,000 |
| Long-term Liabilities | $150,000 |
| Accounts Payable (Outstanding Bills) | $2,000 |
| Other Current Liabilities (interest-free) | $0 |
| Total Liabilities | $172,000 |
| Capital | |
| Planned Investment | |
| Investor 1 HKL | $70,000 |
| Investor 2 | $0 |
| Other | $0 |
| Additional Investment Requirement | $0 |
| Total Planned Investment | $70,000 |
| Loss at Start-up (Start-up Expenses) | ($58,000) |
| Total Capital | $12,000 |
| Total Capital and Liabilities | $184,000 |
| Total Funding | $242,000 |
| Start-up | |
| Requirements | |
| Start-up Expenses | |
| Accountant | $1,000 |
| Legal | $2,500 |
| Stationery etc. | $1,000 |
| Architect / Design Assistance | $2,500 |
| Training | $3,000 |
| Insurance | $600 |
| Security Deposit & 1st Months Rent | $4,700 |
| Pre-opening Marketing | $5,000 |
| Franchise Fee | $25,000 |
| Misc. / Contingency | $12,700 |
| Total Start-up Expenses | $58,000 |
| Start-up Assets | |
| Cash Required | $28,000 |
| Start-up Inventory | $85,000 |
| Other Current Assets | $1,000 |
| Long-term Assets | $70,000 |
| Total Assets | $184,000 |
| Total Requirements | $242,000 |
Products
The Athlete’s Foot will sell the latest and most popular name brand athletic footwear for the family. Consumers will be educated as to the proper size, style, fit, and design needed for their particular use and foot characteristics. We will offer athletic footwear and accessories for almost every sport and active use. We do not intend to initially sell golf shoes or skates.
The shoes are purchased from the top manufacturers in the world, made possible through The Athlete’s Foot Corporation’s 700-store buying power. Names such as Nike, Adidas, Puma, Converse, New Balance, Asics, Saucony and Brooks are just a few of the styles we will be stocking. Inventory is tracked through our online cash register and computerized tracking system. Each day we are aware of the style, size, and quantity of every item sold in the store. Re-orders are drop shipped by the manufacturers, or can be rush ordered directly form The Athlete’s Foot warehouse, if needed.
Brought to you by
Create a professional business plan
Using AI and step-by-step instructions
Create Your PlanSecure funding
Validate ideas
Build a strategy
The opening order will be placed through The Athlete’s Foot Corporate Warehouse, with their assistance as to styles and size runs. We will also be working with several other franchisees who have family footwear and specialized running stores for their input into our merchandise assortment. Over the first year, we will eventually place orders directly with the manufacturers, always having The Athlete’s Foot as backup for stock if required, due to a run on a popular shoe.
Market Analysis Summary
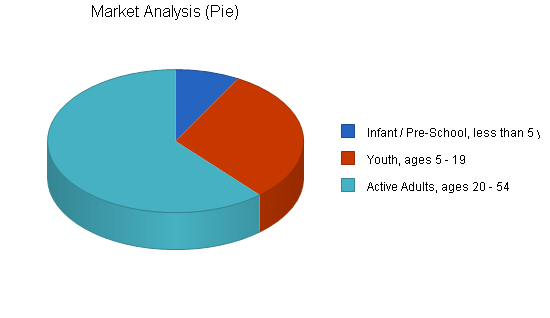
There are approximately 110,000 residents living within three miles of Pine Ridge Square. Twenty-six percent, (29,000) are between the ages of five and nineteen. Fifty-two percent, (57,000) are between the ages of twenty and fifty-four. Coral Springs has one of the strongest youth athletic programs in the country. There were 11,359 children participating in the 16 various sports programs throughout the year. In addition, through the YMCA and other non-municipal sponsored leagues and programs there is an additional 3,500 children participants. This does not include the residents of neighboring cities like Parkland and Coconut Creek, which are within the market area and have an additional 3,000 participants. The city has 47 public parks, of which the six largest are devoted solely to athletics. The three-mile radius has four high schools, four middle schools, and 14 elementary schools in the public school system. There are an additional five private schools and three new schools planned for the next 18 months. Coral Springs is a young, active community, with outdoor sports played year round. The need for cold weather boots and shoes does not exist, therefore, athletic shoes are worn year round.
The residents of Coral Springs are in the upper income brackets, with an average income of approximately $68,000 per year. Eighteen percent of the area’s population earn in excess of $100,000 per year. In the next three years, that percentage is expected to increase to 25%. This affluent, active resident is willing to buy the latest in athletic footwear, if the service and assortment are strong.
The top two ACORN Consumer Groups determined by CACI, an international information technology corporation, within three miles are: Prosperous Baby Boomers, (30.7%) and Baby Boomers with Children, (17.4%). These are our primary target markets.
While we have focused on the immediate three-mile radius of residents, the co-tenancy of Fresh Market and Bed Bath and Beyond will generate customers from a 5 – 7 mile radius. Additionally, there are two specialty retailers in the center, Widensky’s Children’s Clothing and Jonathan Reed Young Men’s Clothing, which have a customer base throughout Broward and Palm Beach Counties.
We are confident that we will capture the true athletic adult with our assortment and service. By capturing the children’s business, through the same assortment and service, we can also become the “family athletic footwear store.” While the typical “family adult” may not be as “active” as our target runner, the convenience and professional service we will provide will allow us to become “their” athletic footwear store.
To recap, our target markets are:
- The True Athletic Adult
- The True Athletic Participant Children.
By serving these customers well, the balance of the less active community will identify The Athlete’s Foot as the athletic footwear headquarters.
4.1 Market Segmentation
The Athlete’s Foot feels there are two types of customers the store needs to attract: the Runners and the Non-runners. These groups are subdivided in the following sections.
4.1.1 Runners
- “True Runner” – Runs between 20 – 40 miles per week. This person is generally between 30 – 45 years old, both male and female. This segment may also include high school track and cross country runners. This person wants the latest in technology, regardless of price. The True Runner would be the running circuit’s answer to the “computer freak.” You may find him/her running at 5:00 a.m. or 10:00 p.m., whenever it can be fit into his/her schedule. The True Runner frequently runs in races throughout Florida and may even travel further to combine races with social visits or vacations. Generally, the True Runner is in the upper income brackets. There are 6,000 families earning over $100,000 per year within three miles of the proposed location.
- “Weekend Warrior” – May run up to 20 – 25 miles per week, but most of that is on Saturday and Sunday. A job or family restriction may not allow running to be scheduled during the week. This segment includes males and females between the ages of 25 – 35. This person is most frequently the parent of a young family and is looking for quality and an affordable price. The Weekend Warrior will run in local races. Typically, the Weekend Warrior is in the upper-middle income bracket: often two spouses working, with substantial disposable income. There are close to 12,000 families in this income bracket within three miles of the proposed location.
- “Running for Attention” – People in this segment run 6 – 10 miles per week. He/she wants to look like a runner regardless of ability and will frequently go to parks, the beach, and other highly visible places to run. Most often is a single person looking to meet other singles. Interested in the latest styles, but, he/she must look good. A person who is Running for Attention purchases coordinated outfits and accessories, running bottles, and timing watches. This segment also spans both males and females between the ages of 30 – 55. A member of this segment can be seen frequently at races, but not always running. He/she also belongs to local health or tennis club. There are approximately 7,000 single households within three miles of the proposed location.
- “Running for Need” – Two different groups within this classification.
- The first is the ex-high school or college runner. He feels the need to remain active/competitive, but does not have the discipline to train alone. Will become an active runner in spurts, but not consistently because he needs motivation. Typically, the Running for Need segment is comprised of males between the ages of 18 – 30.
- The second are the individuals who have been told by a doctor, spouse, or employer that they need to get into better shape … or else! This is a very enthusiastic runner initially, but, quickly realizes that this is not always fun and can become very boring. Again, not a consistent runner, but, can become one if they remain motivated. Motivation relies heavily on the support of family and friends. While it is impossible to determine the number of people in this segment, these folks may be one of the easier to contact. Through medical journals, health food stores, and medical offices, this is a prime target for referral marketing.
- “Running Fashion” – This is someone who purchases running shoes, but, is not a runner. He/she simply likes the style or the feel of a quality running shoe. Many working people on their feet for extended periods, factory workers, delivery people, airport employees, any type of outdoor work not requiring safety shoes, and students are a few examples.
4.1.2 Non-runners
- Infants – While not a high volume, the first pair of shoes for most infants is an athletic style. The first pair of Nikes or Pumas can be a very proud moment in a young family’s development. Being able to properly measure and fit an infant’s foot is critical to developing a following in this market segment. Credibility in the sales to the parents or older sibling will determine if you receive to opportunity to serve the newest member of the family. There are approximately 6,000 children below the age of five within three miles of the proposed location.
- Children – Possibly the most important segment other than adult running. With approximately 20,000 potential customers, this group must be a primary focus for any family business. Regardless of athletic level of participation or interest, virtually every child has at least one pair of athletic shoes. More often, children have several, depending on their preference of sports or style. The importance of capturing this business is intensified based upon the built-in obsolescence due to the growth of their feet. There are approximately 17,500 children between 5 – 12 within three miles of the proposed location.
- Teens – This used to be the most important segment in athletic footwear. The local teen boy and girl had to have the new Michael Jordan high-tops, at $100, every eight months. Today, that need has diminished, but teens still remain a critical element to a successful athletic shoe retailer. While it may not be the “required” footwear in middle or high school, it remains a primary asset of every teen’s wardrobe. Due to their ever-present concern for being in style, most Coral Springs teens still require name brand, in-style athletic shoes in their stable of footwear. As well, every teen needs a pair for practical use. That may include participant sports, physical education class, or simply something to wear with jeans. Teens also wear a lot of sandals and athletic aqua/sandals, which are newer categories in athletic footwear stores. Coupled with their still-growing shoe size and concern for the latest style, teens remain an important focus. There are approximately 10,500 teenagers within three miles of the proposed location.
- Adults/Non Participant – While some adults never participate in a sport, almost all own a pair of athletic shoes. The non-participant adult may be the most difficult segment to capture. The upper income adult will still want name brand newer styles. The middle and lower income adults will look to the discount department stores and “discount shoe warehouse” concepts for practical athletic footwear. This customer is also less concerned about customer service and the proper fit, since they are not as hard on their athletic shoes and buy less frequently.
- Active Young Adult – Twenty to twenty-four years old. This is a small segment, approximately 5,500 people, but these individuals tend to be very active. Participating in sports is still a social activity for this primarily single group. Baseball, Basketball, Softball, Soccer, and Flag Football leagues are popular with this age.
- Adults/Participant – Twenty-five years old and above. This segment can be divided best by income level.
- An active, upper income participant will look for quality, name-brand footwear based upon the sport that requires the purchase. These adults are willing to pay a higher price for a new style or features they deem are important.
- The active middle income participant will again look for a quality shoe at a competitive price. This group may not require the newest style, but still wants good quality with basic features for the sport they participate in.
Brought to you by
Create a professional business plan
Using AI and step-by-step instructions
Create Your PlanSecure funding
Validate ideas
Build a strategy
4.2 Target Market Segment Strategy
We will focus on two primary market segments:
- The “Active Family” – The Active Family will be the focus of our non-running marketing effort. They give us the largest target, most opportunity for multiple sales, and allow us to gain further access into the community’s numerous leagues. A typical active family would be described as parents in their late 30’s and early 40’s with two children. If the children each play two sports, that would require a minimum of two pair of shoes per year, for each. If the parents are also active, that could amount to an additional two pair per year. With the need to purchase six pair of shoes per year, we expect this family to make shoe purchases anywhere from three to six times during the year. They may visit the store an additional three to four times for accessories or simply to browse while in the center. For example, there are 13,000 participants in the Coral Springs Youth Soccer Program. Every one of them needs a new pair of soccer cleats every year. Currently, they need to leave Coral Springs to get a good selection of styles. This is a volume customer, but our goal is that the entire family comes along for the ride, and through service and knowledgeable sales help, an additional sale is consummated. This average sale will be approximately $40.
- The “True Runner/Weekend Warrior” – The next most important segments will be the participant runner. The average sale for this customer will be between $70 – $90. This customer should always make an additional purchase when visiting. Running socks, running apparel, running accessories, or supplements should be added to this ticket. By capturing the True Runner, the less serious runner will be attracted to the store to be able to associate with their more serious counterpart.
We anticipate that 70% of our annual volume will come from these two classifications. The balance will be sport-specific buyers and non-family participants.
4.3 Industry Analysis
The retail athletic footwear business has been tarnished in the past two years due in part to the failure of several highly visible large store formats. Most recently, Just For Feet filed Chapter 11 and is currently liquidating the entire company stock. In addition, several large general sporting goods retailers have either closed entirely or reduced the number of stores in the chain. There are a number of reasons for this demise, the lack of demand for high-priced basketball shoes being a primary reason.
For the general sporting goods chains, the drop in basketball shoe sales as well as the drop in popularity of NBA/Logo clothing has taken it’s toll. The “superstore” concept in the sale of athletic shoes has proven to be unsuccessful. You can sell as many shoes in 2,000 sq. ft. as they were selling in 15,000 sq. ft. Neither of those concepts provided competent customer service in the purchase of a pair of participant shoes. Too many styles causing broken size ranges and constant clearance sales educated the consumer to not rush out to buy a new offering. Anyone looking for technical information when purchasing a pair of running shoes was simply unable to find it.
Successful athletic shoe stores are offering quality customer service and a strong assortment of the new style of shoes. They must also offer shoes in all price ranges, to assure that the entire family can be satisfied.
Our aggressive sales and marketing approach, while slightly reducing the gross margin, will allow for anticipate significant increases in volume (33% year two), to offset any reduction in net profits.
4.3.1 Competition and Buying Patterns
When purchasing athletic footwear, customers need a knowledgeable sales person to guide them to the proper shoe. By offering our exclusive Athlete’s Foot Computerized Scanner, as well as extensively trained associates, called Fit Technicians, we will provide the most sophisticated service in the market.
The competition within Coral Springs consists primarily of the regional mall athletic footwear stores. There are three stores in Coral Square Mall, all company owned. These stores cater to the “fashion athletic” customer. Coral Square Mall is a “B” mall, and has a reputation within the community of being a “hangout” for teenagers and gangs. The true participants generally have to leave Coral Springs for Boca Raton or East Ft. Lauderdale to shop in specialty running or sporting goods stores. Our advantage over these mall stores will be superior customer service and technical knowledge, and a more convenient atmosphere, which the mall stores cannot reproduce.
There are three children’s specialty stores that carry infant and children’s athletic footwear in Coral Springs. One is well entrenched in the community and will be a difficult competitor. Our advantage over these stores will be our larger assortment, specialty sport shoes (which these stores do not carry, ex; soccer and baseball cleats), and the ability to serve the entire family’s athletic footwear needs. Our challenge will be their ability to provide non-athletic shoes for the youth customer.
The other competition will come from discount department stores (Wal-Mart, Kmart, Target), and discount “rack” shoe stores (Payless, Rack Room, Famous Footwear). These stores will serve the non-participant athletic shoe customer, which is not a primary customer of ours. We will carry an assortment of discontinued and clearance shoes, which should help us to be competitive with these stores.
Strategy and Implementation Summary
The Athlete’s Foot uses a strategy of providing a service to the entire market. While we will focus on our two primary customer segments (active families and runners), we offer a product that virtually every consumer requires.
We will create an atmosphere that is appealing to the “true athletic footwear customer.” The balance of customers will come because they will see this as the “place” where athletes buy their shoes.
The store will be merchandised in an exciting, athletic atmosphere. Televisions will continually play tapes of sporting events and live sports broadcasts. There will be posters highlighting the top athletes and their athletic shoe choices. There will also be a section to pick up information about upcoming races, events, and seminars. Eventually, race sign-ups will occur in the store as well as presentations from shoe manufacturers, product representatives, nutritionists, trainers, coaches, runners and hopefully, professional athletes.
Strategic Assumptions:
- Every resident in Coral Springs is a potential customer.
- This location and co-tenancy gives us an opportunity to draw customers from outside Coral Springs.
- By marketing to our two target segments, we will expose ourselves to additional new customers.
- We will aggressively pursue the community sports programs through sponsorships.
- We will build a running club/program, that caters to the “average” runner, versus the other clubs which cater to a more serious competitive runner.
5.1 Competitive Edge
Initially, our competitive edge will be the recognition of The Athlete’s Foot as a national chain. There is a sense of comfort buying from a large chain. Our complete assortment and high-tech design will also immediately appeal to customers.
Once established, our superior customer service will set us apart from the competition. The foot scanner, which is proprietary to The Athlete’s Foot, is an exciting development in quality athletic footwear service. This computerized scanner will actually prepare a “Fitprint,” which determines the pressure points, balance, and wearing characteristics of your foot. The conversion rate to sales from customers using this Fitprint service is 70%.
Brought to you by
Create a professional business plan
Using AI and step-by-step instructions
Create Your PlanSecure funding
Validate ideas
Build a strategy
The other edge we want to develop in the future is to be the “meeting place” for Coral Springs runners. This will be accomplished through our planned running club, sponsored races, sponsored fun runs, run for health awards programs, children and adult running clinics, and footwear seminars. In addition, we will be stocking a full assortment of running supplements, hydration fluids, protein bars, and other items that may be needed on a short notice basis. We have even envisioned a credit system where local runners can plan a rest/drink break in the store when running the local paths. They can stop in for hydration fluids or protein bars without having to carry money.
We have spoken with the Director of the Parks & Recreation Department for the City of Coral Springs. He has indicated that he would consider a program where The Athlete’s Foot offers participants a 10% discount on all shoe purchases from the store. The customer would receive 5% and the league would receive 5%. In this manner, the league would support and promote the opportunity by including a flyer/coupon in the sign-up package for each participant.
5.2 Sales Strategy
All potential sales will be attended to in a timely fashion. While there will be a sales incentive bonus program, long-term salesperson relationships will take precedence over sales closures. Our goal is that 50% of our customers return within six months. We will market directly to the customer through mailings, phone calls, league presentations, and Internet/email contact.
Sales associates will be trained to “turn-over” a customer who has a more specialized need, if they cannot fully service the requirement.
Special orders will be encouraged as a method to satisfy a specialized need. We will enforce as liberal a return policy as possible. Because of our affiliation with the 700-store Athlete’s Foot chain, we can demand a higher level of service from vendors in regards to returns and special orders.
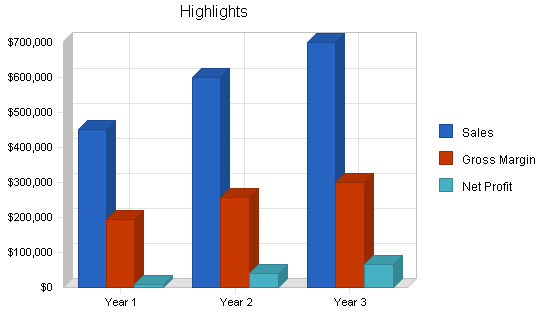
5.2.1 Sales Forecast
The following table and chart show the forecasted sales for The Athlete’s Foot.

| Sales Forecast | |||
| Year 1 | Year 2 | Year 3 | |
| Sales | |||
| Footwear Sales | $427,500 | $570,000 | $665,000 |
| Accessories / Apparel | $22,500 | $30,000 | $35,000 |
| Total Sales | $450,000 | $600,000 | $700,000 |
| Direct Cost of Sales | Year 1 | Year 2 | Year 3 |
| Footwear Sales | $235,125 | $313,500 | $365,750 |
| Accessories / Apparel | $12,375 | $16,500 | $19,250 |
| Subtotal Direct Cost of Sales | $247,500 | $330,000 | $385,000 |
Management Summary
The Athlete’s Foot Franchise will be owned by Jane and Howard Lefkowitz. Jane has been a public school teacher for the past 14 years in Dade County, Florida. Howard is the President of Sizeler Real Estate of Florida. Inc., which manages, leases, and develops 1 million sq. ft. of retail property in Florida for a NYSE REIT. Jane will run the daily operations of the business, including community relations. Howard will continue in his current position at Sizeler, but will assist in the buying, financial planning, and weekend coverage.
6.1 Personnel Plan
The personnel plan is included in the following table. It shows the anticipated salary of the owner, assistant manager, full-time associate, and three part-time associates.
Jane Lefkowitz will manage the store on a daily basis. There will be a salaried assistant manager. We anticipate one additional full-time employee. One of these three people will open and close the store each day. The three part-time associates will work nights and weekend hours. In addition, Jessica Lefkowitz will work an average of one night and one weekend day per week. Howard Lefkowitz will also assist on the weekends. Salary and hourly wage estimates are detailed in the table below.
Below we have created a brief job profile and anticipated employee characteristics for each position. As we have stressed throughout the plan, customer service and knowledgeable employees are a primary focus for The Athlete’s Foot.
Assistant Manager:
- Responsibility for opening and closing the store, receiving and stocking inventory, upkeep of the customer data base, visual merchandising and customer service. Also, share in the supervision and training of staff.
- This person would not necessarily need to be athletic or a runner. We are looking for dedication, honesty, strong work ethic and either some retail management experience or a strong business sense. Although a college graduate would be preferred, our salary projection may preclude that. This position has the most flexibility, due to the importance of experience and reliability. This associate would do less selling and more stock work and supervision than the others. A middle-aged woman whose children are in high school and is looking to get back into the work force may be an ideal candidate. In addition, a recent high school or military service graduate with a strong work ethic may also fit this position. This position will be eligible for a monthly overall sales incentive and annual goals bonus.
Full-time Associate:
- This position will be primarily customer service oriented. This person will also assist with store opening and closing, as well as receiving merchandise. We would anticipate that this individual would have several specific areas of responsibility outside of sales. Those might be vendor returns and sales floor pricing.
- This associate would preferably have a background in retail shoe sales. They need the flexibility to work nights and weekends as required. We would like this associate to be a local resident, active in the community, possibly in the sports programs. A runner would be ideal for this position, but, certainly we cannot count on finding a person with each of those credentials. This position will be eligible for a sales-based incentive program.
Part-time Associates:
- These associates would focus primarily on customer service. They will be working during the peak sales periods, in the evenings, and on weekends. They will need to be outgoing, friendly, professional, and presentable. They will need to be able to work well with children. While this type of position in our competition is generally filled with teenagers, we will be looking for local athletic teachers, coaches, and athletes who are looking to supplement their income. There will be a bonus program for generating leads on community contacts and sponsor programs, as well as for exceeding their sales goals.
| Personnel Plan | |||
| Year 1 | Year 2 | Year 3 | |
| Jane Lefkowitz, Owner / Mgr. / $18.K / Yr. | $18,000 | $20,700 | $23,500 |
| Assistant Store Manager / $18K / Yr. | $18,000 | $20,700 | $23,500 |
| Key Assoc. / $8.00 hr. – 40 hrs. | $15,104 | $17,000 | $18,275 |
| Part Time Assoc. “A” – $6.00 / Hr.- 12 hrs | $3,456 | $4,000 | $4,500 |
| Part Time Assoc. “B” – $6.00 / Hr. – 8 hrs. | $2,304 | $2,550 | $2,825 |
| Part Time Assoc. “C” – $6.00 / Hr. – 8 hrs. | $2,304 | $2,550 | $2,825 |
| Total People | 6 | 7 | 7 |
| Total Payroll | $59,168 | $67,500 | $75,425 |
Financial Plan
Sales growth will be aggressive the first 18 months as we sharpen our merchandise assortment, size scales, and stock levels to better meet our customer’s requirements. We anticipate a sales increase of 33% during our second year of operation.
Marketing will continue to average 3% of total sales.
We will invest residual profits into reducing debt and the lost income from large cash holdings.
Company expansion, while not a necessity, will be an option if sales projections are met and/or exceeded.
7.1 Important Assumptions
- The Athlete’s Foot will grant a restriction against competitive stores within four miles of this location, other than the existing store in Coral Square Mall.
- The Athlete’s Foot will continue it’s program of promoting better running shoes on a national level.
- The space selected for this store will require minimal demolition and no changes to the restrooms, electrical, plumbing, or storefront to open The Athlete’s Foot.
- Bed, Bath & Beyond, Fresh Market and Blockbuster, which have all confirmed that these are strong locations, will remain in the center for at least the first three years of our operation.
- We will be able to become an active sponsor of community sports within the City of Coral Springs.
- We anticipate that we will be able to complete required financing, lease documents, franchise documents and space buildout to allow for a July 2000 opening. If not, we would most likely open in October, to be prepared for the holiday season.
| General Assumptions | |||
| Year 1 | Year 2 | Year 3 | |
| Plan Month | 1 | 2 | 3 |
| Current Interest Rate | 9.00% | 9.00% | 9.00% |
| Long-term Interest Rate | 10.00% | 10.00% | 10.00% |
| Tax Rate | 15.00% | 25.00% | 15.00% |
| Other | 0 | 0 | 0 |
7.2 Projected Profit and Loss
We predict that during the second year of operation, our high level of customer service and strong assortment will allow us to generate approximately 5% profit. This will be above the normal two to three year period required for a start-up retailer. Our sales projections are conservative. Should sales increase as we anticipate, the profit-to-sales ratio could be as high as 10% by the end of year three.


| Pro Forma Profit and Loss | |||
| Year 1 | Year 2 | Year 3 | |
| Sales | $450,000 | $600,000 | $700,000 |
| Direct Cost of Sales | $247,500 | $330,000 | $385,000 |
| Other | $9,000 | $12,000 | $14,000 |
| Total Cost of Sales | $256,500 | $342,000 | $399,000 |
| Gross Margin | $193,500 | $258,000 | $301,000 |
| Gross Margin % | 43.00% | 43.00% | 43.00% |
| Expenses | |||
| Payroll | $59,168 | $67,500 | $75,425 |
| Sales and Marketing and Other Expenses | $44,627 | $53,700 | $59,750 |
| Depreciation | $0 | $0 | $0 |
| Royalties (5%) | $22,500 | $30,000 | $35,000 |
| Insurance | $5,850 | $7,800 | $9,100 |
| Rent | $27,200 | $27,200 | $27,200 |
| Payroll Taxes | $5,917 | $6,750 | $7,543 |
| Other | $0 | $0 | $0 |
| Total Operating Expenses | $165,262 | $192,950 | $214,018 |
| Profit Before Interest and Taxes | $28,238 | $65,050 | $86,983 |
| EBITDA | $28,238 | $65,050 | $86,983 |
| Interest Expense | $15,281 | $12,593 | $9,788 |
| Taxes Incurred | $4,683 | $13,114 | $11,579 |
| Net Profit | $8,274 | $39,343 | $65,616 |
| Net Profit/Sales | 1.84% | 6.56% | 9.37% |
7.3 Break-even Analysis
A Break-even Analysis table has been completed on the basis of average costs/prices. With fixed costs, per average sale and average variable costs, we need monthly sales, as shown below, to break even.

| Break-even Analysis | |
| Monthly Revenue Break-even | $30,604 |
| Assumptions: | |
| Average Percent Variable Cost | 55% |
| Estimated Monthly Fixed Cost | $13,772 |
7.4 Projected Cash Flow
We are positioning ourselves as a minimal risk concern, with steady cash flows. While we have not accounted for it in the projections, we anticipate receiving two or three months free base rent after store opening. That will help us reduce costs and increase marketing during the start-up period. We have allowed for a more aggressive cash balance initially, to allow us to react quickly to unforseen merchandise needs, missed classifications, “hot item” reorders and hopefully, higher than anticipated sales. This is particularly important for our first back to school and holiday sales periods. If we capture previous “mall customers” as anticipated, our sales could increase as much as 25% during the first two quarters of operations.
Once we have established a required cash balance level, (approximately six months after opening), we will reduce the projected cash balance to decrease debt and decrease the opportunity of cash held.

| Pro Forma Cash Flow | |||
| Year 1 | Year 2 | Year 3 | |
| Cash Received | |||
| Cash from Operations | |||
| Cash Sales | $450,000 | $600,000 | $700,000 |
| Subtotal Cash from Operations | $450,000 | $600,000 | $700,000 |
| Additional Cash Received | |||
| Sales Tax, VAT, HST/GST Received | $0 | $0 | $0 |
| New Current Borrowing | $0 | $0 | $0 |
| New Other Liabilities (interest-free) | $0 | $0 | $0 |
| New Long-term Liabilities | $0 | $0 | $0 |
| Sales of Other Current Assets | $0 | $0 | $0 |
| Sales of Long-term Assets | $0 | $0 | $0 |
| New Investment Received | $0 | $0 | $0 |
| Subtotal Cash Received | $450,000 | $600,000 | $700,000 |
| Expenditures | Year 1 | Year 2 | Year 3 |
| Expenditures from Operations | |||
| Cash Spending | $59,168 | $67,500 | $75,425 |
| Bill Payments | $291,509 | $489,471 | $558,653 |
| Subtotal Spent on Operations | $350,677 | $556,971 | $634,078 |
| Additional Cash Spent | |||
| Sales Tax, VAT, HST/GST Paid Out | $0 | $0 | $0 |
| Principal Repayment of Current Borrowing | $4,500 | $4,500 | $4,500 |
| Other Liabilities Principal Repayment | $0 | $0 | $0 |
| Long-term Liabilities Principal Repayment | $24,000 | $24,000 | $24,000 |
| Purchase Other Current Assets | $0 | $0 | $0 |
| Purchase Long-term Assets | $0 | $0 | $0 |
| Dividends | $0 | $0 | $0 |
| Subtotal Cash Spent | $379,177 | $585,471 | $662,578 |
| Net Cash Flow | $70,823 | $14,529 | $37,422 |
| Cash Balance | $98,823 | $113,352 | $150,774 |
7.5 Projected Balance Sheet
All of our tables will be updated monthly to reflect past performance and future assumptions. Future assumptions will not be based solely on past performance but rather on economic cycle activity, regional retail indicators, national athletic footwear trends, and future cash flow possibilities. We have been, and will continue to be, working with an experienced partner in a large and well respected regional CPA firm, who has both personal and professional experience in start-up retail operations.
We expect solid growth in net worth beyond the first fiscal year of operation.
| Pro Forma Balance Sheet | |||
| Year 1 | Year 2 | Year 3 | |
| Assets | |||
| Current Assets | |||
| Cash | $98,823 | $113,352 | $150,774 |
| Inventory | $22,052 | $29,403 | $34,303 |
| Other Current Assets | $1,000 | $1,000 | $1,000 |
| Total Current Assets | $121,875 | $143,755 | $186,077 |
| Long-term Assets | |||
| Long-term Assets | $70,000 | $70,000 | $70,000 |
| Accumulated Depreciation | $0 | $0 | $0 |
| Total Long-term Assets | $70,000 | $70,000 | $70,000 |
| Total Assets | $191,875 | $213,755 | $256,077 |
| Liabilities and Capital | Year 1 | Year 2 | Year 3 |
| Current Liabilities | |||
| Accounts Payable | $30,101 | $41,138 | $46,345 |
| Current Borrowing | $15,500 | $11,000 | $6,500 |
| Other Current Liabilities | $0 | $0 | $0 |
| Subtotal Current Liabilities | $45,601 | $52,138 | $52,845 |
| Long-term Liabilities | $126,000 | $102,000 | $78,000 |
| Total Liabilities | $171,601 | $154,138 | $130,845 |
| Paid-in Capital | $70,000 | $70,000 | $70,000 |
| Retained Earnings | ($58,000) | ($49,726) | ($10,383) |
| Earnings | $8,274 | $39,343 | $65,616 |
| Total Capital | $20,274 | $59,617 | $125,233 |
| Total Liabilities and Capital | $191,875 | $213,755 | $256,077 |
| Net Worth | $20,274 | $59,617 | $125,233 |
7.6 Business Ratios
The following table contains important business ratios for the retail athletic shoe store industry, as determined by the Standard Industry Classification (SIC) Index code 5661.
| Ratio Analysis | ||||
| Year 1 | Year 2 | Year 3 | Industry Profile | |
| Sales Growth | 0.00% | 33.33% | 16.67% | 0.20% |
| Percent of Total Assets | ||||
| Inventory | 11.49% | 13.76% | 13.40% | 46.40% |
| Other Current Assets | 0.52% | 0.47% | 0.39% | 25.30% |
| Total Current Assets | 63.52% | 67.25% | 72.66% | 80.30% |
| Long-term Assets | 36.48% | 32.75% | 27.34% | 19.70% |
| Total Assets | 100.00% | 100.00% | 100.00% | 100.00% |
| Current Liabilities | 23.77% | 24.39% | 20.64% | 38.40% |
| Long-term Liabilities | 65.67% | 47.72% | 30.46% | 14.50% |
| Total Liabilities | 89.43% | 72.11% | 51.10% | 52.90% |
| Net Worth | 10.57% | 27.89% | 48.90% | 47.10% |
| Percent of Sales | ||||
| Sales | 100.00% | 100.00% | 100.00% | 100.00% |
| Gross Margin | 43.00% | 43.00% | 43.00% | 45.70% |
| Selling, General & Administrative Expenses | 41.14% | 36.44% | 33.58% | 28.60% |
| Advertising Expenses | 0.55% | 0.55% | 0.55% | 2.60% |
| Profit Before Interest and Taxes | 6.28% | 10.84% | 12.43% | 0.70% |
| Main Ratios | ||||
| Current | 2.67 | 2.76 | 3.52 | 2.28 |
| Quick | 2.19 | 2.19 | 2.87 | 0.63 |
| Total Debt to Total Assets | 89.43% | 72.11% | 51.10% | 52.90% |
| Pre-tax Return on Net Worth | 63.91% | 87.99% | 61.64% | 1.50% |
| Pre-tax Return on Assets | 6.75% | 24.54% | 30.15% | 3.20% |
| Additional Ratios | Year 1 | Year 2 | Year 3 | |
| Net Profit Margin | 1.84% | 6.56% | 9.37% | n.a |
| Return on Equity | 40.81% | 65.99% | 52.40% | n.a |
| Activity Ratios | ||||
| Inventory Turnover | 9.37 | 12.83 | 12.09 | n.a |
| Accounts Payable Turnover | 10.62 | 12.17 | 12.17 | n.a |
| Payment Days | 27 | 26 | 28 | n.a |
| Total Asset Turnover | 2.35 | 2.81 | 2.73 | n.a |
| Debt Ratios | ||||
| Debt to Net Worth | 8.46 | 2.59 | 1.04 | n.a |
| Current Liab. to Liab. | 0.27 | 0.34 | 0.40 | n.a |
| Liquidity Ratios | ||||
| Net Working Capital | $76,274 | $91,617 | $133,233 | n.a |
| Interest Coverage | 1.85 | 5.17 | 8.89 | n.a |
| Additional Ratios | ||||
| Assets to Sales | 0.43 | 0.36 | 0.37 | n.a |
| Current Debt/Total Assets | 24% | 24% | 21% | n.a |
| Acid Test | 2.19 | 2.19 | 2.87 | n.a |
| Sales/Net Worth | 22.20 | 10.06 | 5.59 | n.a |
| Dividend Payout | 0.00 | 0.00 | 0.00 | n.a |
Appendix
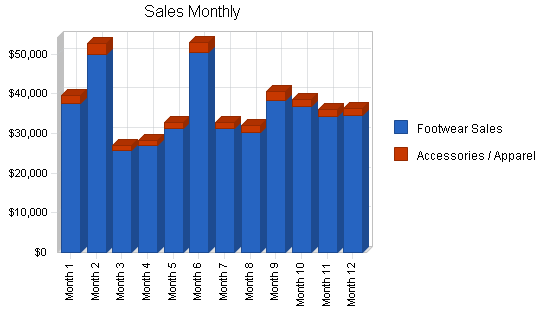
| Sales Forecast | |||||||||||||
| Month 1 | Month 2 | Month 3 | Month 4 | Month 5 | Month 6 | Month 7 | Month 8 | Month 9 | Month 10 | Month 11 | Month 12 | ||
| Sales | |||||||||||||
| Footwear Sales | 0% | $37,620 | $50,018 | $25,650 | $26,933 | $31,208 | $50,445 | $31,208 | $30,353 | $38,475 | $36,765 | $34,200 | $34,628 |
| Accessories / Apparel | 0% | $1,980 | $2,633 | $1,350 | $1,418 | $1,643 | $2,655 | $1,643 | $1,598 | $2,025 | $1,935 | $1,800 | $1,823 |
| Total Sales | $39,600 | $52,650 | $27,000 | $28,350 | $32,850 | $53,100 | $32,850 | $31,950 | $40,500 | $38,700 | $36,000 | $36,450 | |
| Direct Cost of Sales | Month 1 | Month 2 | Month 3 | Month 4 | Month 5 | Month 6 | Month 7 | Month 8 | Month 9 | Month 10 | Month 11 | Month 12 | |
| Footwear Sales | $20,691 | $27,510 | $14,108 | $14,813 | $17,164 | $27,745 | $17,164 | $16,694 | $21,161 | $20,221 | $18,810 | $19,045 | |
| Accessories / Apparel | $1,089 | $1,448 | $743 | $780 | $903 | $1,460 | $903 | $879 | $1,114 | $1,064 | $990 | $1,002 | |
| Subtotal Direct Cost of Sales | $21,780 | $28,958 | $14,850 | $15,593 | $18,068 | $29,205 | $18,068 | $17,573 | $22,275 | $21,285 | $19,800 | $20,048 | |
| Personnel Plan | |||||||||||||
| Month 1 | Month 2 | Month 3 | Month 4 | Month 5 | Month 6 | Month 7 | Month 8 | Month 9 | Month 10 | Month 11 | Month 12 | ||
| Jane Lefkowitz, Owner / Mgr. / $18.K / Yr. | 0% | $1,500 | $1,500 | $1,500 | $1,500 | $1,500 | $1,500 | $1,500 | $1,500 | $1,500 | $1,500 | $1,500 | $1,500 |
| Assistant Store Manager / $18K / Yr. | 0% | $1,500 | $1,500 | $1,500 | $1,500 | $1,500 | $1,500 | $1,500 | $1,500 | $1,500 | $1,500 | $1,500 | $1,500 |
| Key Assoc. / $8.00 hr. – 40 hrs. | 0% | $1,024 | $1,280 | $1,280 | $1,280 | $1,280 | $1,280 | $1,280 | $1,280 | $1,280 | $1,280 | $1,280 | $1,280 |
| Part Time Assoc. “A” – $6.00 / Hr.- 12 hrs | 0% | $288 | $288 | $288 | $288 | $288 | $288 | $288 | $288 | $288 | $288 | $288 | $288 |
| Part Time Assoc. “B” – $6.00 / Hr. – 8 hrs. | 0% | $192 | $192 | $192 | $192 | $192 | $192 | $192 | $192 | $192 | $192 | $192 | $192 |
| Part Time Assoc. “C” – $6.00 / Hr. – 8 hrs. | 0% | $192 | $192 | $192 | $192 | $192 | $192 | $192 | $192 | $192 | $192 | $192 | $192 |
| Total People | 6 | 6 | 6 | 6 | 6 | 6 | 6 | 6 | 6 | 6 | 6 | 6 | |
| Total Payroll | $4,696 | $4,952 | $4,952 | $4,952 | $4,952 | $4,952 | $4,952 | $4,952 | $4,952 | $4,952 | $4,952 | $4,952 | |
| General Assumptions | |||||||||||||
| Month 1 | Month 2 | Month 3 | Month 4 | Month 5 | Month 6 | Month 7 | Month 8 | Month 9 | Month 10 | Month 11 | Month 12 | ||
| Plan Month | 1 | 2 | 3 | 4 | 5 | 6 | 7 | 8 | 9 | 10 | 11 | 12 | |
| Current Interest Rate | 9.00% | 9.00% | 9.00% | 9.00% | 9.00% | 9.00% | 9.00% | 9.00% | 9.00% | 9.00% | 9.00% | 9.00% | |
| Long-term Interest Rate | 10.00% | 10.00% | 10.00% | 10.00% | 10.00% | 10.00% | 10.00% | 10.00% | 10.00% | 10.00% | 10.00% | 10.00% | |
| Tax Rate | 30.00% | 25.00% | 0.00% | 0.00% | 0.00% | 25.00% | 0.00% | 0.00% | 25.00% | 25.00% | 25.00% | 25.00% | |
| Other | 0 | 0 | 0 | 0 | 0 | 0 | 0 | 0 | 0 | 0 | 0 | 0 | |
| Pro Forma Profit and Loss | |||||||||||||
| Month 1 | Month 2 | Month 3 | Month 4 | Month 5 | Month 6 | Month 7 | Month 8 | Month 9 | Month 10 | Month 11 | Month 12 | ||
| Sales | $39,600 | $52,650 | $27,000 | $28,350 | $32,850 | $53,100 | $32,850 | $31,950 | $40,500 | $38,700 | $36,000 | $36,450 | |
| Direct Cost of Sales | $21,780 | $28,958 | $14,850 | $15,593 | $18,068 | $29,205 | $18,068 | $17,573 | $22,275 | $21,285 | $19,800 | $20,048 | |
| Other | $792 | $1,053 | $540 | $567 | $657 | $1,062 | $657 | $639 | $810 | $774 | $720 | $729 | |
| Total Cost of Sales | $22,572 | $30,011 | $15,390 | $16,160 | $18,725 | $30,267 | $18,725 | $18,212 | $23,085 | $22,059 | $20,520 | $20,777 | |
| Gross Margin | $17,028 | $22,640 | $11,610 | $12,190 | $14,126 | $22,833 | $14,126 | $13,739 | $17,415 | $16,641 | $15,480 | $15,674 | |
| Gross Margin % | 43.00% | 43.00% | 43.00% | 43.00% | 43.00% | 43.00% | 43.00% | 43.00% | 43.00% | 43.00% | 43.00% | 43.00% | |
| Expenses | |||||||||||||
| Payroll | $4,696 | $4,952 | $4,952 | $4,952 | $4,952 | $4,952 | $4,952 | $4,952 | $4,952 | $4,952 | $4,952 | $4,952 | |
| Sales and Marketing and Other Expenses | $3,845 | $4,636 | $3,084 | $3,166 | $3,438 | $4,663 | $3,438 | $3,383 | $3,900 | $3,791 | $3,628 | $3,656 | |
| Depreciation | $0 | $0 | $0 | $0 | $0 | $0 | $0 | $0 | $0 | $0 | $0 | $0 | |
| Royalties (5%) | $1,980 | $2,633 | $1,350 | $1,418 | $1,643 | $2,655 | $1,643 | $1,598 | $2,025 | $1,935 | $1,800 | $1,823 | |
| Insurance | $515 | $684 | $351 | $369 | $427 | $690 | $427 | $415 | $527 | $503 | $468 | $474 | |
| Rent | $2,267 | $2,267 | $2,267 | $2,267 | $2,267 | $2,267 | $2,267 | $2,267 | $2,267 | $2,267 | $2,267 | $2,267 | |
| Payroll Taxes | 10% | $470 | $495 | $495 | $495 | $495 | $495 | $495 | $495 | $495 | $495 | $495 | $495 |
| Other | $0 | $0 | $0 | $0 | $0 | $0 | $0 | $0 | $0 | $0 | $0 | $0 | |
| Total Operating Expenses | $13,772 | $15,667 | $12,498 | $12,666 | $13,221 | $15,722 | $13,221 | $13,110 | $14,166 | $13,943 | $13,610 | $13,666 | |
| Profit Before Interest and Taxes | $3,256 | $6,973 | ($888) | ($475) | $904 | $7,111 | $904 | $628 | $3,249 | $2,698 | $1,870 | $2,008 | |
| EBITDA | $3,256 | $6,973 | ($888) | ($475) | $904 | $7,111 | $904 | $628 | $3,249 | $2,698 | $1,870 | $2,008 | |
| Interest Expense | $1,381 | $1,361 | $1,342 | $1,322 | $1,303 | $1,283 | $1,264 | $1,244 | $1,225 | $1,205 | $1,186 | $1,166 | |
| Taxes Incurred | $563 | $1,403 | $0 | $0 | $0 | $1,457 | $0 | $0 | $506 | $373 | $171 | $210 | |
| Net Profit | $1,313 | $4,209 | ($2,230) | ($1,797) | ($398) | $4,371 | ($359) | ($616) | $1,519 | $1,119 | $513 | $631 | |
| Net Profit/Sales | 3.31% | 7.99% | -8.26% | -6.34% | -1.21% | 8.23% | -1.09% | -1.93% | 3.75% | 2.89% | 1.43% | 1.73% | |
| Pro Forma Cash Flow | |||||||||||||
| Month 1 | Month 2 | Month 3 | Month 4 | Month 5 | Month 6 | Month 7 | Month 8 | Month 9 | Month 10 | Month 11 | Month 12 | ||
| Cash Received | |||||||||||||
| Cash from Operations | |||||||||||||
| Cash Sales | $39,600 | $52,650 | $27,000 | $28,350 | $32,850 | $53,100 | $32,850 | $31,950 | $40,500 | $38,700 | $36,000 | $36,450 | |
| Subtotal Cash from Operations | $39,600 | $52,650 | $27,000 | $28,350 | $32,850 | $53,100 | $32,850 | $31,950 | $40,500 | $38,700 | $36,000 | $36,450 | |
| Additional Cash Received | |||||||||||||
| Sales Tax, VAT, HST/GST Received | 0.00% | $0 | $0 | $0 | $0 | $0 | $0 | $0 | $0 | $0 | $0 | $0 | $0 |
| New Current Borrowing | $0 | $0 | $0 | $0 | $0 | $0 | $0 | $0 | $0 | $0 | $0 | $0 | |
| New Other Liabilities (interest-free) | $0 | $0 | $0 | $0 | $0 | $0 | $0 | $0 | $0 | $0 | $0 | $0 | |
| New Long-term Liabilities | $0 | $0 | $0 | $0 | $0 | $0 | $0 | $0 | $0 | $0 | $0 | $0 | |
| Sales of Other Current Assets | $0 | $0 | $0 | $0 | $0 | $0 | $0 | $0 | $0 | $0 | $0 | $0 | |
| Sales of Long-term Assets | $0 | $0 | $0 | $0 | $0 | $0 | $0 | $0 | $0 | $0 | $0 | $0 | |
| New Investment Received | $0 | $0 | $0 | $0 | $0 | $0 | $0 | $0 | $0 | $0 | $0 | $0 | |
| Subtotal Cash Received | $39,600 | $52,650 | $27,000 | $28,350 | $32,850 | $53,100 | $32,850 | $31,950 | $40,500 | $38,700 | $36,000 | $36,450 | |
| Expenditures | Month 1 | Month 2 | Month 3 | Month 4 | Month 5 | Month 6 | Month 7 | Month 8 | Month 9 | Month 10 | Month 11 | Month 12 | |
| Expenditures from Operations | |||||||||||||
| Cash Spending | $4,696 | $4,952 | $4,952 | $4,952 | $4,952 | $4,952 | $4,952 | $4,952 | $4,952 | $4,952 | $4,952 | $4,952 | |
| Bill Payments | $2,394 | $11,902 | $14,362 | $9,878 | $23,204 | $31,853 | $54,694 | $16,375 | $27,474 | $38,947 | $31,452 | $28,976 | |
| Subtotal Spent on Operations | $7,090 | $16,854 | $19,314 | $14,830 | $28,156 | $36,805 | $59,646 | $21,327 | $32,426 | $43,899 | $36,404 | $33,928 | |
| Additional Cash Spent | |||||||||||||
| Sales Tax, VAT, HST/GST Paid Out | $0 | $0 | $0 | $0 | $0 | $0 | $0 | $0 | $0 | $0 | $0 | $0 | |
| Principal Repayment of Current Borrowing | $375 | $375 | $375 | $375 | $375 | $375 | $375 | $375 | $375 | $375 | $375 | $375 | |
| Other Liabilities Principal Repayment | $0 | $0 | $0 | $0 | $0 | $0 | $0 | $0 | $0 | $0 | $0 | $0 | |
| Long-term Liabilities Principal Repayment | $2,000 | $2,000 | $2,000 | $2,000 | $2,000 | $2,000 | $2,000 | $2,000 | $2,000 | $2,000 | $2,000 | $2,000 | |
| Purchase Other Current Assets | $0 | $0 | $0 | $0 | $0 | $0 | $0 | $0 | $0 | $0 | $0 | $0 | |
| Purchase Long-term Assets | $0 | $0 | $0 | $0 | $0 | $0 | $0 | $0 | $0 | $0 | $0 | $0 | |
| Dividends | $0 | $0 | $0 | $0 | $0 | $0 | $0 | $0 | $0 | $0 | $0 | $0 | |
| Subtotal Cash Spent | $9,465 | $19,229 | $21,689 | $17,205 | $30,531 | $39,180 | $62,021 | $23,702 | $34,801 | $46,274 | $38,779 | $36,303 | |
| Net Cash Flow | $30,135 | $33,421 | $5,311 | $11,145 | $2,319 | $13,920 | ($29,171) | $8,248 | $5,699 | ($7,574) | ($2,779) | $147 | |
| Cash Balance | $58,135 | $91,556 | $96,868 | $108,013 | $110,332 | $124,252 | $95,081 | $103,329 | $109,028 | $101,454 | $98,676 | $98,823 | |
| Pro Forma Balance Sheet | |||||||||||||
| Month 1 | Month 2 | Month 3 | Month 4 | Month 5 | Month 6 | Month 7 | Month 8 | Month 9 | Month 10 | Month 11 | Month 12 | ||
| Assets | Starting Balances | ||||||||||||
| Current Assets | |||||||||||||
| Cash | $28,000 | $58,135 | $91,556 | $96,868 | $108,013 | $110,332 | $124,252 | $95,081 | $103,329 | $109,028 | $101,454 | $98,676 | $98,823 |
| Inventory | $85,000 | $63,220 | $34,263 | $19,413 | $17,152 | $19,874 | $32,126 | $19,874 | $19,330 | $24,503 | $23,414 | $21,780 | $22,052 |
| Other Current Assets | $1,000 | $1,000 | $1,000 | $1,000 | $1,000 | $1,000 | $1,000 | $1,000 | $1,000 | $1,000 | $1,000 | $1,000 | $1,000 |
| Total Current Assets | $114,000 | $122,355 | $126,819 | $117,280 | $126,164 | $131,206 | $157,378 | $115,955 | $123,659 | $134,531 | $125,868 | $121,456 | $121,875 |
| Long-term Assets | |||||||||||||
| Long-term Assets | $70,000 | $70,000 | $70,000 | $70,000 | $70,000 | $70,000 | $70,000 | $70,000 | $70,000 | $70,000 | $70,000 | $70,000 | $70,000 |
| Accumulated Depreciation | $0 | $0 | $0 | $0 | $0 | $0 | $0 | $0 | $0 | $0 | $0 | $0 | $0 |
| Total Long-term Assets | $70,000 | $70,000 | $70,000 | $70,000 | $70,000 | $70,000 | $70,000 | $70,000 | $70,000 | $70,000 | $70,000 | $70,000 | $70,000 |
| Total Assets | $184,000 | $192,355 | $196,819 | $187,280 | $196,164 | $201,206 | $227,378 | $185,955 | $193,659 | $204,531 | $195,868 | $191,456 | $191,875 |
| Liabilities and Capital | Month 1 | Month 2 | Month 3 | Month 4 | Month 5 | Month 6 | Month 7 | Month 8 | Month 9 | Month 10 | Month 11 | Month 12 | |
| Current Liabilities | |||||||||||||
| Accounts Payable | $2,000 | $11,418 | $14,047 | $9,114 | $22,170 | $29,985 | $54,161 | $15,473 | $26,167 | $37,895 | $30,488 | $27,938 | $30,101 |
| Current Borrowing | $20,000 | $19,625 | $19,250 | $18,875 | $18,500 | $18,125 | $17,750 | $17,375 | $17,000 | $16,625 | $16,250 | $15,875 | $15,500 |
| Other Current Liabilities | $0 | $0 | $0 | $0 | $0 | $0 | $0 | $0 | $0 | $0 | $0 | $0 | $0 |
| Subtotal Current Liabilities | $22,000 | $31,043 | $33,297 | $27,989 | $40,670 | $48,110 | $71,911 | $32,848 | $43,167 | $54,520 | $46,738 | $43,813 | $45,601 |
| Long-term Liabilities | $150,000 | $148,000 | $146,000 | $144,000 | $142,000 | $140,000 | $138,000 | $136,000 | $134,000 | $132,000 | $130,000 | $128,000 | $126,000 |
| Total Liabilities | $172,000 | $179,043 | $179,297 | $171,989 | $182,670 | $188,110 | $209,911 | $168,848 | $177,167 | $186,520 | $176,738 | $171,813 | $171,601 |
| Paid-in Capital | $70,000 | $70,000 | $70,000 | $70,000 | $70,000 | $70,000 | $70,000 | $70,000 | $70,000 | $70,000 | $70,000 | $70,000 | $70,000 |
| Retained Earnings | ($58,000) | ($58,000) | ($58,000) | ($58,000) | ($58,000) | ($58,000) | ($58,000) | ($58,000) | ($58,000) | ($58,000) | ($58,000) | ($58,000) | ($58,000) |
| Earnings | $0 | $1,313 | $5,522 | $3,292 | $1,494 | $1,096 | $5,467 | $5,108 | $4,492 | $6,010 | $7,130 | $7,643 | $8,274 |
| Total Capital | $12,000 | $13,313 | $17,522 | $15,292 | $13,494 | $13,096 | $17,467 | $17,108 | $16,492 | $18,010 | $19,130 | $19,643 | $20,274 |
| Total Liabilities and Capital | $184,000 | $192,355 | $196,819 | $187,280 | $196,164 | $201,206 | $227,378 | $185,955 | $193,659 | $204,531 | $195,868 | $191,456 | $191,875 |
| Net Worth | $12,000 | $13,313 | $17,522 | $15,292 | $13,494 | $13,096 | $17,467 | $17,108 | $16,492 | $18,010 | $19,130 | $19,643 | $20,274 |


