
Martini Astrology and Tarot
Executive Summary
Martini Astrology and Tarot is a Eugene, OR based business that specializes in astrology and tarot reading. Martini will initially be a home-based service provider operating out of the owner’s home. The founder and owner, Sarah Esppe will also offer out-call services by appointment. Sarah has forecasted the need to open a dedicated office somewhere between Years One and Three.
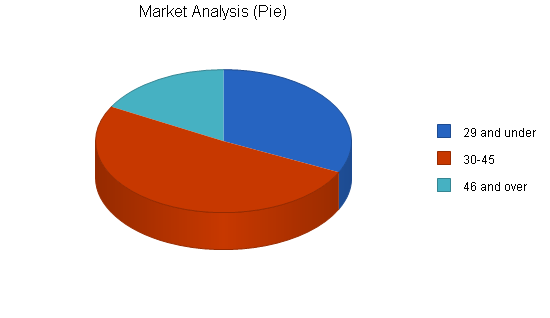
Martini will be based in Eugene, OR, a liberal, alternative community within the Willamette river valley. Martini will target three distinct customer segments. The first segment is composed of the under 29 year olds. This segment is growing at 15% a year and has 95,000 potential customers. The second group is aged 30-45 years with a 10% growth rate and 150,000 potential people. The last group that will be targeted is the over 46 year olds. This group is has the slowest annual growth rate of 5% with 50,000 people.
Martini’s readings will be used for consulting and entertainment purposes. Sarah’s goal will be to develop long-term relationships with the majority of her clients, utilizing her services on a weekly or bi-weekly interval. Sarah will obtain this goal by providing her clients with relevant, accurate, and quality readings at reasonable rates.
As mentioned previously, Sarah Esppe is the sole proprietor of Martini. Sarah has been providing readings for four years. Sarah’s formal training began at the Iowa Center for Astrology, recognized as one of the top three facilities in the United States. Sarah completed their 8-month program and was awarded their respected certification. Following her time at the Iowa Center, Sarah studied for four months at Tarot University in New Orleans, receiving the highest level of certification available, the Master Tarot Reader degree. Sarah will leverage this formal training to provide the finest astrology and tarot consultations.
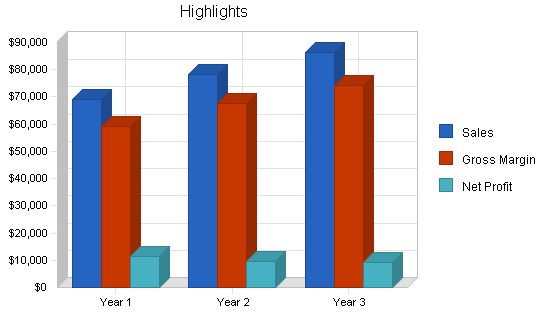
Martini is an exciting start-up business. Sales have been conservatively forecasted to reach $68,000 in sales in Year One, rising to $86,000 by Year Three. Sarah will reach profitability in Year One.
1.1 Objectives
The objectives for the business are:
- Reaching break-even and positive cash flow.
- Make enough of a profit to maintain a location outside my home and purchase a stand at the Saturday Market and area festivals and fairs.
- Earn a reputation as an accurate and entertaining tarot and astrological reader.
1.2 Mission
Martini Astrology and Tarot will offer high-quality, personal astrology and tarot readings for entertainment purposes. I will offer a high level of personalized, accurate readings tailored to my clients’ needs. I will be available for in-call and out-call readings at varying prices to make astrological and tarot readings more accessible and reasonable for my clients. To gain customers’ respect and trust, Martini must be known for a high level of accuracy and quality.
1.3 Keys to Success
- Satisfying clients with accurate and complete quality readings for a reasonable price.
- Developing enough word-of-mouth and advertising revenue to maintain a client base.
- Purchasing a booth at the Saturday Market, where I will be able to give tarot and astrology readings each weekend.
Company Summary
Martini Astrology and Tarot is a new company that provides high-level readings to its clients in the Eugene area. It will focus initially on giving two types of services: astrology and tarot readings. As the company grows, it will expand by purchasing a booth at the Saturday Market and other local area fairs and festivals.
2.1 Company Ownership
Martini Astrology and Tarot will be created as a sole proprietorship company based in Eugene, Oregon.
2.2 Start-up Summary
Assets include my computer, software, and books. Since most of the items I already have, the start-up costs are less than seen here. Start-up funding will be provided by the owner of the company, myself.

| Start-up | |
| Requirements | |
| Start-up Expenses | |
| Legal | $300 |
| Stationery etc. | $120 |
| Brochures | $150 |
| Research and development | $50 |
| Astrology Program and Tarot Cards | $50 |
| Total Start-up Expenses | $670 |
| Start-up Assets | |
| Cash Required | $200 |
| Other Current Assets | $1,000 |
| Long-term Assets | $0 |
| Total Assets | $1,200 |
| Total Requirements | $1,870 |
| Start-up Funding | |
| Start-up Expenses to Fund | $670 |
| Start-up Assets to Fund | $1,200 |
| Total Funding Required | $1,870 |
| Assets | |
| Non-cash Assets from Start-up | $1,000 |
| Cash Requirements from Start-up | $200 |
| Additional Cash Raised | $0 |
| Cash Balance on Starting Date | $200 |
| Total Assets | $1,200 |
| Liabilities and Capital | |
| Liabilities | |
| Current Borrowing | $0 |
| Long-term Liabilities | $0 |
| Accounts Payable (Outstanding Bills) | $0 |
| Other Current Liabilities (interest-free) | $0 |
| Total Liabilities | $0 |
| Capital | |
| Planned Investment | |
| Investor 1 | $1,870 |
| Investor 2 | $0 |
| Other | $0 |
| Additional Investment Requirement | $0 |
| Total Planned Investment | $1,870 |
| Loss at Start-up (Start-up Expenses) | ($670) |
| Total Capital | $1,200 |
| Total Capital and Liabilities | $1,200 |
| Total Funding | $1,870 |
2.3 Company Locations and Facilities
Initially, Martini Astrology and Tarot will be run from my home, with out-call services as my main business. However, this business plan calls for establishing a location outside the home. I am currently negotiating for booth space at the 5th Street Market complex, which has good traffic, easy parking, and people with the right aura.
Services
Martini Astrology and Tarot offers the expertise of a quality astrology and tarot reader to its clients.
3.1 Service Description
As of June 2001, Martini has two basic services available for clients:
- Astrology Readings
- Tarot Readings
3.2 Sales Literature
The business will begin with simple business cards listing my services. Eventually, with a larger client base, brochures will be made that include prices and what type of tarot and astrology readings are available.
3.3 Fulfillment
Key fulfillment will be delivered by the sole proprietor of Martini Astrology and Tarot. The real core value is professional expertise, provided by a combination of experience, empathy, and education.
Market Analysis Summary
Martini will focus on customers between the ages of 15 and 60 wanting to have their astrological charts interpreted, or who are interested in tarot readings. My largest growth market will be those under the age of 29, but the market I will get the most repeat customers from will be between the ages of 30 to 45.
4.1 Market Segmentation
The market analysis numbers are based on the general population of Eugene, and were taken by the Census Board.
| Market Analysis | |||||||
| Year 1 | Year 2 | Year 3 | Year 4 | Year 5 | |||
| Potential Customers | Growth | CAGR | |||||
| 29 and under | 15% | 95,000 | 109,250 | 125,638 | 144,484 | 166,157 | 15.00% |
| 30-45 | 10% | 150,000 | 165,000 | 181,500 | 199,650 | 219,615 | 10.00% |
| 46 and over | 5% | 50,000 | 52,500 | 55,125 | 57,881 | 60,775 | 5.00% |
| Total | 10.92% | 295,000 | 326,750 | 362,263 | 402,015 | 446,547 | 10.92% |
4.2 Market Needs
My target clients are those who are interested in having a glimpse into their future. They will use my readings for consulting and entertainment purposes. Ideally, they will come to me for a long-term alliance, looking for reliable readings and empathic support.
4.3 Target Market Segment Strategy
Sales forecast for October and December are higher due to holidays such as Halloween/Samhain and Christmas/Winter Solstice. Also, because much of business will be done in coffee shops, fairs, and parties, concrete sales forecast of units is difficult, but should remain fairly steady.
4.4 Service Business Analysis
The astrology and tarot business consists of thousands of smaller companies and individuals. Most are online at this time, so face-to-face service is harder to find, and not easily accessible. Most clients stumble on to these businesses by mistake or luck, and purchase depending on their needs at that time.
4.4.1 Main Competitors
My main competition will be others in the Eugene/Springfield area providing the same type of services, and services available over the Internet.
4.4.2 Competition and Buying Patterns
The key element in purchase decisions made at the client level is trust in the reputation and reliability of Martini Astrology and Tarot.
Pricing is surprisingly variable. In consulting at this level, it is easier to be priced too low than too high. Clients and potential clients expect to pay substantial fees for the best quality professional advice.

4.4.3 Business Participants
The astrology and tarot reading industry is made up of many small participants, with a few world-renowned readers.
4.4.4 Distributing a Service
Consulting is sold and purchased mainly on a word-of-mouth basis, with relationships and previous experience being by far the most important factor.
Strategy and Implementation Summary
Martini Astrology and Tarot will focus primarily on Eugene and surrounding cities. The target customer is usually someone who would like a tarot or astrology reading, and would like to continue consulting my services in the future.
5.1 Marketing Strategy
My target market will be mainly people under the age of 40 who would like to get a tarot or astrology reading for entertainment purposes. In the beginning, I will target people in the downtown area who would like to have a quick tarot reading for $10 to $20. Once they have gotten one reading from me, I will inform them of my astrology services.
5.1.1 Positioning Statement
For clients who would like an astrology or tarot reading, Martini offers specialized, well-proven expertise. Unlike online companies, readings will be face-to-face and reasonably priced.
5.1.2 Pricing Strategy
My prices will be competitive, ranging anywhere from $10, for a quick 10 minute reading, to $25 and higher for an astrology chart print out and summary.
5.1.3 Promotion Strategy
Martini must generate and manage speaking opportunities at fairs, festivals, parties, and other arenas. The company will depend on retail traffic at it’s location, and word of mouth until a client base is formed, then will begin advertising with fliers, brochures, and classified advertisements in smaller periodicals.
5.2 Sales Strategy
Sales in our business is client service. It is a repeat business. One doesn’t sell an astrology and tarot company, one develops a reputation that gains the trust and respect of clients.
5.2.1 Sales Forecast
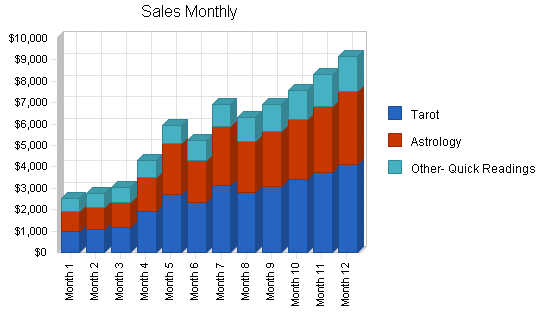
The Sales Forecast table and chart give a run-down on forecasted sales. I expect holidays such as Halloween, Christmas, and New Year’s Eve to be my biggest sales events, which will include being hired for parties and festivals. The first year sales forecast includes the general ramp-up expected as the business gets going.

| Sales Forecast | |||
| Year 1 | Year 2 | Year 3 | |
| Unit Sales | |||
| Tarot | 2,134 | 2,347 | 2,582 |
| Astrology | 1,077 | 1,185 | 1,303 |
| Other- Quick Readings | 1,235 | 1,359 | 1,494 |
| Total Unit Sales | 4,446 | 4,891 | 5,380 |
| Unit Prices | Year 1 | Year 2 | Year 3 |
| Tarot | $14.25 | $15.00 | $15.00 |
| Astrology | $24.26 | $25.00 | $25.00 |
| Other- Quick Readings | $10.00 | $10.00 | $10.00 |
| Sales | |||
| Tarot | $30,420 | $35,211 | $38,732 |
| Astrology | $26,130 | $29,618 | $32,579 |
| Other- Quick Readings | $12,350 | $13,585 | $14,944 |
| Total Sales | $68,900 | $78,414 | $86,255 |
| Direct Unit Costs | Year 1 | Year 2 | Year 3 |
| Tarot | $2.00 | $2.00 | $2.00 |
| Astrology | $4.00 | $4.00 | $4.00 |
| Other- Quick Readings | $0.95 | $1.00 | $1.00 |
| Direct Cost of Sales | |||
| Tarot | $4,268 | $4,695 | $5,164 |
| Astrology | $4,308 | $4,739 | $5,213 |
| Other- Quick Readings | $1,174 | $1,359 | $1,494 |
| Subtotal Direct Cost of Sales | $9,750 | $10,792 | $11,871 |
Management Summary
As a sole proprietor, management of a team will not be an issue. I expect to do this myself. The additional personnel cost of $500 per month is for administrative and support help, part time, and only when the business gets going.
6.1 Personnel Plan
Payroll is calculated for myself, and amounts are based expected profits for each month. There is also a second person for support, administrative help, etc. Profits after payroll will be put back into the business for advertising, travel, and other miscellaneous expenses.
| Personnel Plan | |||
| Year 1 | Year 2 | Year 3 | |
| Principal | $34,000 | $40,000 | $45,000 |
| Other | $1,500 | $5,000 | $6,500 |
| Total People | 2 | 2 | 2 |
| Total Payroll | $35,500 | $45,000 | $51,500 |
Financial Plan
Martini Astrology and Tarot’s financial growth will be through cash flow. I recognize that this means we will have to grow more slowly, but it ensures stability.
7.1 Important Assumptions
The financial plan depends on important assumptions, most of which are shown in the following table. From the beginning, we realize that word of mouth and repeat customers will be critical, and can only be influenced through quality readings and customer satisfaction.
| General Assumptions | |||
| Year 1 | Year 2 | Year 3 | |
| Plan Month | 1 | 2 | 3 |
| Current Interest Rate | 10.00% | 10.00% | 10.00% |
| Long-term Interest Rate | 10.00% | 10.00% | 10.00% |
| Tax Rate | 25.00% | 25.00% | 25.00% |
| Other | 0 | 0 | 0 |
7.2 Key Financial Indicators
The following Benchmarks chart indicates the key financial indicators for the first three years. I foresee major growth in sales, especially during holiday seasons.

7.3 Break-even Analysis
The following table and chart summarize the Break-even Analysis. With relatively low monthly fixed costs, it will not be difficult to achieve the break-even point the first month. It’s important to note that most of the fixed cost is my own compensation.

| Break-even Analysis | |
| Monthly Units Break-even | 276 |
| Monthly Revenue Break-even | $4,281 |
| Assumptions: | |
| Average Per-Unit Revenue | $15.50 |
| Average Per-Unit Variable Cost | $2.19 |
| Estimated Monthly Fixed Cost | $3,675 |
7.4 Projected Profit and Loss
Advertising expenses are accounted for depending on the month and what holidays will be coming up. Travel expenses stay the same since most traveling will be done in the general area of Eugene and not much is expected. Other expenses include books, seminars, costumes, etc. Utilities, rent, and consultants are not taken into account because most work will not be done at home. Costs to look into at a later date might include the cost of a stand at the Saturday Market, licensing, working from a small office, etc.


| Pro Forma Profit and Loss | |||
| Year 1 | Year 2 | Year 3 | |
| Sales | $68,900 | $78,414 | $86,255 |
| Direct Cost of Sales | $9,750 | $10,792 | $11,871 |
| Other | $60 | $65 | $70 |
| Total Cost of Sales | $9,810 | $10,857 | $11,941 |
| Gross Margin | $59,090 | $67,556 | $74,314 |
| Gross Margin % | 85.76% | 86.15% | 86.16% |
| Expenses | |||
| Payroll | $35,500 | $45,000 | $51,500 |
| Sales and Marketing and Other Expenses | $3,200 | $3,875 | $4,550 |
| Depreciation | $0 | $0 | $0 |
| Rent | $5,400 | $5,800 | $6,200 |
| Payroll Taxes | $0 | $0 | $0 |
| Other | $0 | $0 | $0 |
| Total Operating Expenses | $44,100 | $54,675 | $62,250 |
| Profit Before Interest and Taxes | $14,990 | $12,881 | $12,064 |
| EBITDA | $14,990 | $12,881 | $12,064 |
| Interest Expense | $0 | $0 | $0 |
| Taxes Incurred | $3,748 | $3,220 | $3,016 |
| Net Profit | $11,243 | $9,661 | $9,048 |
| Net Profit/Sales | 16.32% | 12.32% | 10.49% |
7.5 Projected Cash Flow
The annual cash flow figures are included below and the more important detailed monthly numbers are included in the appendix. Cash flow will depend on the amount of time I spend in the field providing my service to customers, so projections may vary.

| Pro Forma Cash Flow | |||
| Year 1 | Year 2 | Year 3 | |
| Cash Received | |||
| Cash from Operations | |||
| Cash Sales | $68,900 | $78,414 | $86,255 |
| Subtotal Cash from Operations | $68,900 | $78,414 | $86,255 |
| Additional Cash Received | |||
| Sales Tax, VAT, HST/GST Received | $0 | $0 | $0 |
| New Current Borrowing | $0 | $0 | $0 |
| New Other Liabilities (interest-free) | $0 | $0 | $0 |
| New Long-term Liabilities | $0 | $0 | $0 |
| Sales of Other Current Assets | $0 | $0 | $0 |
| Sales of Long-term Assets | $0 | $0 | $0 |
| New Investment Received | $0 | $0 | $0 |
| Subtotal Cash Received | $68,900 | $78,414 | $86,255 |
| Expenditures | Year 1 | Year 2 | Year 3 |
| Expenditures from Operations | |||
| Cash Spending | $35,500 | $45,000 | $51,500 |
| Bill Payments | $19,845 | $24,113 | $25,547 |
| Subtotal Spent on Operations | $55,345 | $69,113 | $77,047 |
| Additional Cash Spent | |||
| Sales Tax, VAT, HST/GST Paid Out | $0 | $0 | $0 |
| Principal Repayment of Current Borrowing | $0 | $0 | $0 |
| Other Liabilities Principal Repayment | $0 | $0 | $0 |
| Long-term Liabilities Principal Repayment | $0 | $0 | $0 |
| Purchase Other Current Assets | $0 | $0 | $0 |
| Purchase Long-term Assets | $0 | $0 | $0 |
| Dividends | $0 | $0 | $0 |
| Subtotal Cash Spent | $55,345 | $69,113 | $77,047 |
| Net Cash Flow | $13,555 | $9,301 | $9,208 |
| Cash Balance | $13,755 | $23,056 | $32,264 |
7.6 Projected Balance Sheet
The Balance Sheet in the following table shows managed but sufficient growth of net worth, and a healthy financial position. The monthly estimates are included in the appendices.
| Pro Forma Balance Sheet | |||
| Year 1 | Year 2 | Year 3 | |
| Assets | |||
| Current Assets | |||
| Cash | $13,755 | $23,056 | $32,264 |
| Other Current Assets | $1,000 | $1,000 | $1,000 |
| Total Current Assets | $14,755 | $24,056 | $33,264 |
| Long-term Assets | |||
| Long-term Assets | $0 | $0 | $0 |
| Accumulated Depreciation | $0 | $0 | $0 |
| Total Long-term Assets | $0 | $0 | $0 |
| Total Assets | $14,755 | $24,056 | $33,264 |
| Liabilities and Capital | Year 1 | Year 2 | Year 3 |
| Current Liabilities | |||
| Accounts Payable | $2,313 | $1,952 | $2,113 |
| Current Borrowing | $0 | $0 | $0 |
| Other Current Liabilities | $0 | $0 | $0 |
| Subtotal Current Liabilities | $2,313 | $1,952 | $2,113 |
| Long-term Liabilities | $0 | $0 | $0 |
| Total Liabilities | $2,313 | $1,952 | $2,113 |
| Paid-in Capital | $1,870 | $1,870 | $1,870 |
| Retained Earnings | ($670) | $10,573 | $20,234 |
| Earnings | $11,243 | $9,661 | $9,048 |
| Total Capital | $12,443 | $22,104 | $31,151 |
| Total Liabilities and Capital | $14,755 | $24,056 | $33,264 |
| Net Worth | $12,442 | $22,104 | $31,151 |
7.7 Business Ratios
The following table contains ratios from the entertainment industry, as determined by the Standard Industry Classification (SIC) Index #7299, Personal Services.
| Ratio Analysis | ||||
| Year 1 | Year 2 | Year 3 | Industry Profile | |
| Sales Growth | 0.00% | 13.81% | 10.00% | 8.15% |
| Percent of Total Assets | ||||
| Other Current Assets | 6.78% | 4.16% | 3.01% | 35.03% |
| Total Current Assets | 100.00% | 100.00% | 100.00% | 55.79% |
| Long-term Assets | 0.00% | 0.00% | 0.00% | 44.21% |
| Total Assets | 100.00% | 100.00% | 100.00% | 100.00% |
| Current Liabilities | 15.67% | 8.12% | 6.35% | 25.11% |
| Long-term Liabilities | 0.00% | 0.00% | 0.00% | 22.00% |
| Total Liabilities | 15.67% | 8.12% | 6.35% | 47.11% |
| Net Worth | 84.33% | 91.88% | 93.65% | 52.89% |
| Percent of Sales | ||||
| Sales | 100.00% | 100.00% | 100.00% | 100.00% |
| Gross Margin | 85.76% | 86.15% | 86.16% | 100.00% |
| Selling, General & Administrative Expenses | 75.24% | 80.29% | 82.38% | 77.99% |
| Advertising Expenses | 3.48% | 3.83% | 4.06% | 1.85% |
| Profit Before Interest and Taxes | 21.76% | 16.43% | 13.99% | 3.35% |
| Main Ratios | ||||
| Current | 6.38 | 12.32 | 15.74 | 1.73 |
| Quick | 6.38 | 12.32 | 15.74 | 1.30 |
| Total Debt to Total Assets | 15.67% | 8.12% | 6.35% | 6.16% |
| Pre-tax Return on Net Worth | 120.47% | 58.28% | 38.73% | 59.92% |
| Pre-tax Return on Assets | 101.59% | 53.55% | 36.27% | 15.38% |
| Additional Ratios | Year 1 | Year 2 | Year 3 | |
| Net Profit Margin | 16.32% | 12.32% | 10.49% | n.a |
| Return on Equity | 90.36% | 43.71% | 29.04% | n.a |
| Activity Ratios | ||||
| Accounts Payable Turnover | 9.58 | 12.17 | 12.17 | n.a |
| Payment Days | 27 | 33 | 29 | n.a |
| Total Asset Turnover | 4.67 | 3.26 | 2.59 | n.a |
| Debt Ratios | ||||
| Debt to Net Worth | 0.19 | 0.09 | 0.07 | n.a |
| Current Liab. to Liab. | 1.00 | 1.00 | 1.00 | n.a |
| Liquidity Ratios | ||||
| Net Working Capital | $12,442 | $22,104 | $31,151 | n.a |
| Interest Coverage | 0.00 | 0.00 | 0.00 | n.a |
| Additional Ratios | ||||
| Assets to Sales | 0.21 | 0.31 | 0.39 | n.a |
| Current Debt/Total Assets | 16% | 8% | 6% | n.a |
| Acid Test | 6.38 | 12.32 | 15.74 | n.a |
| Sales/Net Worth | 5.54 | 3.55 | 2.77 | n.a |
| Dividend Payout | 0.00 | 0.00 | 0.00 | n.a |
Appendix
| Sales Forecast | |||||||||||||
| Month 1 | Month 2 | Month 3 | Month 4 | Month 5 | Month 6 | Month 7 | Month 8 | Month 9 | Month 10 | Month 11 | Month 12 | ||
| Unit Sales | |||||||||||||
| Tarot | 0% | 96 | 106 | 116 | 128 | 180 | 156 | 210 | 188 | 206 | 226 | 248 | 274 |
| Astrology | 0% | 48 | 53 | 58 | 64 | 95 | 78 | 110 | 94 | 103 | 113 | 124 | 137 |
| Other- Quick Readings | 0% | 58 | 64 | 70 | 77 | 84 | 94 | 102 | 113 | 124 | 136 | 149 | 164 |
| Total Unit Sales | 202 | 223 | 244 | 269 | 359 | 328 | 422 | 395 | 433 | 475 | 521 | 575 | |
| Unit Prices | Month 1 | Month 2 | Month 3 | Month 4 | Month 5 | Month 6 | Month 7 | Month 8 | Month 9 | Month 10 | Month 11 | Month 12 | |
| Tarot | $10.00 | $10.00 | $10.00 | $15.00 | $15.00 | $15.00 | $15.00 | $15.00 | $15.00 | $15.00 | $15.00 | $15.00 | |
| Astrology | $20.00 | $20.00 | $20.00 | $25.00 | $25.00 | $25.00 | $25.00 | $25.00 | $25.00 | $25.00 | $25.00 | $25.00 | |
| Other- Quick Readings | $10.00 | $10.00 | $10.00 | $10.00 | $10.00 | $10.00 | $10.00 | $10.00 | $10.00 | $10.00 | $10.00 | $10.00 | |
| Sales | |||||||||||||
| Tarot | $960 | $1,060 | $1,160 | $1,920 | $2,700 | $2,340 | $3,150 | $2,820 | $3,090 | $3,390 | $3,720 | $4,110 | |
| Astrology | $960 | $1,060 | $1,160 | $1,600 | $2,375 | $1,950 | $2,750 | $2,350 | $2,575 | $2,825 | $3,100 | $3,425 | |
| Other- Quick Readings | $580 | $640 | $700 | $770 | $840 | $940 | $1,020 | $1,130 | $1,240 | $1,360 | $1,490 | $1,640 | |
| Total Sales | $2,500 | $2,760 | $3,020 | $4,290 | $5,915 | $5,230 | $6,920 | $6,300 | $6,905 | $7,575 | $8,310 | $9,175 | |
| Direct Unit Costs | Month 1 | Month 2 | Month 3 | Month 4 | Month 5 | Month 6 | Month 7 | Month 8 | Month 9 | Month 10 | Month 11 | Month 12 | |
| Tarot | 0.00% | $2.00 | $2.00 | $2.00 | $2.00 | $2.00 | $2.00 | $2.00 | $2.00 | $2.00 | $2.00 | $2.00 | $2.00 |
| Astrology | 0.00% | $4.00 | $4.00 | $4.00 | $4.00 | $4.00 | $4.00 | $4.00 | $4.00 | $4.00 | $4.00 | $4.00 | $4.00 |
| Other- Quick Readings | 0.00% | $0.50 | $0.50 | $1.00 | $1.00 | $1.00 | $1.00 | $1.00 | $1.00 | $1.00 | $1.00 | $1.00 | $1.00 |
| Direct Cost of Sales | |||||||||||||
| Tarot | $192 | $212 | $232 | $256 | $360 | $312 | $420 | $376 | $412 | $452 | $496 | $548 | |
| Astrology | $192 | $212 | $232 | $256 | $380 | $312 | $440 | $376 | $412 | $452 | $496 | $548 | |
| Other- Quick Readings | $29 | $32 | $70 | $77 | $84 | $94 | $102 | $113 | $124 | $136 | $149 | $164 | |
| Subtotal Direct Cost of Sales | $413 | $456 | $534 | $589 | $824 | $718 | $962 | $865 | $948 | $1,040 | $1,141 | $1,260 | |
| Personnel Plan | |||||||||||||
| Month 1 | Month 2 | Month 3 | Month 4 | Month 5 | Month 6 | Month 7 | Month 8 | Month 9 | Month 10 | Month 11 | Month 12 | ||
| Principal | 0% | $1,000 | $1,000 | $2,000 | $2,000 | $3,000 | $3,000 | $3,000 | $3,000 | $3,000 | $4,000 | $4,000 | $5,000 |
| Other | 0% | $0 | $0 | $0 | $0 | $0 | $0 | $0 | $0 | $0 | $500 | $500 | $500 |
| Total People | 1 | 1 | 1 | 1 | 1 | 1 | 1 | 1 | 1 | 2 | 2 | 2 | |
| Total Payroll | $1,000 | $1,000 | $2,000 | $2,000 | $3,000 | $3,000 | $3,000 | $3,000 | $3,000 | $4,500 | $4,500 | $5,500 | |
| General Assumptions | |||||||||||||
| Month 1 | Month 2 | Month 3 | Month 4 | Month 5 | Month 6 | Month 7 | Month 8 | Month 9 | Month 10 | Month 11 | Month 12 | ||
| Plan Month | 1 | 2 | 3 | 4 | 5 | 6 | 7 | 8 | 9 | 10 | 11 | 12 | |
| Current Interest Rate | 10.00% | 10.00% | 10.00% | 10.00% | 10.00% | 10.00% | 10.00% | 10.00% | 10.00% | 10.00% | 10.00% | 10.00% | |
| Long-term Interest Rate | 10.00% | 10.00% | 10.00% | 10.00% | 10.00% | 10.00% | 10.00% | 10.00% | 10.00% | 10.00% | 10.00% | 10.00% | |
| Tax Rate | 25.00% | 25.00% | 25.00% | 25.00% | 25.00% | 25.00% | 25.00% | 25.00% | 25.00% | 25.00% | 25.00% | 25.00% | |
| Other | 0 | 0 | 0 | 0 | 0 | 0 | 0 | 0 | 0 | 0 | 0 | 0 | |
| Pro Forma Profit and Loss | |||||||||||||
| Month 1 | Month 2 | Month 3 | Month 4 | Month 5 | Month 6 | Month 7 | Month 8 | Month 9 | Month 10 | Month 11 | Month 12 | ||
| Sales | $2,500 | $2,760 | $3,020 | $4,290 | $5,915 | $5,230 | $6,920 | $6,300 | $6,905 | $7,575 | $8,310 | $9,175 | |
| Direct Cost of Sales | $413 | $456 | $534 | $589 | $824 | $718 | $962 | $865 | $948 | $1,040 | $1,141 | $1,260 | |
| Other | $5 | $5 | $5 | $5 | $5 | $5 | $5 | $5 | $5 | $5 | $5 | $5 | |
| Total Cost of Sales | $418 | $461 | $539 | $594 | $829 | $723 | $967 | $870 | $953 | $1,045 | $1,146 | $1,265 | |
| Gross Margin | $2,082 | $2,299 | $2,481 | $3,696 | $5,086 | $4,507 | $5,953 | $5,430 | $5,952 | $6,530 | $7,164 | $7,910 | |
| Gross Margin % | 83.28% | 83.30% | 82.15% | 86.15% | 85.98% | 86.18% | 86.03% | 86.19% | 86.20% | 86.20% | 86.21% | 86.21% | |
| Expenses | |||||||||||||
| Payroll | $1,000 | $1,000 | $2,000 | $2,000 | $3,000 | $3,000 | $3,000 | $3,000 | $3,000 | $4,500 | $4,500 | $5,500 | |
| Sales and Marketing and Other Expenses | $450 | $250 | $250 | $250 | $250 | $250 | $250 | $250 | $250 | $250 | $250 | $250 | |
| Depreciation | $0 | $0 | $0 | $0 | $0 | $0 | $0 | $0 | $0 | $0 | $0 | $0 | |
| Rent | $450 | $450 | $450 | $450 | $450 | $450 | $450 | $450 | $450 | $450 | $450 | $450 | |
| Payroll Taxes | 15% | $0 | $0 | $0 | $0 | $0 | $0 | $0 | $0 | $0 | $0 | $0 | $0 |
| Other | $0 | $0 | $0 | $0 | $0 | $0 | $0 | $0 | $0 | $0 | $0 | $0 | |
| Total Operating Expenses | $1,900 | $1,700 | $2,700 | $2,700 | $3,700 | $3,700 | $3,700 | $3,700 | $3,700 | $5,200 | $5,200 | $6,200 | |
| Profit Before Interest and Taxes | $182 | $599 | ($219) | $996 | $1,386 | $807 | $2,253 | $1,730 | $2,252 | $1,330 | $1,964 | $1,710 | |
| EBITDA | $182 | $599 | ($219) | $996 | $1,386 | $807 | $2,253 | $1,730 | $2,252 | $1,330 | $1,964 | $1,710 | |
| Interest Expense | $0 | $0 | $0 | $0 | $0 | $0 | $0 | $0 | $0 | $0 | $0 | $0 | |
| Taxes Incurred | $46 | $150 | ($55) | $249 | $347 | $202 | $563 | $433 | $563 | $333 | $491 | $428 | |
| Net Profit | $137 | $449 | ($164) | $747 | $1,040 | $605 | $1,690 | $1,298 | $1,689 | $998 | $1,473 | $1,283 | |
| Net Profit/Sales | 5.46% | 16.28% | -5.44% | 17.41% | 17.57% | 11.57% | 24.42% | 20.60% | 24.46% | 13.17% | 17.73% | 13.98% | |
| Pro Forma Cash Flow | |||||||||||||
| Month 1 | Month 2 | Month 3 | Month 4 | Month 5 | Month 6 | Month 7 | Month 8 | Month 9 | Month 10 | Month 11 | Month 12 | ||
| Cash Received | |||||||||||||
| Cash from Operations | |||||||||||||
| Cash Sales | $2,500 | $2,760 | $3,020 | $4,290 | $5,915 | $5,230 | $6,920 | $6,300 | $6,905 | $7,575 | $8,310 | $9,175 | |
| Subtotal Cash from Operations | $2,500 | $2,760 | $3,020 | $4,290 | $5,915 | $5,230 | $6,920 | $6,300 | $6,905 | $7,575 | $8,310 | $9,175 | |
| Additional Cash Received | |||||||||||||
| Sales Tax, VAT, HST/GST Received | 0.00% | $0 | $0 | $0 | $0 | $0 | $0 | $0 | $0 | $0 | $0 | $0 | $0 |
| New Current Borrowing | $0 | $0 | $0 | $0 | $0 | $0 | $0 | $0 | $0 | $0 | $0 | $0 | |
| New Other Liabilities (interest-free) | $0 | $0 | $0 | $0 | $0 | $0 | $0 | $0 | $0 | $0 | $0 | $0 | |
| New Long-term Liabilities | $0 | $0 | $0 | $0 | $0 | $0 | $0 | $0 | $0 | $0 | $0 | $0 | |
| Sales of Other Current Assets | $0 | $0 | $0 | $0 | $0 | $0 | $0 | $0 | $0 | $0 | $0 | $0 | |
| Sales of Long-term Assets | $0 | $0 | $0 | $0 | $0 | $0 | $0 | $0 | $0 | $0 | $0 | $0 | |
| New Investment Received | $0 | $0 | $0 | $0 | $0 | $0 | $0 | $0 | $0 | $0 | $0 | $0 | |
| Subtotal Cash Received | $2,500 | $2,760 | $3,020 | $4,290 | $5,915 | $5,230 | $6,920 | $6,300 | $6,905 | $7,575 | $8,310 | $9,175 | |
| Expenditures | Month 1 | Month 2 | Month 3 | Month 4 | Month 5 | Month 6 | Month 7 | Month 8 | Month 9 | Month 10 | Month 11 | Month 12 | |
| Expenditures from Operations | |||||||||||||
| Cash Spending | $1,000 | $1,000 | $2,000 | $2,000 | $3,000 | $3,000 | $3,000 | $3,000 | $3,000 | $4,500 | $4,500 | $5,500 | |
| Bill Payments | $45 | $1,362 | $1,307 | $1,196 | $1,554 | $1,867 | $1,645 | $2,223 | $2,010 | $2,211 | $2,086 | $2,339 | |
| Subtotal Spent on Operations | $1,045 | $2,362 | $3,307 | $3,196 | $4,554 | $4,867 | $4,645 | $5,223 | $5,010 | $6,711 | $6,586 | $7,839 | |
| Additional Cash Spent | |||||||||||||
| Sales Tax, VAT, HST/GST Paid Out | $0 | $0 | $0 | $0 | $0 | $0 | $0 | $0 | $0 | $0 | $0 | $0 | |
| Principal Repayment of Current Borrowing | $0 | $0 | $0 | $0 | $0 | $0 | $0 | $0 | $0 | $0 | $0 | $0 | |
| Other Liabilities Principal Repayment | $0 | $0 | $0 | $0 | $0 | $0 | $0 | $0 | $0 | $0 | $0 | $0 | |
| Long-term Liabilities Principal Repayment | $0 | $0 | $0 | $0 | $0 | $0 | $0 | $0 | $0 | $0 | $0 | $0 | |
| Purchase Other Current Assets | $0 | $0 | $0 | $0 | $0 | $0 | $0 | $0 | $0 | $0 | $0 | $0 | |
| Purchase Long-term Assets | $0 | $0 | $0 | $0 | $0 | $0 | $0 | $0 | $0 | $0 | $0 | $0 | |
| Dividends | $0 | $0 | $0 | $0 | $0 | $0 | $0 | $0 | $0 | $0 | $0 | $0 | |
| Subtotal Cash Spent | $1,045 | $2,362 | $3,307 | $3,196 | $4,554 | $4,867 | $4,645 | $5,223 | $5,010 | $6,711 | $6,586 | $7,839 | |
| Net Cash Flow | $1,455 | $398 | ($287) | $1,094 | $1,361 | $363 | $2,275 | $1,077 | $1,895 | $864 | $1,724 | $1,336 | |
| Cash Balance | $1,655 | $2,053 | $1,766 | $2,860 | $4,221 | $4,584 | $6,859 | $7,936 | $9,832 | $10,695 | $12,419 | $13,755 | |
| Pro Forma Balance Sheet | |||||||||||||
| Month 1 | Month 2 | Month 3 | Month 4 | Month 5 | Month 6 | Month 7 | Month 8 | Month 9 | Month 10 | Month 11 | Month 12 | ||
| Assets | Starting Balances | ||||||||||||
| Current Assets | |||||||||||||
| Cash | $200 | $1,655 | $2,053 | $1,766 | $2,860 | $4,221 | $4,584 | $6,859 | $7,936 | $9,832 | $10,695 | $12,419 | $13,755 |
| Other Current Assets | $1,000 | $1,000 | $1,000 | $1,000 | $1,000 | $1,000 | $1,000 | $1,000 | $1,000 | $1,000 | $1,000 | $1,000 | $1,000 |
| Total Current Assets | $1,200 | $2,655 | $3,053 | $2,766 | $3,860 | $5,221 | $5,584 | $7,859 | $8,936 | $10,832 | $11,695 | $13,419 | $14,755 |
| Long-term Assets | |||||||||||||
| Long-term Assets | $0 | $0 | $0 | $0 | $0 | $0 | $0 | $0 | $0 | $0 | $0 | $0 | $0 |
| Accumulated Depreciation | $0 | $0 | $0 | $0 | $0 | $0 | $0 | $0 | $0 | $0 | $0 | $0 | $0 |
| Total Long-term Assets | $0 | $0 | $0 | $0 | $0 | $0 | $0 | $0 | $0 | $0 | $0 | $0 | $0 |
| Total Assets | $1,200 | $2,655 | $3,053 | $2,766 | $3,860 | $5,221 | $5,584 | $7,859 | $8,936 | $10,832 | $11,695 | $13,419 | $14,755 |
| Liabilities and Capital | Month 1 | Month 2 | Month 3 | Month 4 | Month 5 | Month 6 | Month 7 | Month 8 | Month 9 | Month 10 | Month 11 | Month 12 | |
| Current Liabilities | |||||||||||||
| Accounts Payable | $0 | $1,318 | $1,267 | $1,145 | $1,492 | $1,813 | $1,571 | $2,156 | $1,936 | $2,142 | $2,008 | $2,259 | $2,313 |
| Current Borrowing | $0 | $0 | $0 | $0 | $0 | $0 | $0 | $0 | $0 | $0 | $0 | $0 | $0 |
| Other Current Liabilities | $0 | $0 | $0 | $0 | $0 | $0 | $0 | $0 | $0 | $0 | $0 | $0 | $0 |
| Subtotal Current Liabilities | $0 | $1,318 | $1,267 | $1,145 | $1,492 | $1,813 | $1,571 | $2,156 | $1,936 | $2,142 | $2,008 | $2,259 | $2,313 |
| Long-term Liabilities | $0 | $0 | $0 | $0 | $0 | $0 | $0 | $0 | $0 | $0 | $0 | $0 | $0 |
| Total Liabilities | $0 | $1,318 | $1,267 | $1,145 | $1,492 | $1,813 | $1,571 | $2,156 | $1,936 | $2,142 | $2,008 | $2,259 | $2,313 |
| Paid-in Capital | $1,870 | $1,870 | $1,870 | $1,870 | $1,870 | $1,870 | $1,870 | $1,870 | $1,870 | $1,870 | $1,870 | $1,870 | $1,870 |
| Retained Earnings | ($670) | ($670) | ($670) | ($670) | ($670) | ($670) | ($670) | ($670) | ($670) | ($670) | ($670) | ($670) | ($670) |
| Earnings | $0 | $137 | $586 | $422 | $1,169 | $2,208 | $2,813 | $4,503 | $5,801 | $7,490 | $8,487 | $9,960 | $11,243 |
| Total Capital | $1,200 | $1,337 | $1,786 | $1,622 | $2,369 | $3,408 | $4,013 | $5,703 | $7,001 | $8,690 | $9,687 | $11,160 | $12,443 |
| Total Liabilities and Capital | $1,200 | $2,655 | $3,053 | $2,766 | $3,860 | $5,221 | $5,584 | $7,859 | $8,936 | $10,832 | $11,695 | $13,419 | $14,755 |
| Net Worth | $1,200 | $1,337 | $1,786 | $1,622 | $2,369 | $3,408 | $4,013 | $5,703 | $7,001 | $8,690 | $9,687 | $11,160 | $12,442 |

