
NALB Creative Center
Executive Summary
NALB Creative Center (NCC) is the place where artists meet. NALB is an acronym for “No Artist Left Behind,” with our company by-line stating: “Live Your Art.” NCC is a specialty retail store offering a large array of artists’ materials and supplies, crafters’ needs, a gallery, and an education center. NCC will provide a pleasant facility that will inspire and support amateurs, professionals and crafters in the Big Island art community. NALB will sponsor art shows and competitions, art and craft fairs, scholarships for artists to continue their formal education, and other community events. NALB will facilitate, organize and offer creative workshops and classes in a variety of techniques and media.
The Market
NALB is at the forefront in an exciting and growing market. The island of Hawaii currently has only two stores exclusively offering art and craft supplies. Neither of these stores is able to offer education and hands-on opportunities. Neither currently supports the artists community in active ways. They are also not able to give the high level of customer support that NALB can. NALB is the only art supply store on the island that is owned and operated exclusively by artists. NALB Creative Center will tap into the growing number of professional artists in West Hawaii. We will also fill the needs of the growing market of retirees (100% growth in the last three years) many of whom have settled in Kona because of the thriving art community that exists here. NALB will actively market to teachers and students in the growing public and private education systems.
The Organization
NALB is owned and operated by practicing artists. It is founded on the idea that maintaining satisfied customers is essential to the bottom line. With this in mind, NALB Creative Center will be working hard to ensure that all of their customers’ expectations are exceeded in all transactions. To maintain a presence within the art and craft community and close relationships to customers, NCC will be an active member of the local art scene through participation and education. NALB staff will receive training in the most current trends and products. NALB’s owners will both anticipate and set consumer trends in creative work.
Products, Services, and Delivery
NALB will be located in the commercial business park between Costco and Home Depot, in a 3,000 square foot store. The previous tenants were cabinet makers and much of their handiwork remains to our benefit. NALB will have the floor space to offer a wide variety of art and craft supplies. Due to our size, we will also have the purchasing power to buy from manufacturers directly, thus avoiding middle man mark-ups. We will offer discounts to regular customers. We will also offer free delivery in North Kona for orders of $300 or more. NALB will offer Artist’s Oasis holidays to travelers by arranging local accommodations, renting equipment, selling supplies, and offering maps and guides.
Financials
NCC will show modest profit from month one. Margins are forecasted to be at 50%, due to the ability to buy wholesale. Sales in the first full year will be slightly over $300,000. We are projecting conservatively a growth rate of 5% the first three years and 20% thereafter, even though existing art supply stores are reporting growth of over 30%. We budget conservatively, but have great vision.

1.1 Objectives
- Customer Satisfaction: To create a shopping environment that caters to the needs of the art and craft community of the Big Island by offering knowledgeable and professional customer service. Customer satisfaction will be measured through repeat business (our goal is that 50% of our customers will return within 6 months for an additional purchase) and multiple sales (our goal is that 30% of sales are accompanied by an additional purchase).
- To earn 80% market share and become the number one art and craft supplier on the island.
- To achieve a 50% profit margin within the first year.
- To be an active and vocal member in the community and to provide continual re-investment through sponsorship of community activities and celebrations, including: supporting art and craft events, hosting classes, providing scholarships.
- To develop, in year two and three, Artist’s Oasis of Hawaii. In this program we would arrange local accommodations and materials rental for visiting/vacationing artists.
1.2 Keys to Success
In order for NALB Creative Center to succeed we must:
- Provide for the satisfaction of 100% of our customers and vendors.
- Advertise and promote in areas where our target customer base will learn about our store.
- Continuously review our inventory and sales and adjust our inventory levels accordingly.
- Sell products that are of the highest reliability and quality. We must offer as many or more premium products than our competition offers. Offer loss leaders and other promotions that bring customers into the store to buy goods, explore our line of services, and sign up for future events.
- Be an active member of the community.
- Provide in-store classes, demonstrations, and events.
1.3 Mission
NALB Creative Center’s mission is to support and contribute to the community of artists and crafters by offering quality, name brand supplies to accommodate customer needs; by hosting and supporting shows, events, classes and contests; and by promoting the island as an artist’s oasis and destination.
We will strive, constantly, to supply what the consumer is asking for; we will continually review what is available in the marketplace. We will provide new products and services to the areas of need. We will maintain NALB as a place for artists to gather.
Success will ultimately be measured by our customers choosing us because of their belief in our ability to meet or exceed their expectations of price, service, and selection.
Company Summary
NALB Creative Center is a start up, to go into business in the Summer of this year. We will offer a large variety of art and craft supplies, focusing on those items that are currently unavailable on this island. The Internet will continue to be a competitor, as artists use websites to buy familiar products. We will stock products that artists don’t necessarily have experience with. We will maintain our price comparisons to include those available on line.
We will offer classes in the use of new materials and techniques.
We will build an Artist’s Oasis tour program. We will book local Bed and Breakfasts; provide maps and guides for appropriate plein-air sites; rent easels and materials; sell paint and other supplies and ship completed work to the clients when dry.
We will expand the store into an art center including: A fine art gallery, offering original art at, or near, wholesale prices; Musical instruments/studio space; Classrooms for art/music lessons; Art/Music books; Live music/coffee bar; Do-it-Yourself crafts such as specialty T-Shirts, signs, cards, ceramics for the tourist trade.
2.1 Company Ownership
NALB Creative Center is a subsidiary of NALB LLC, a limited liability corporation equally owned and operated by Callie Graff and VanDyke Brown. Additional subsidiaries include NALB Design (Interior/Web), NALB Fine Art, NALB Music.
2.2 Start-up Summary
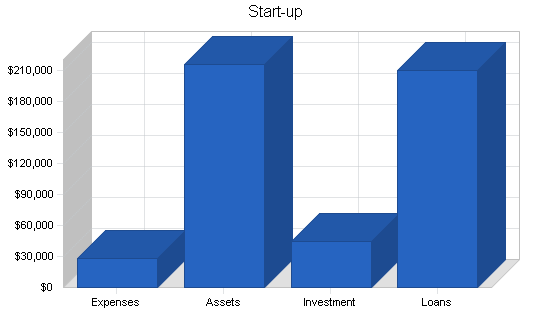
NALB Creative Center’s start-up costs are listed below. The company will start with 10 months inventory on hand as this is the main revenue generator. The majority of the company’s assets will reside in inventory.

There will be other normal business costs such as a liability umbrella, rent, interior design costs, and opening day promotions.
Current (short-term) assets, acquired during interior build-out, shelving, slotwall, fixtures, signage, display cases, etc., come to $26,000.
The operating capital cash on hand balance will be $31,050.
The purpose of this business plan is to drive the company direction in accord with its vision and to secure a $210,000 loan. This supplemental financing is required to work on site preparation, inventory, and operational expenses. Other financing will include the owner’s investment of $45,000 and a short-term revolving line-of-credit for inventory replenishment during months of high receipts.
Successful operation and the building of a loyal customer base will allow NALB Creative Center to be self-sufficient and profitable in the first full year.
| Start-up | |
| Requirements | |
| Start-up Expenses | |
| Legal | $500 |
| Stationery etc. | $200 |
| Insurance | $3,200 |
| Rent and Deposit | $10,000 |
| Travel: Trade Show | $3,500 |
| Set-up Banking | $50 |
| POS System | $2,000 |
| Security System | $1,500 |
| Advertising | $1,000 |
| Phone System | $1,000 |
| Computers | $5,000 |
| Other | $0 |
| Total Start-up Expenses | $27,950 |
| Start-up Assets | |
| Cash Required | $20,000 |
| Start-up Inventory | $130,000 |
| Other Current Assets | $26,000 |
| Long-term Assets | $40,000 |
| Total Assets | $216,000 |
| Total Requirements | $243,950 |
Services
NALB Creative Center will provide a wide variety of products of interest to artists and crafters. Our wholesale suppliers will include: Grumbacher, Liquitex, Windsor and Newton, Mabef Easels, Duncan, PrismaColor, Speedball, Masterpiece, Fredrix, Holbein, Rembrandt, and Strathmore. Vendors will include MacPherson and Herr’s. There are thousands of products available, we will offer many that are unusual, or new, as well as the basics that every artist needs on a regular basis. We will offer lines to include bargain, mid-range and professional quality products.
Management will rely on customer feedback, suggestions, and daily sales reports to introduce or eliminate certain brands or products.
In year two we will begin marketing our Artist’s Oasis tour packages, as well as art/craft equipment rental. Rentals will include equipment items that are too bulky to carry on vacation, or too expensive, or used only periodically, for the average artist or crafter to justify purchase. An example would be a Giclee Printer.
Market Analysis Summary
In West Hawaii, the mauka community of Holualoa in Kona, Kealakekua and South Kona, as well as Waimea and Hawi in Kohala are three communities with large artist populations and galleries. In West Hawaii, the Holualoa Foundation for Arts and Culture, the Society for Kona’s Education and Art, the Kailua Village Artists, the Kona Arts Center, the Waimea Arts Center and other well-established non-profit groups offer arts classes and instruction in various media year-round to children and adults.
NALB Creative Center will market to four primary customers:
- Professional artists.
- Amateur artists and crafters, including hobbyists.
- Businesses, such as architects, graphic designers, interior designers, or direct mail advertisers.
- Teachers and students.
4.1 Market Segmentation
Average household income has steadily grown with about 36 percent of Big Island households reporting incomes of $25,000 – $50,000 and another 36 percent in the $50,000 – $75,000 range. Predictions for West Hawaii include continued population growth, economic growth and business opportunity.
- Professional artists. There are currently at least 39 Fine Art Galleries on the west side of Hawaii. Each gallery represents several artists.
- Amateur artists and crafters, including hobbyists. Many of the amateurs are retirees* with relatively high disposable income levels.
- Businesses. Architects (36 companies on island), technical drawing, interior/graphic design (18 companies on island), advertising/direct mail companies (12 companies on island).
- Teachers and students. This group will include K-12 teachers and students as well as those attending art classes at the store. (25,000 public school students).
*The total population of Hawaii County has grown by about 20 percent in the past decade, the older segments – such as those from 45 – 54 and those 55 and up have increased at rates of 100 percent and 64 percent, respectively.

| Market Analysis | |||||||
| Year 1 | Year 2 | Year 3 | Year 4 | Year 5 | |||
| Potential Customers | Growth | CAGR | |||||
| Professional Artists | 20% | 200 | 240 | 288 | 346 | 415 | 20.02% |
| Amateur Artists | 40% | 1,000 | 1,400 | 1,960 | 2,744 | 3,842 | 40.00% |
| Business to Business | 10% | 66 | 73 | 80 | 88 | 97 | 10.10% |
| Educational | 20% | 10,000 | 12,000 | 14,400 | 17,280 | 20,736 | 20.00% |
| Total | 22.16% | 11,266 | 13,713 | 16,728 | 20,458 | 25,090 | 22.16% |
4.2 Target Market Segment Strategy
- Professional Artists. With only one existing art supply store on this side of the island, if the professional’s need for customer service is not met, they will utilize the Internet and mainland stores. The area we can impact most heavily is having the actual products in the store that artists can manipulate, study, etc. This would especially apply to products that a customer may not take a chance on ordering from an Internet site (because of variations in quality, or new techniques/products).
- Amateur artists and crafters, including hobbyists. In general, this segment has the same needs, desires, and fulfillment requirements as the professional artists. Some will be purchasing from lower and mid-priced product lines, but many are avid in pursuing their avocations, and appreciate, buy and use the professional quality materials.
- Businesses such as architectural, technical drawing, interior/graphic design, advertising/direct mail companies. Currently, this segment is not served in any way on the west side of the island, except by casual shopping at the existing art supply store. Much of the purchasing by this group is done on the Internet.
- Teachers and students. This is a much neglected segment on our island. Students and teachers currently have access to products in Wal-Mart, K-Mart, a small school supply specialty shop (open part-time), and the sole existing art supply store. We plan to have a store big enough to accommodate the art supply needs of the education community.
4.3 Service Business Analysis
NALB Creative Center is a specialty retailer filling an underserved niche market on the island.
Currently customers can buy low end art products at Wal-Mart, K-Mart, Long’s, and Ace Hardware. The products offered at these outlets is severely limited. Products include: a few small canvases, a small selection of papers in limited sizes, a few paint sets, and writing pens and pencils. The same stores offer limited selections of craft and hobby products as well, usually aimed at general interest and unsophisticated shoppers.
Hawaii Printing Corp. and Kona Coast Office Supply, Inc. stock a limited variety of drafting supplies: pens, pencils and paper products that could be used for arts and crafts but are usually associated with writing.
Art and craft products can also be purchased at Art Supply Hawaii in the old industrial area. This store offers a much better selection in terms of variety, type and quality, but has a reputation for poor customer service satisfaction.
4.3.1 Competition and Buying Patterns
Art Supply of Hawaii is the closest competitor to NCC. ASH is located in the old industrial area of Kona. It is a small two-story facility of 1,300 sq ft. The store has been in business for 10 years, seven years in Hilo and three years in Kona. They offer a variety of fine art supplies, canvas, paints, stained glass, ceramics, oriental arts, beads, textile arts, crafts, scrapbooking, and children’s craft kits. The store is currently for sale with an asking price of $395,000. According to their advertising, the store serves a growing local artist community, retirees and both public and private schools.
Many artists known to the owners, refuse to shop at ASH because they are dissatisfied with the level of customer service, and generally uncomfortable in the shopping experience. They currently shop off the Internet, and in mainland stores during infrequent visits out-of-state. These artists represent a significant customer base for NALB Creative Center.
Customers in the educational segment buy at the discount stores, due to the convenience of one-stop shopping for all their household needs as well as school supplies for the kids. We will market directly to the art teachers in the local schools. We will supply order forms to the classrooms, and deliver directly to the schools.
Many professional artists buy from Internet sources due to the still limited selections in the local marketplace in the quantities needed. With a store space nearly three times the size of ASH, we will be able to stock appropriate quantities, styles and sizes, and deliver orders much more quickly than Internet sources. We will provide free delivery to the North Kona area on purchases over $300. We will also provide friendly, professional customer service. We’ll provide a generous return and exchange policy. We’ll provide hands-on access to materials and make NALB’s a gathering place for artists. None of these benefits are available through Internet sources.
Strategy and Implementation Summary
NALB’s goal is to provide products, service and education to the underserved creative community on the Big Island. The current population is underserved due to a perceived lack of customer service in the few existing outlets for supplies.
Our intention is to gain 80% of the market share by focusing on our customer service, niche positioning, convenient location, quality brands, special promotions and becoming a gathering spot for artists. While we will focus on our primary customer segments, we offer products that virtually every artist/crafter requires. We will create an atmosphere that is appealing to the true artist, whether amateur or professional. The balance of customers will come because they will see this as the center of creative people.
The store will merchandise in a manner consistent with our values and the fundamentals of good retail space use. We will provide a bulletin board for all manner of communications among the community. We will provide space for classes and creative hands-on experimentation.
Strategic Assumptions:
- Every resident on the Big Island is a potential customer. By marketing to our two target segments, we will expose ourselves to additional new customers.
- Our proximity to Costco and Home Depot will bring in those travelling from outside Kona.
- We will continue to be involved in the art and craft community as participants, suppliers and encouragers.
5.1 Competitive Edge
NALB’s competitive edge involves five areas:
- Customer Service as priority one.
- Location. The store is located in the Kaloko Industrial Park, one block from both Costco and Home Depot. The location will attract more customers from out of the Kona area because a visit to the art supply store can be consolidated with a trip to Costco, a store with an established draw on customers from all over the island. The store is also visible from the Queen’s Highway due to signage on the makai side of the building.
- NALB will be an art education center. We will have a large classroom available for instruction in various media and techniques.
- NALB will be a gathering place for artists. We will dedicate a portion of the warehouse area to a cafe style lounge where customers can read art magazines, look at the art gallery, drink coffee, listen to music, or visit with other artists.
- We will provide percentage discounts for repeat customers.
Each of these is a competitive advantage because none is being addressed, by an art supply outlet, in Kona at this time.
5.2 Marketing Strategy
Our marketing strategy will focus heavily on customer service with loyalty and retention in sales; on sales promotion, and on niche positioning in the market.
In addition to price and item promotional announcements, NALB Creative Center will focus its marketing efforts via several key direct-to-consumer advertising vehicles:
Local and Regional Magazine Publications: (West Hawaii Today, Hilo Tribune-Herald, Hawai’i Island Journal). Each of these papers provide a demographic base that lines up nicely with that of NALB’s.
Direct Mail Postcards: NALB will look to increase consumer awareness, retain the existing customer base and promote increased sales via postcard mailings. These mailings will be targeted around special events, and are intended to liquidate slow moving products or showcase vendor negotiated specials.
- Spring Open House–15% to 20% savings opportunity.
- Fall Open House–15% to 20% savings opportunity.
- Holiday Open House–15% to 20% savings opportunity.
- Annual Anniversary Postcard–promotes in-store design seminars, special events and savings opportunities.
Website Marketing: As we establish our on-line education and gallery segment, we will support the business via search engine marketing, URL links and e-mail marketing on all correspondence. This third channel of business will increase the customer base, sales potential and service opportunities provided by NALB.
-
Direct Calls on professional artists, architects and designers.
-
Word of mouth. By giving first-time customers great service and a fair price, the word is sure to spread.
-
In-store events and celebrations.
All marketing decisions with regard to specific media choices, frequency, size, and expenditures will be analyzed on an on-going basis with careful consideration of returns generated and consistency with our mission and vision.
5.3 Sales Strategy
NALB Creative Center will approach sales from a relationship basis. We will assist customers in a personal manner, using personal names and displaying our names on badges. We will ask the questions needed to provide the customers with the services they desire. Gathering key customer information and seeking performance feedback on the products and services offered will assist us in the following ways:
- Targeting our marketing efforts most effectively.
- Developing product offers and merchandising formats that increase sales.
- Developing services and perks that enhance the shopping experience.
- Increasing awareness of NCC within the retail consumer marketplace.
- Developing future sales opportunities that allow for continued growth of the business.
Key to the sales strategy is direct sales calls on all market segments targeted in this plan. These sales calls need to be made by the owners, by virtue of their background and knowledge of the customers, products and competitors. Experience has proven that the more time we devote to sales, the more sales result. A full-time team member needs to be found and added as soon as possible. Without this person, too much of the owner’s time is deflected away from their major tasks.
We will utilize the POS software with every sales transaction. With each purchase the software will record and maintain in its database the customer’s name, address and purchases. This information will be used with our direct mailing program to focus on our top 50% of customers. This will also make inventory control easier and more effective.
We will offer the best return/exchange policy possible, to build trust with our customers and maintain retention and loyalty. At least 50% of returns will be sent back to the distributor or vendor.
For in-store sales, our strategy will be to maintain as much on-site point-of-purchase literature as is physically possible. We will remember that selling art and craft supplies is about educating and filling a need, not pressuring the customer to buy.
Most importantly, we need to sell our company, not necessarily the products. We will need to push our service, education, and support capabilities. This will be done through relating with customers, drawing out creative dreams and aspirations, stretching customers into new creative arenas, and so forth.
5.3.1 Sales Forecast
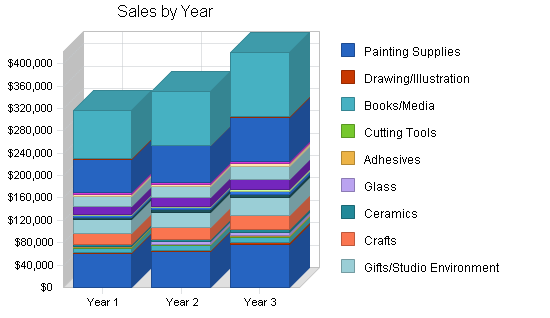
The following table and chart highlight forecasted sales. We expect sales to start off conservatively and increase extensively during the holiday season and during the months of July and August as the education systems start their new year.
NALB has planned for a rate of growth at 5% for the first year as we build name recognition and status in the community. In the second year we project a growth rate of 10%. In the third year we look to see an increase of revenue of 20% as we gain a larger percentage of the market share and increase our customer base beyond the Kona area.

| Sales Forecast | |||
| Year 1 | Year 2 | Year 3 | |
| Sales | |||
| Painting Supplies | $60,000 | $64,200 | $77,040 |
| Drawing/Illustration | $2,600 | $2,782 | $3,338 |
| Books/Media | $7,000 | $7,490 | $8,988 |
| Cutting Tools | $1,400 | $1,498 | $1,798 |
| Adhesives | $1,400 | $1,540 | $1,848 |
| Glass | $750 | $4,000 | $5,000 |
| Ceramics | $3,800 | $4,180 | $5,016 |
| Crafts | $19,000 | $20,900 | $25,080 |
| Gifts/Studio Environment | $25,000 | $27,500 | $33,000 |
| Print Making | $4,300 | $4,730 | $5,676 |
| Sculpture | $3,100 | $3,410 | $4,092 |
| Portfolios/Transporting | $2,800 | $3,080 | $3,696 |
| Gallery Sales | $14,000 | $15,400 | $18,480 |
| Fabrics/Yarn | $18,000 | $19,800 | $23,760 |
| Equipment | $3,600 | $3,960 | $4,752 |
| Clothing/Accessories | $2,600 | $2,860 | $3,432 |
| Paper/Boards | $60,000 | $66,000 | $79,200 |
| Classes | $1,050 | $1,155 | $1,386 |
| Canvas/Surfaces | $86,400 | $95,040 | $114,048 |
| Total Sales | $316,800 | $349,525 | $419,630 |
| Direct Cost of Sales | Year 1 | Year 2 | Year 3 |
| Inventory | $158,400 | $174,763 | $209,815 |
| Other | $0 | $0 | $0 |
| Subtotal Direct Cost of Sales | $158,400 | $174,763 | $209,815 |
5.4 Milestones
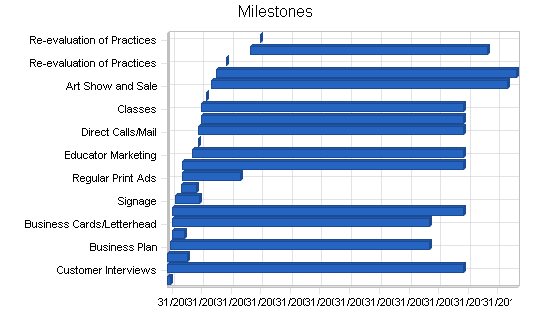
The accompanying milestone chart highlights our plan with specific dates. This schedule reflects our strong committment to organization and detail. During the 6-month and 12-month evaluation period, we will complete a detailed evaluation of all aspects of the business:
- Financials/Bottom Line
- Sales
- Customer satisfaction
- Goals for next period
We will have in place a “Plan-B,” for implementation, should the evaluation show that it is ill-advised to continue the current endeavor. Product diversification, location, advertising, new markets, will be considered if NALB needs to be more liquid.
| Milestones | |||||
| Milestone | Start Date | End Date | Budget | Manager | Department |
| Corporate Identity | 1/3/2005 | 1/18/2005 | $100 | CG | Department |
| Customer Interviews | 1/3/2005 | 1/3/2010 | $0 | CG/VB | Department |
| Site Improvements and Design | 1/3/2005 | 5/5/2005 | $0 | CG/VB | Department |
| Business Plan | 1/20/2005 | 6/6/2009 | $50 | VB | Department |
| Website Development | 2/1/2005 | 4/18/2005 | $50 | CG | Department |
| Business Cards/Letterhead | 2/1/2005 | 6/6/2009 | $300 | CG | Department |
| Yellow Pages Ads | 2/1/2005 | 1/3/2010 | $200 | CG/VB | Department |
| Signage | 2/18/2005 | 7/18/2005 | $2,000 | CG/VB | Department |
| Print Ad. “Ticklers” | 4/1/2005 | 6/30/2005 | $600 | CG/VB | Department |
| Regular Print Ads | 4/5/2005 | 3/30/2006 | $3,000 | CG/VB | Department |
| Radio Advertising | 4/5/2005 | 1/3/2010 | $1,000 | CG/VB | Department |
| Educator Marketing | 6/5/2005 | 1/3/2010 | $150 | CG/VB | Department |
| Grand Opening | 7/10/2005 | 7/10/2005 | $500 | CG/VB | Department |
| Direct Calls/Mail | 7/15/2005 | 1/3/2010 | $250 | CG | Department |
| Promotional Events | 8/1/2005 | 1/3/2010 | $500 | CG/VB | Department |
| Classes | 8/1/2005 | 1/3/2010 | $0 | CG/VB | Department |
| Follow-up Surveys | 9/1/2005 | 9/1/2005 | $0 | CG/VB | Department |
| Art Show and Sale | 10/1/2005 | 10/1/2010 | $0 | CG/VB | Department |
| Music Jam Sessions | 11/1/2005 | 11/25/2010 | $0 | CG/VB | Department |
| Re-evaluation of Practices | 12/30/2005 | 12/30/2005 | $0 | CG/VB | Department |
| Artist Oasis Web Tours | 6/1/2006 | 6/1/2010 | $0 | CG/VB | Department |
| Re-evaluation of Practices | 7/30/2006 | 7/30/2006 | $0 | CG/VB | Department |
| Totals | $8,700 | ||||
Web Plan Summary
NALB’s Web presence will be informational and educational with a contact form for requesting additional information. Our URL will be on all print items coming from the store (advertising, sales promotion sheets, letterhead).
- Customers will be able to search our inventory and place orders.
- Customers will be able to access a calendar of educational opportunities, and sign up on line.
- Customers will be able to use the website as a portal for art related research: technical, historical and local.
- Customers will be able to view and print coupons.
- Off-island customers will be able to read about our tour packages, and request additional information.
- Customers will be able to view our on-line art gallery.
6.1 Website Marketing Strategy
We will direct customers to our website in the following ways:
- Direct e-mail through addresses given to us voluntarily.
- Printing on everything that comes from the store (letterhead, business cards, direct mail, shopping bags and wrapping paper, promotional items, print advertising).
- Links from local business pages and Hawaii Tourism portals.
- Links from/to national art resource pages.
- Advertising on all company vehicles.
6.2 Development Requirements
Our parent company website is already in place. Through NALB Design, we have trained staff, domain names, and software in place to build a web presence for NALB Creative Center at nominal cost.
Management Summary
NALB Creative Center is managed by the owners/founders.
- We will open with the two owners operating the store.
- As our business expands, we will hire additional employees, our projections include six employees, with the owners managing the store and cold-call selling.
- Employees will be encouraged to work within their creative, physical, and intellectual boundaries.
- All duties will be divided and delegated according to strengths and weaknesses.
- At NALB we will expect a high degree of customer service skills and personality as this is essential to our success.
7.1 Personnel Plan
NCC will be operated in the first few years by the owners. Additional part-time help will be provided by family members.
As NALB grows over the next years, we will need two additional full-time sales clerks, and two part-time clerks. This will free the owners to concentrate on building the business, and expanding into the other areas of NALB’s vision (tours, competitions, music, gallery, special events, etc.).
| Personnel Plan | |||
| Year 1 | Year 2 | Year 3 | |
| Owners | $66,000 | $68,000 | $71,400 |
| Other | $0 | $0 | $0 |
| Other | $0 | $0 | $0 |
| Total People | 3 | 3 | 3 |
| Total Payroll | $66,000 | $68,000 | $71,400 |
Financial Plan
- The growth of NALB will be moderate and the cash balance will always be positive.
- Being a retail environment we will not be selling on credit. We will accept cash, checks, Visa and MasterCard.
- Marketing and advertising will remain at or below 5% of sales.
- We will finance growth mainly through cash flow. We recognize that this means we will have to grow slowly.
- It should be noted that the owners of NALB Creative Center do not intend to take any profits out of the business until the long-term debt has been satisfied. Whatever profits remain after the debt payments will be used to finance growth, mainly through the acquisition of additional inventory.
8.1 Start-up Funding
NALB’s start-up funds are summarized in the following table:
- $210,000 SBA loan
- $20,000 short-term/credit card
- $45,000 Owner investment
The additional capital is needed to fund salaries, inventory lags and other costs during the first months of the business year.
| Start-up Funding | |
| Start-up Expenses to Fund | $27,950 |
| Start-up Assets to Fund | $216,000 |
| Total Funding Required | $243,950 |
| Assets | |
| Non-cash Assets from Start-up | $196,000 |
| Cash Requirements from Start-up | $20,000 |
| Additional Cash Raised | $11,050 |
| Cash Balance on Starting Date | $31,050 |
| Total Assets | $227,050 |
| Liabilities and Capital | |
| Liabilities | |
| Current Borrowing | $0 |
| Long-term Liabilities | $210,000 |
| Accounts Payable (Outstanding Bills) | $0 |
| Other Current Liabilities (interest-free) | $0 |
| Total Liabilities | $210,000 |
| Capital | |
| Planned Investment | |
| Owner | $45,000 |
| Investor | $0 |
| Additional Investment Requirement | $0 |
| Total Planned Investment | $45,000 |
| Loss at Start-up (Start-up Expenses) | ($27,950) |
| Total Capital | $17,050 |
| Total Capital and Liabilities | $227,050 |
| Total Funding | $255,000 |
8.2 Important Assumptions
The financial plan depends on important assumptions, most of which are shown in the following table. The key underlying assumptions are:
- We do not sell anything on credit. We accept cash, checks, debit cards, Visa, MasterCard.
- A slow-growth economy/customer base, without major recession.
- Monthly sales are the largest indicator for this business. There are some seasonal variations, with the months October through January being the highest sales months.
- We assume access to capital and financing sufficient to maintain our financial plan as shown in the tables.
8.3 Break-even Analysis
Our break-even analysis is summarized by the following chart and table.

| Break-even Analysis | |
| Monthly Revenue Break-even | $21,000 |
| Assumptions: | |
| Average Percent Variable Cost | 50% |
| Estimated Monthly Fixed Cost | $10,500 |
8.4 Projected Profit and Loss
We predict that during the second year of operation, our high level of customer service and strong assortment will allow us to generate approximately 5% profit. This will be above the normal two to three year period required for a start-up retailer. Our sales projections are conservative. Should sales increase as we anticipate, the profit-to-sales ratio could be as high as 10% by the end of year three.
The following chart and table will indicate projected profit and loss.


| Pro Forma Profit and Loss | |||
| Year 1 | Year 2 | Year 3 | |
| Sales | $316,800 | $349,525 | $419,630 |
| Direct Cost of Sales | $158,400 | $174,763 | $209,815 |
| Other Costs of Sales | $0 | $0 | $0 |
| Total Cost of Sales | $158,400 | $174,763 | $209,815 |
| Gross Margin | $158,400 | $174,763 | $209,815 |
| Gross Margin % | 50.00% | 50.00% | 50.00% |
| Expenses | |||
| Payroll | $66,000 | $68,000 | $71,400 |
| Marketing/Promotion | $2,400 | $2,520 | $2,646 |
| Depreciation | $0 | $0 | $0 |
| Rent | $42,000 | $12,600 | $7,056 |
| Utilities | $12,000 | $6,720 | $7,056 |
| Insurance | $3,600 | $3,780 | $3,969 |
| Payroll Taxes | $0 | $0 | $0 |
| Other | $0 | $0 | $0 |
| Total Operating Expenses | $126,000 | $93,620 | $92,127 |
| Profit Before Interest and Taxes | $32,400 | $81,143 | $117,688 |
| EBITDA | $32,400 | $81,143 | $117,688 |
| Interest Expense | $11,747 | $10,238 | $8,663 |
| Taxes Incurred | $6,196 | $21,272 | $32,708 |
| Net Profit | $14,457 | $49,634 | $76,318 |
| Net Profit/Sales | 4.56% | 14.20% | 18.19% |
8.5 Projected Cash Flow
Our projected cash flow is outlined in the following chart and table.

| Pro Forma Cash Flow | |||
| Year 1 | Year 2 | Year 3 | |
| Cash Received | |||
| Cash from Operations | |||
| Cash Sales | $316,800 | $349,525 | $419,630 |
| Subtotal Cash from Operations | $316,800 | $349,525 | $419,630 |
| Additional Cash Received | |||
| Sales Tax, VAT, HST/GST Received | $0 | $0 | $0 |
| New Current Borrowing | $0 | $0 | $0 |
| New Other Liabilities (interest-free) | $0 | $0 | $0 |
| New Long-term Liabilities | $0 | $0 | $0 |
| Sales of Other Current Assets | $0 | $0 | $0 |
| Sales of Long-term Assets | $0 | $0 | $0 |
| New Investment Received | $0 | $0 | $0 |
| Subtotal Cash Received | $316,800 | $349,525 | $419,630 |
| Expenditures | Year 1 | Year 2 | Year 3 |
| Expenditures from Operations | |||
| Cash Spending | $66,000 | $68,000 | $71,400 |
| Bill Payments | $217,354 | $244,145 | $296,130 |
| Subtotal Spent on Operations | $283,354 | $312,145 | $367,530 |
| Additional Cash Spent | |||
| Sales Tax, VAT, HST/GST Paid Out | $0 | $0 | $0 |
| Principal Repayment of Current Borrowing | $0 | $0 | $0 |
| Other Liabilities Principal Repayment | $0 | $0 | $0 |
| Long-term Liabilities Principal Repayment | $26,250 | $26,250 | $26,250 |
| Purchase Other Current Assets | $0 | $0 | $0 |
| Purchase Long-term Assets | $0 | $0 | $0 |
| Dividends | $0 | $0 | $0 |
| Subtotal Cash Spent | $309,604 | $338,395 | $393,780 |
| Net Cash Flow | $7,196 | $11,130 | $25,850 |
| Cash Balance | $38,246 | $49,375 | $75,225 |
8.6 Projected Balance Sheet
The table shows the annual balance sheet results, with a conservative projected increase in net worth. Detailed monthly projections are in the appendix.
| Pro Forma Balance Sheet | |||
| Year 1 | Year 2 | Year 3 | |
| Assets | |||
| Current Assets | |||
| Cash | $38,246 | $49,375 | $75,225 |
| Inventory | $130,000 | $143,429 | $172,197 |
| Other Current Assets | $26,000 | $26,000 | $26,000 |
| Total Current Assets | $194,246 | $218,804 | $273,422 |
| Long-term Assets | |||
| Long-term Assets | $40,000 | $40,000 | $40,000 |
| Accumulated Depreciation | $0 | $0 | $0 |
| Total Long-term Assets | $40,000 | $40,000 | $40,000 |
| Total Assets | $234,246 | $258,804 | $313,422 |
| Liabilities and Capital | Year 1 | Year 2 | Year 3 |
| Current Liabilities | |||
| Accounts Payable | $18,988 | $20,163 | $24,713 |
| Current Borrowing | $0 | $0 | $0 |
| Other Current Liabilities | $0 | $0 | $0 |
| Subtotal Current Liabilities | $18,988 | $20,163 | $24,713 |
| Long-term Liabilities | $183,750 | $157,500 | $131,250 |
| Total Liabilities | $202,738 | $177,663 | $155,963 |
| Paid-in Capital | $45,000 | $45,000 | $45,000 |
| Retained Earnings | ($27,950) | ($13,493) | $36,141 |
| Earnings | $14,457 | $49,634 | $76,318 |
| Total Capital | $31,507 | $81,141 | $157,459 |
| Total Liabilities and Capital | $234,246 | $258,804 | $313,422 |
| Net Worth | $31,507 | $81,141 | $157,459 |
8.7 Business Ratios
Business ratios for the years of this plan are shown below. The industry profile is from 2003, and based on the Standard Industrial Classification (SIC) code 5092.9901 for the Arts and crafts equipment and supplies industry.
| Ratio Analysis | ||||
| Year 1 | Year 2 | Year 3 | Industry Profile | |
| Sales Growth | 0.00% | 10.33% | 20.06% | 2.44% |
| Percent of Total Assets | ||||
| Inventory | 55.50% | 55.42% | 54.94% | 28.77% |
| Other Current Assets | 11.10% | 10.05% | 8.30% | 26.58% |
| Total Current Assets | 82.92% | 84.54% | 87.24% | 87.58% |
| Long-term Assets | 17.08% | 15.46% | 12.76% | 12.42% |
| Total Assets | 100.00% | 100.00% | 100.00% | 100.00% |
| Current Liabilities | 8.11% | 7.79% | 7.89% | 41.17% |
| Long-term Liabilities | 78.44% | 60.86% | 41.88% | 9.71% |
| Total Liabilities | 86.55% | 68.65% | 49.76% | 50.88% |
| Net Worth | 13.45% | 31.35% | 50.24% | 49.12% |
| Percent of Sales | ||||
| Sales | 100.00% | 100.00% | 100.00% | 100.00% |
| Gross Margin | 50.00% | 50.00% | 50.00% | 30.58% |
| Selling, General & Administrative Expenses | 45.44% | 35.80% | 31.81% | 16.83% |
| Advertising Expenses | 0.00% | 0.00% | 0.00% | 1.21% |
| Profit Before Interest and Taxes | 10.23% | 23.22% | 28.05% | 1.02% |
| Main Ratios | ||||
| Current | 10.23 | 10.85 | 11.06 | 1.84 |
| Quick | 3.38 | 3.74 | 4.10 | 1.00 |
| Total Debt to Total Assets | 86.55% | 68.65% | 49.76% | 55.33% |
| Pre-tax Return on Net Worth | 65.55% | 87.39% | 69.24% | 2.27% |
| Pre-tax Return on Assets | 8.82% | 27.40% | 34.79% | 5.08% |
| Additional Ratios | Year 1 | Year 2 | Year 3 | |
| Net Profit Margin | 4.56% | 14.20% | 18.19% | n.a |
| Return on Equity | 45.89% | 61.17% | 48.47% | n.a |
| Activity Ratios | ||||
| Inventory Turnover | 1.20 | 1.28 | 1.33 | n.a |
| Accounts Payable Turnover | 12.45 | 12.17 | 12.17 | n.a |
| Payment Days | 27 | 29 | 27 | n.a |
| Total Asset Turnover | 1.35 | 1.35 | 1.34 | n.a |
| Debt Ratios | ||||
| Debt to Net Worth | 6.43 | 2.19 | 0.99 | n.a |
| Current Liab. to Liab. | 0.09 | 0.11 | 0.16 | n.a |
| Liquidity Ratios | ||||
| Net Working Capital | $175,257 | $198,641 | $248,709 | n.a |
| Interest Coverage | 2.76 | 7.93 | 13.59 | n.a |
| Additional Ratios | ||||
| Assets to Sales | 0.74 | 0.74 | 0.75 | n.a |
| Current Debt/Total Assets | 8% | 8% | 8% | n.a |
| Acid Test | 3.38 | 3.74 | 4.10 | n.a |
| Sales/Net Worth | 10.05 | 4.31 | 2.67 | n.a |
| Dividend Payout | 0.00 | 0.00 | 0.00 | n.a |
Appendix
| Sales Forecast | |||||||||||||
| Month 1 | Month 2 | Month 3 | Month 4 | Month 5 | Month 6 | Month 7 | Month 8 | Month 9 | Month 10 | Month 11 | Month 12 | ||
| Sales | |||||||||||||
| Painting Supplies | 0% | $5,000 | $5,000 | $5,000 | $5,000 | $5,000 | $5,000 | $5,000 | $5,000 | $5,000 | $5,000 | $5,000 | $5,000 |
| Drawing/Illustration | 0% | $200 | $200 | $200 | $200 | $300 | $300 | $200 | $200 | $200 | $200 | $200 | $200 |
| Books/Media | 0% | $500 | $500 | $500 | $500 | $1,000 | $1,000 | $500 | $500 | $500 | $500 | $500 | $500 |
| Cutting Tools | 0% | $100 | $100 | $100 | $100 | $200 | $200 | $100 | $100 | $100 | $100 | $100 | $100 |
| Adhesives | 0% | $100 | $100 | $100 | $100 | $200 | $200 | $100 | $100 | $100 | $100 | $100 | $100 |
| Glass | 0% | $0 | $0 | $0 | $0 | $0 | $0 | $0 | $100 | $150 | $150 | $150 | $200 |
| Ceramics | 0% | $300 | $300 | $300 | $300 | $400 | $400 | $300 | $300 | $300 | $300 | $300 | $300 |
| Crafts | 0% | $1,500 | $1,500 | $1,500 | $1,500 | $2,000 | $2,000 | $1,500 | $1,500 | $1,500 | $1,500 | $1,500 | $1,500 |
| Gifts/Studio Environment | 0% | $2,000 | $2,000 | $2,000 | $2,000 | $2,500 | $2,500 | $2,000 | $2,000 | $2,000 | $2,000 | $2,000 | $2,000 |
| Print Making | 0% | $350 | $350 | $350 | $350 | $400 | $400 | $350 | $350 | $350 | $350 | $350 | $350 |
| Sculpture | 0% | $250 | $250 | $250 | $250 | $300 | $300 | $250 | $250 | $250 | $250 | $250 | $250 |
| Portfolios/Transporting | 0% | $200 | $200 | $200 | $200 | $400 | $400 | $200 | $200 | $200 | $200 | $200 | $200 |
| Gallery Sales | 0% | $1,000 | $1,000 | $1,000 | $1,000 | $2,000 | $2,000 | $1,000 | $1,000 | $1,000 | $1,000 | $1,000 | $1,000 |
| Fabrics/Yarn | 0% | $1,500 | $1,500 | $1,500 | $1,500 | $1,500 | $1,500 | $1,500 | $1,500 | $1,500 | $1,500 | $1,500 | $1,500 |
| Equipment | 0% | $300 | $300 | $300 | $300 | $300 | $300 | $300 | $300 | $300 | $300 | $300 | $300 |
| Clothing/Accessories | 0% | $200 | $200 | $200 | $200 | $300 | $300 | $200 | $200 | $200 | $200 | $200 | $200 |
| Paper/Boards | 0% | $5,000 | $5,000 | $5,000 | $5,000 | $5,000 | $5,000 | $5,000 | $5,000 | $5,000 | $5,000 | $5,000 | $5,000 |
| Classes | 0% | $0 | $50 | $100 | $100 | $100 | $100 | $100 | $100 | $100 | $100 | $100 | $100 |
| Canvas/Surfaces | 0% | $7,200 | $7,200 | $7,200 | $7,200 | $7,200 | $7,200 | $7,200 | $7,200 | $7,200 | $7,200 | $7,200 | $7,200 |
| Total Sales | $25,700 | $25,750 | $25,800 | $25,800 | $29,100 | $29,100 | $25,800 | $25,900 | $25,950 | $25,950 | $25,950 | $26,000 | |
| Direct Cost of Sales | Month 1 | Month 2 | Month 3 | Month 4 | Month 5 | Month 6 | Month 7 | Month 8 | Month 9 | Month 10 | Month 11 | Month 12 | |
| Inventory | 50% | $12,850 | $12,875 | $12,900 | $12,900 | $14,550 | $14,550 | $12,900 | $12,950 | $12,975 | $12,975 | $12,975 | $13,000 |
| Other | $0 | $0 | $0 | $0 | $0 | $0 | $0 | $0 | $0 | $0 | $0 | $0 | |
| Subtotal Direct Cost of Sales | $12,850 | $12,875 | $12,900 | $12,900 | $14,550 | $14,550 | $12,900 | $12,950 | $12,975 | $12,975 | $12,975 | $13,000 | |
| Personnel Plan | |||||||||||||
| Month 1 | Month 2 | Month 3 | Month 4 | Month 5 | Month 6 | Month 7 | Month 8 | Month 9 | Month 10 | Month 11 | Month 12 | ||
| Owners | 5% | $5,500 | $5,500 | $5,500 | $5,500 | $5,500 | $5,500 | $5,500 | $5,500 | $5,500 | $5,500 | $5,500 | $5,500 |
| Other | 5% | $0 | $0 | $0 | $0 | $0 | $0 | $0 | $0 | $0 | $0 | $0 | $0 |
| Other | 5% | $0 | $0 | $0 | $0 | $0 | $0 | $0 | $0 | $0 | $0 | $0 | $0 |
| Total People | 2 | 2 | 2 | 2 | 4 | 3 | 3 | 3 | 3 | 3 | 3 | 3 | |
| Total Payroll | $5,500 | $5,500 | $5,500 | $5,500 | $5,500 | $5,500 | $5,500 | $5,500 | $5,500 | $5,500 | $5,500 | $5,500 | |
| Pro Forma Profit and Loss | |||||||||||||
| Month 1 | Month 2 | Month 3 | Month 4 | Month 5 | Month 6 | Month 7 | Month 8 | Month 9 | Month 10 | Month 11 | Month 12 | ||
| Sales | $25,700 | $25,750 | $25,800 | $25,800 | $29,100 | $29,100 | $25,800 | $25,900 | $25,950 | $25,950 | $25,950 | $26,000 | |
| Direct Cost of Sales | $12,850 | $12,875 | $12,900 | $12,900 | $14,550 | $14,550 | $12,900 | $12,950 | $12,975 | $12,975 | $12,975 | $13,000 | |
| Other Costs of Sales | $0 | $0 | $0 | $0 | $0 | $0 | $0 | $0 | $0 | $0 | $0 | $0 | |
| Total Cost of Sales | $12,850 | $12,875 | $12,900 | $12,900 | $14,550 | $14,550 | $12,900 | $12,950 | $12,975 | $12,975 | $12,975 | $13,000 | |
| Gross Margin | $12,850 | $12,875 | $12,900 | $12,900 | $14,550 | $14,550 | $12,900 | $12,950 | $12,975 | $12,975 | $12,975 | $13,000 | |
| Gross Margin % | 50.00% | 50.00% | 50.00% | 50.00% | 50.00% | 50.00% | 50.00% | 50.00% | 50.00% | 50.00% | 50.00% | 50.00% | |
| Expenses | |||||||||||||
| Payroll | $5,500 | $5,500 | $5,500 | $5,500 | $5,500 | $5,500 | $5,500 | $5,500 | $5,500 | $5,500 | $5,500 | $5,500 | |
| Marketing/Promotion | $200 | $200 | $200 | $200 | $200 | $200 | $200 | $200 | $200 | $200 | $200 | $200 | |
| Depreciation | $0 | $0 | $0 | $0 | $0 | $0 | $0 | $0 | $0 | $0 | $0 | $0 | |
| Rent | $3,500 | $3,500 | $3,500 | $3,500 | $3,500 | $3,500 | $3,500 | $3,500 | $3,500 | $3,500 | $3,500 | $3,500 | |
| Utilities | $1,000 | $1,000 | $1,000 | $1,000 | $1,000 | $1,000 | $1,000 | $1,000 | $1,000 | $1,000 | $1,000 | $1,000 | |
| Insurance | $300 | $300 | $300 | $300 | $300 | $300 | $300 | $300 | $300 | $300 | $300 | $300 | |
| Payroll Taxes | 15% | $0 | $0 | $0 | $0 | $0 | $0 | $0 | $0 | $0 | $0 | $0 | $0 |
| Other | $0 | $0 | $0 | $0 | $0 | $0 | $0 | $0 | $0 | $0 | $0 | $0 | |
| Total Operating Expenses | $10,500 | $10,500 | $10,500 | $10,500 | $10,500 | $10,500 | $10,500 | $10,500 | $10,500 | $10,500 | $10,500 | $10,500 | |
| Profit Before Interest and Taxes | $2,350 | $2,375 | $2,400 | $2,400 | $4,050 | $4,050 | $2,400 | $2,450 | $2,475 | $2,475 | $2,475 | $2,500 | |
| EBITDA | $2,350 | $2,375 | $2,400 | $2,400 | $4,050 | $4,050 | $2,400 | $2,450 | $2,475 | $2,475 | $2,475 | $2,500 | |
| Interest Expense | $1,039 | $1,028 | $1,017 | $1,006 | $995 | $984 | $973 | $963 | $952 | $941 | $930 | $919 | |
| Taxes Incurred | $393 | $404 | $415 | $418 | $916 | $920 | $428 | $446 | $457 | $460 | $464 | $474 | |
| Net Profit | $918 | $943 | $968 | $976 | $2,138 | $2,146 | $999 | $1,041 | $1,066 | $1,074 | $1,082 | $1,107 | |
| Net Profit/Sales | 3.57% | 3.66% | 3.75% | 3.78% | 7.35% | 7.37% | 3.87% | 4.02% | 4.11% | 4.14% | 4.17% | 4.26% | |
| Pro Forma Cash Flow | |||||||||||||
| Month 1 | Month 2 | Month 3 | Month 4 | Month 5 | Month 6 | Month 7 | Month 8 | Month 9 | Month 10 | Month 11 | Month 12 | ||
| Cash Received | |||||||||||||
| Cash from Operations | |||||||||||||
| Cash Sales | $25,700 | $25,750 | $25,800 | $25,800 | $29,100 | $29,100 | $25,800 | $25,900 | $25,950 | $25,950 | $25,950 | $26,000 | |
| Subtotal Cash from Operations | $25,700 | $25,750 | $25,800 | $25,800 | $29,100 | $29,100 | $25,800 | $25,900 | $25,950 | $25,950 | $25,950 | $26,000 | |
| Additional Cash Received | |||||||||||||
| Sales Tax, VAT, HST/GST Received | 0.00% | $0 | $0 | $0 | $0 | $0 | $0 | $0 | $0 | $0 | $0 | $0 | $0 |
| New Current Borrowing | $0 | $0 | $0 | $0 | $0 | $0 | $0 | $0 | $0 | $0 | $0 | $0 | |
| New Other Liabilities (interest-free) | $0 | $0 | $0 | $0 | $0 | $0 | $0 | $0 | $0 | $0 | $0 | $0 | |
| New Long-term Liabilities | $0 | $0 | $0 | $0 | $0 | $0 | $0 | $0 | $0 | $0 | $0 | $0 | |
| Sales of Other Current Assets | $0 | $0 | $0 | $0 | $0 | $0 | $0 | $0 | $0 | $0 | $0 | $0 | |
| Sales of Long-term Assets | $0 | $0 | $0 | $0 | $0 | $0 | $0 | $0 | $0 | $0 | $0 | $0 | |
| New Investment Received | $0 | $0 | $0 | $0 | $0 | $0 | $0 | $0 | $0 | $0 | $0 | $0 | |
| Subtotal Cash Received | $25,700 | $25,750 | $25,800 | $25,800 | $29,100 | $29,100 | $25,800 | $25,900 | $25,950 | $25,950 | $25,950 | $26,000 | |
| Expenditures | Month 1 | Month 2 | Month 3 | Month 4 | Month 5 | Month 6 | Month 7 | Month 8 | Month 9 | Month 10 | Month 11 | Month 12 | |
| Expenditures from Operations | |||||||||||||
| Cash Spending | $5,500 | $5,500 | $5,500 | $5,500 | $5,500 | $5,500 | $5,500 | $5,500 | $5,500 | $5,500 | $5,500 | $5,500 | |
| Bill Payments | $593 | $17,842 | $19,558 | $19,573 | $19,946 | $37,411 | $20,952 | $6,730 | $16,371 | $19,625 | $19,376 | $19,377 | |
| Subtotal Spent on Operations | $6,093 | $23,342 | $25,058 | $25,073 | $25,446 | $42,911 | $26,452 | $12,230 | $21,871 | $25,125 | $24,876 | $24,877 | |
| Additional Cash Spent | |||||||||||||
| Sales Tax, VAT, HST/GST Paid Out | $0 | $0 | $0 | $0 | $0 | $0 | $0 | $0 | $0 | $0 | $0 | $0 | |
| Principal Repayment of Current Borrowing | $0 | $0 | $0 | $0 | $0 | $0 | $0 | $0 | $0 | $0 | $0 | $0 | |
| Other Liabilities Principal Repayment | $0 | $0 | $0 | $0 | $0 | $0 | $0 | $0 | $0 | $0 | $0 | $0 | |
| Long-term Liabilities Principal Repayment | $2,188 | $2,188 | $2,188 | $2,188 | $2,188 | $2,188 | $2,188 | $2,188 | $2,188 | $2,188 | $2,188 | $2,188 | |
| Purchase Other Current Assets | $0 | $0 | $0 | $0 | $0 | $0 | $0 | $0 | $0 | $0 | $0 | $0 | |
| Purchase Long-term Assets | $0 | $0 | $0 | $0 | $0 | $0 | $0 | $0 | $0 | $0 | $0 | $0 | |
| Dividends | $0 | $0 | $0 | $0 | $0 | $0 | $0 | $0 | $0 | $0 | $0 | $0 | |
| Subtotal Cash Spent | $8,280 | $25,529 | $27,246 | $27,261 | $27,633 | $45,099 | $28,640 | $14,417 | $24,059 | $27,313 | $27,063 | $27,065 | |
| Net Cash Flow | $17,420 | $221 | ($1,446) | ($1,461) | $1,467 | ($15,999) | ($2,840) | $11,483 | $1,891 | ($1,363) | ($1,113) | ($1,065) | |
| Cash Balance | $48,470 | $48,691 | $47,245 | $45,784 | $47,251 | $31,252 | $28,412 | $39,895 | $41,786 | $40,424 | $39,310 | $38,246 | |
| Pro Forma Balance Sheet | |||||||||||||
| Month 1 | Month 2 | Month 3 | Month 4 | Month 5 | Month 6 | Month 7 | Month 8 | Month 9 | Month 10 | Month 11 | Month 12 | ||
| Assets | Starting Balances | ||||||||||||
| Current Assets | |||||||||||||
| Cash | $31,050 | $48,470 | $48,691 | $47,245 | $45,784 | $47,251 | $31,252 | $28,412 | $39,895 | $41,786 | $40,424 | $39,310 | $38,246 |
| Inventory | $130,000 | $128,500 | $128,750 | $129,000 | $129,000 | $145,500 | $145,500 | $132,600 | $129,500 | $129,750 | $129,750 | $129,750 | $130,000 |
| Other Current Assets | $26,000 | $26,000 | $26,000 | $26,000 | $26,000 | $26,000 | $26,000 | $26,000 | $26,000 | $26,000 | $26,000 | $26,000 | $26,000 |
| Total Current Assets | $187,050 | $202,970 | $203,441 | $202,245 | $200,784 | $218,751 | $202,752 | $187,012 | $195,395 | $197,536 | $196,174 | $195,060 | $194,246 |
| Long-term Assets | |||||||||||||
| Long-term Assets | $40,000 | $40,000 | $40,000 | $40,000 | $40,000 | $40,000 | $40,000 | $40,000 | $40,000 | $40,000 | $40,000 | $40,000 | $40,000 |
| Accumulated Depreciation | $0 | $0 | $0 | $0 | $0 | $0 | $0 | $0 | $0 | $0 | $0 | $0 | $0 |
| Total Long-term Assets | $40,000 | $40,000 | $40,000 | $40,000 | $40,000 | $40,000 | $40,000 | $40,000 | $40,000 | $40,000 | $40,000 | $40,000 | $40,000 |
| Total Assets | $227,050 | $242,970 | $243,441 | $242,245 | $240,784 | $258,751 | $242,752 | $227,012 | $235,395 | $237,536 | $236,174 | $235,060 | $234,246 |
| Liabilities and Capital | Month 1 | Month 2 | Month 3 | Month 4 | Month 5 | Month 6 | Month 7 | Month 8 | Month 9 | Month 10 | Month 11 | Month 12 | |
| Current Liabilities | |||||||||||||
| Accounts Payable | $0 | $17,190 | $18,905 | $18,929 | $18,680 | $36,696 | $20,739 | $6,188 | $15,717 | $18,979 | $18,730 | $18,723 | $18,988 |
| Current Borrowing | $0 | $0 | $0 | $0 | $0 | $0 | $0 | $0 | $0 | $0 | $0 | $0 | $0 |
| Other Current Liabilities | $0 | $0 | $0 | $0 | $0 | $0 | $0 | $0 | $0 | $0 | $0 | $0 | $0 |
| Subtotal Current Liabilities | $0 | $17,190 | $18,905 | $18,929 | $18,680 | $36,696 | $20,739 | $6,188 | $15,717 | $18,979 | $18,730 | $18,723 | $18,988 |
| Long-term Liabilities | $210,000 | $207,813 | $205,625 | $203,438 | $201,250 | $199,063 | $196,875 | $194,688 | $192,500 | $190,313 | $188,125 | $185,938 | $183,750 |
| Total Liabilities | $210,000 | $225,002 | $224,530 | $222,367 | $219,930 | $235,759 | $217,614 | $200,876 | $208,217 | $209,292 | $206,855 | $204,660 | $202,738 |
| Paid-in Capital | $45,000 | $45,000 | $45,000 | $45,000 | $45,000 | $45,000 | $45,000 | $45,000 | $45,000 | $45,000 | $45,000 | $45,000 | $45,000 |
| Retained Earnings | ($27,950) | ($27,950) | ($27,950) | ($27,950) | ($27,950) | ($27,950) | ($27,950) | ($27,950) | ($27,950) | ($27,950) | ($27,950) | ($27,950) | ($27,950) |
| Earnings | $0 | $918 | $1,860 | $2,828 | $3,804 | $5,942 | $8,088 | $9,087 | $10,128 | $11,195 | $12,269 | $13,350 | $14,457 |
| Total Capital | $17,050 | $17,968 | $18,910 | $19,878 | $20,854 | $22,992 | $25,138 | $26,137 | $27,178 | $28,245 | $29,319 | $30,400 | $31,507 |
| Total Liabilities and Capital | $227,050 | $242,970 | $243,441 | $242,245 | $240,784 | $258,751 | $242,752 | $227,012 | $235,395 | $237,536 | $236,174 | $235,060 | $234,246 |
| Net Worth | $17,050 | $17,968 | $18,910 | $19,878 | $20,854 | $22,992 | $25,138 | $26,137 | $27,178 | $28,245 | $29,319 | $30,400 | $31,507 |


