
Hands On! Children's Art Museum
Executive Summary
Hands On! Children’s Art Museum of Chicago, (Hands On!) is a not-for-profit 501(c)(3) organization. Hands On! is being formed to provide unique and meaningful arts programming for all children, to educate children in the arts, and to build a lifelong audience for the arts. We plan to offer a dynamic and constantly-evolving program. Although we will incorporate all of the fine arts into our programs, our focus is on visual art. Most activities will be open-ended and enjoyed on a walk-in basis. The Museum will be staffed by working artists, and all structured activities will be led by master artist-teachers.
The Arts Education Partnership, in conjunction with the President’s Committee on the Arts and Humanities, commenced a study last year to examine the impact of arts experiences on young people and to explore why and how young people were changed through their arts experiences. Evidence demonstrates that children with high levels of arts participation outperform “arts-poor” students by virtually every measure. This study, Champions of Change, found much evidence that learning in the arts helps develop habits that will support other disciplines, and that it can often reach at-risk students when other disciplines cannot. The arts provide young people with authentic learning experiences that engage their minds, hearts, and bodies. Arts education helps students learn; it can enhance creativity, self-discipline, and the skills and confidence necessary to meet the challenges encountered during their lives.
The three founding board members, all of whom are mothers of young children, are uniquely qualified to bring this project to fruition. Karolyn Kuehner, Executive Director, holds a Bachelor of Music degree in Piano Pedagogy and a Master of Music degree in Piano Performance and Pedagogy, with highest honors, from Chicago Musical College of Roosevelt University. In addition, she served as Lecturer in Piano at Roosevelt University for over 10 years, and has also served on the piano faculties at Concordia University and Elmhurst College. Ms. Kuehner received the D.H. Baldwin Fellowship in recognition of her contributions to piano pedagogy and is listed in the book, Who’s Who in American Music. Ms. Kuehner is an active Brownie Troop leader with the Girl Scouts of Chicago and is an advocate for homeschooling. She was a guest on Educate! on Channel 20, and Medill Reports at Northwestern University. Interviews with Ms. Kuehner have appeared in Chicago Parent and the Homeschooling Link.
Sheri Jendra, Operations Director, holds a Bachelor of Arts degree in Public Administration, and a Master of Public Administration degree from Governors State University. She was formerly employed as the Housing Director at the Beverly Area Planning Association, a non-for-profit community organization. She has also served as Assistant Planner for the Northeastern Illinois Planning Commission. Ms. Jendra is active as a volunteer in many capacities at St. Barnabas Catholic Church and Elementary School, and in a variety of youth sports activities.
Nancy McGourty, Marketing Director, holds a Bachelor of Science in Commerce degree with a major in Marketing from DePaul University. Previous employment includes the position of Assistant Vice President/Marketing at Founders Bank, Economic Development Director for the Beverly Area Planning Association, and Marketing Officer in the Corporate and Institutional Banking group at First Chicago Bank. Ms. McGourty is active in the Beverly/Morgan Park community as a director of the Southwest Beverly Improvement Association, and as a volunteer at Sutherland Elementary School, St. Barnabas Catholic Church, and the AYSO.
In addition to the founding board members, our Board of Directors is comprised of a diverse group of individuals including Grammy Award winning composer and pianist Ramsey Lewis, Michael Friedman, CEO of Premonition Records, James Lindsey, CPA with TTX Company, and Paul Tuminaro, Chicago-based arts advocate and member of the NewGroup Board at the Museum of Contemporary Art.
We are seeking funding for initial start-up costs to be used for legal costs, leasehold improvements, rent and related expenses, office equipment, furniture, starting inventory, and initial cash to handle the first few months of expenses.
We estimate that approximately 60% of Hands On!’s annual revenue will be generated by a combination of membership, admissions, programming, retail sales, and related activities. The remainder of our funding will be generated by:
- The writing of proposals to secure grants from foundations.
- The solicitation of individuals, corporations, and small businesses.
- An annual large-scale benefit concert, family benefits, and special events.
- A variety of small scale fundraising activities.
Objectives
Hands On!‘s objectives during the first year of business are:
- To generate earned revenue from a combination of membership and admission fees, programming, outreach, retail sales, and special events.
- To secure new funding sources including foundation grants, government grants, and private and corporate donations.
- To have 375 total paid memberships.
- To serve 1,500 children through our outreach programs.
Mission
The mission of Hands On! is to encourage children of all ages to develop their full creative potential through the visual and performing arts. Hands On! strives, through the fine arts, to create a unique environment in which children of all ages, abilities, and experience can feel free to imagine, create, and welcome the arts into their lives. Hands On! provides a professional work environment that is challenging, rewarding, creative, and respectful of ideas and individuals.
Keys to Success
This topic was not included in the original business plan, but is included here as a placeholder for others using this plan as a guide. Please remember that the default outline is flexible on purpose, because every business plan is unique, so many excellent plans omit topics included in the standard outline and many add additional topics. The outline is a suggestion, not a checklist. You can add and delete topics easily. Make it your plan, not the software’s plan.

Organization Summary
Hands On! is a not-for-profit organization formed to provide a place where children of all ages and abilities are encouraged to develop their full creative potential through the visual and performing arts. We plan to offer a dynamic, unique,and constantly evolving program. Although we will incorporate all of the fine arts into our programs, our focus is on visual art. Most activities will be open-ended and enjoyed on a walk-in basis. The Museum will be staffed by working artists, and all structured activities will be led by master artist-teachers. Hands On! will offer an art experience to children that will increase awareness of the arts, create an audience for the arts, and cannot be duplicated.
Our facility will house nine permanent open-art stations, including the Little People Lounge for our youngest visitors, Art Journey for toddlers, Sunflower Studio, Daisy Doodle-Shop, the Navajo Weaving Loom, I-MAC Imagination Station, the Sculpture Shop, Poppyseed Palace, and the Daily Special. In addition to our permanent stations, we will have a revolving set of installations, including our Shell Grotto, English Garden Light Design Table, City Design Architecture Board, and the Paint-Your-Own Ceramics Studio. We will have three art galleries: the Children’s Gallery, a gallery showcasing the work created by the children who visit Hands On!; the Artworks Gallery, which is dedicated to the presentation of reproductions of work created by famous (and not so famous) grown-up artists; and the Chicago Artists Gallery, which provides a venue for our resident artists, as well as other area artists, to showcase their work.

Our facility will also house an extensive children’s library that contains high quality books about artists, dancers, musicians, and composers and their lives and work. We will also provide a resource library for adults who are interested in furthering their knowledge of the arts. Our Curiosity Shop will sell affordable, high-quality art supplies, handmade toys, and other unique items.
We will offer special artist-led workshops and performances on a daily basis, including a twice daily “Storytime at Poppyseed Palace,” and the Daily Special guided art activity. In addition, we will host the First Friday Concert Series, the Second Sunday Family Workshop, Culture Bugs classes for 18-42 month old children, Art Colony for 4-6 year old children, the Apprentice Workshop for teenagers, the Saturday Film Series, Art Encounters outreach program, monthly docent visits led by representatives of Chicago area galleries and museums, scheduled gallery openings, and seasonal special events.
Hands On! plans to locate in the Beverly/Morgan Park neighborhood on the southwest side of the city of Chicago. Although preliminary plans are being made to find a location, we will secure space when approximately fifty percent of our start-up funding has been raised.
Start-up Summary
Start-up expense totals include legal costs, leasehold improvements, rent, and related expenses. Start-up assets required include assets office equipment, furniture, and initial inventory and initial cash to handle the first few months of expenses. The details are included in the following chart and table.

| Start-up Funding | |
| Start-up Expenses to Fund | $35,000 |
| Start-up Assets to Fund | $35,000 |
| Total Funding Required | $70,000 |
| Assets | |
| Non-cash Assets from Start-up | $10,000 |
| Cash Requirements from Start-up | $25,000 |
| Additional Cash Raised | $0 |
| Cash Balance on Starting Date | $25,000 |
| Total Assets | $35,000 |
| Liabilities and Capital | |
| Liabilities | |
| Current Borrowing | $0 |
| Long-term Liabilities | $0 |
| Accounts Payable (Outstanding Bills) | $0 |
| Other Current Liabilities (interest-free) | $0 |
| Total Liabilities | $0 |
| Capital | |
| Planned Investment | |
| Founding Directors | $15,000 |
| Private and Corporate Investors | $25,000 |
| Grants | $30,000 |
| Additional Investment Requirement | $0 |
| Total Planned Investment | $70,000 |
| Loss at Start-up (Start-up Expenses) | ($35,000) |
| Total Capital | $35,000 |
| Total Capital and Liabilities | $35,000 |
| Total Funding | $70,000 |
| Start-up | |
| Requirements | |
| Start-up Expenses | |
| Legal (Incorp., Permits, License) | $1,500 |
| Consulting Services | $1,100 |
| Leasehold Improvements | $14,000 |
| Stationery/Office Supplies | $500 |
| Advertising/Promotion | $1,200 |
| Website Design | $1,700 |
| Insurance | $1,000 |
| Rent | $3,500 |
| Security Deposit | $7,000 |
| Utilities (During Buildout) | $1,300 |
| Signage | $1,400 |
| Other | $800 |
| Total Start-up Expenses | $35,000 |
| Start-up Assets | |
| Cash Required | $25,000 |
| Start-up Inventory | $1,500 |
| Other Current Assets | $0 |
| Long-term Assets | $8,500 |
| Total Assets | $35,000 |
| Total Requirements | $70,000 |
Legal Entity
This topic was not included in the original business plan, but is included here as a placeholder for others using this plan as a guide. Please remember that the default outline is flexible on purpose, because every business plan is unique, so many excellent plans omit topics included in the standard outline and many add additional topics. The outline is a suggestion, not a checklist. You can add and delete topics easily. Make it your plan, not the software’s plan.
Locations and Facilities
This topic was not included in the original business plan, but is included here as a placeholder for others using this plan as a guide. Please remember that the default outline is flexible on purpose, because every business plan is unique, so many excellent plans omit topics included in the standard outline and many add additional topics. The outline is a suggestion, not a checklist. You can add and delete topics easily. Make it your plan, not the software’s plan.
Services
Open-Art Stations
Hands On! will house nine permanent open-art stations. These stations are the focus of our daily work. Our resident teaching artists will staff the open-art stations and will provide guidance when it is requested. The remainder of their time will be spent demonstrating their skills and maintaining the studio spaces. Each station provides a unique opportunity for Hands On! to further our purposes as an educational and charitable organization. The permanent open-art stations include:
- Little People Lounge. This is a place where our youngest visitors can freely explore their creativity and curiosity. All activities are open-ended and designed for children who are not yet ready for our open-art tables. The Lounge is stocked with an evolving supply of creative and challenging playthings including wall-mounted mirrors, a revolving display of eye level artwork, sorting boxes with color, shape, and texture cards, simple wooden puzzles, stacking toys, including graduated blocks and collapsible pole stacking rings, woolen and knit balls, and cloth blocks.
- Art Journey. Art Journey is a studio space that is specifically designed to meet the needs of toddlers. Young children will enjoy working at the Colorful Window (using colorform material), sculpting with homemade play-clay using cookie cutters, wooden mallets, rolling pins, and other tools, fingerpainting, stamping, and building with a variety of blocks, including architecture blocks, Kapla blocks, and tree blocks. In addition, there will be a handmade doll-sized treehouse stocked with fairies, trolls, and dolls for creative play.
- Sunflower Studio. All painting, printing, and similarly messy projects will take place here. The studio will be generously stocked with a multitude of different types of child friendly paints, inks, and dyes as well as a variety of papers, brushes, brayers, and printing mediums.
- Daisy Doodle-Shop. The focus in the Daisy Doodle-Shop is on drawing, design, and reproduction. This studio will contain a drawing table as well as two easels. Children can choose from a variety a drawing tools including color pencils, crayons, markers, watercolor pencils, chalk, charcoal pencils, and pastels. Discovery is possible through imitation or free exploration. Many paper textures and incomplete reproductions will be available for use.
- Sculpture Shop. All sculpture and three-dimensional art activities are held in the Sculpture Shop. Children are free to produce sculpture using the ever-changing materials, including found objects, purchased supplies, and items donated by local artisans.
- Weaving Loom. The weaving loom is a reproduction of a large Navajo loom. Children can enjoy the rhythmic process of weaving as the Navajo have for generations. The loom is a stationary exhibit and all weaving remains with the loom.
- I-MAC Imagination Station. Children can explore lines, shapes, form and design using a computer graphics design program. They can also explore the collection of CD-ROMs, featuring the works found in some of the world’s finest art galleries and museums.
- Poppyseed Palace. “Storytime at Poppyseed Palace” takes place twice daily at Poppyseed Palace. Storytime will include the reading of quality children’s storybooks and poetry books appropriate and challenging for children of all ages. Some storytime sessions will be augmented by the addition of live music, interactive theatre, and impromptu storytelling. When there is no storytime scheduled, children and their caregivers will be encouraged to choose a book from the children’s library and read together or to try their hand at assembling puzzles of famous works of art.
- Daily Special. This is an open-art station that hosts the special activities of the day, including beadmaking, quilting, or candlemaking, among others. The Daily Special will be a multi-use area and will be framed by a curtain and small puppet theatre. This area will also be used as a venue for presenting performance art and theatre pieces created by the children. The Daily Special is an in-depth, artist led activity that provides balance between a structured and an unstructured creative experience. The children will benefit from exploring the processes of art through the eyes of a professional artist.
In addition to the nine permanent stations, we will have a revolving set of installations, including a Shell Grotto, English Garden Light Design Table, and the City Design Architecture Board. These special exhibits will rotate on a quarterly basis and will be installed after Hands On! has been in operation for one full year.
Art Galleries
We will have three art galleries:
- Children’s Gallery. This is an exhibit showcasing the work created by the children who visit Hands On!
- Artworks Gallery. This gallery is dedicated to the presentation of reproductions of work created by famous (and not so famous) grown-up artists.
- Chicago Artists Gallery. This gallery provides a venue for our resident artists, as well as other area artists, to showcase their work.
The resident teaching artists staffing the museum will be available to answer questions and guide visitors through the galleries. These galleries provide an opportunity for our visitors to explore the full range of visual arts in all its forms, past and present. As children are exposed to quality art, it becomes an integral part of their lives. These experiences will be the catalyst to a lifetime of appreciation of and a respect for their own creativity and the creativity of others.
Additional Services
Libraries
Our facility will house an extensive non-circulating children’s library that will contain high quality books about artists, dancers, musicians, and composers, and their lives and work. Hands On! will also provide a resource library for adults who are interested in furthering their knowledge of the arts. The resource library will be a collection of reference books, museum guides, prints, postcard collections, and brochures that will enable the user to learn more about the work of a particular artist, style, or period in art history.
Outreach Program
Hands On! is dedicated to fostering the creative spirits of all children. To this end, we will offer an extensive outreach program, Art Encounters. Hands On! will provide programming that meets the needs of schools, community groups, and private organizations. Most programs will run between one and two hours in length, and most will run during regular museum hours, but arrangements will be made to accommodate before and after hours programs. Representative programs include: “Artists Past and Present,” “Open-Art Table Extravaganza,” “Global Art,” and “Girl Scout Badge Work.” In addition, Hands On! will provide programming for children with special needs that will be developed and executed by a licensed art therapist. All other programs will be developed and executed by resident teaching artists. Hands On! expects that Art Encounters will eventually be a substantial part of its programming.
Classes
Hands On! will sponsor two classes for young children: Culture Bugs and Art Colony. Participants will have an intensive multi-media arts experience that involves painting, collage, music, and movement. They develop an awareness of their environment through the manipulation of materials, and sensory awareness is expanded through activities that stimulate hearing, sight, and touch. The classes will meet weekly for six week sessions. Classes will be facilitated by a resident teaching artist.
Hands On! will offer a unique program directed toward the interests of young adults between the ages of 13 and 17. We will offer a flexible series of special classes, workshops, and seminars that introduce students to a wide variety of art mediums. Topics include the basics of photography and darkroom, animation, and exploring the art of portraiture. The Apprentice Workshop is held once weekly for three hours. Students can choose to participate on a weekly basis, or cater the program to meet their needs and register for only a portion of the program. All sessions are led by a resident teaching artist. Apprentice Workshop will become a regular part of Hands On!‘s programming after we have been in operation for one full year.
Concert Series
The First Friday Concert Series will begin as a bi-monthly event until Hands On! has been in operation for one full year. This programming will then be presented on a monthly basis. The programs will be one hour in length and will feature classical, jazz, and world music, as well as dance, storytelling, and theatre performances presented by Chicago-based performers.
Family Workshops
Hands On! will sponsor the Second Sunday Family Workshop that will give all members of families the opportunity to create art together in a positive and fun environment. Our senior staff artists will introduce new and involved art processes for a creative, yet challenging experience. This workshop will meet in the Daily Special studio.
Film Series
The Saturday Afternoon Film Series will emphasize high quality videos appropriate for the viewing of all children. Most films will be about the lives and work of important artists, composers, musicians, and dancers. Most film viewings will last approximately one hour.
Additional Programs
After Hands On! has been operating for one full year, we will add additional programming, including quarterly Docent Visits by representatives of different galleries and museums located in the Chicago area. Docents will be prepared to answer questions about their collections and special exhibits, as well as help participants navigate the gallery or museum with their children.
Hands On! will sponsor quarterly Field Trips to various cultural destinations throughout Chicago, including the Art Institute of Chicago and the Chicago Symphony Orchestra children’s matinees.
Curiosity Shop
Hands On! plans to open a small Curiosity Shop that will sell affordable, quality art supplies, handmade toys, and other unique items. Most items will be made by artists and sold on a consignment basis.
Market Analysis Summary
Hands On! will be focused on families seeking to nurture their children’s creative potential through the visual and performing arts. Initially, we will address a segment of the Chicagoland market known for its stable, family orientation, and for its willingness to support and patronize local institutions. Once established, we will expand our focus to include the entire Chicagoland market.
Hands On! strives, through the fine arts, to create a unique environment in which children of all ages, ability, and experience can feel free to imagine, create, and welcome the arts into their lives. This environment will appeal to a broad cross-section of all families, without regard to racial, educational, or economic background.
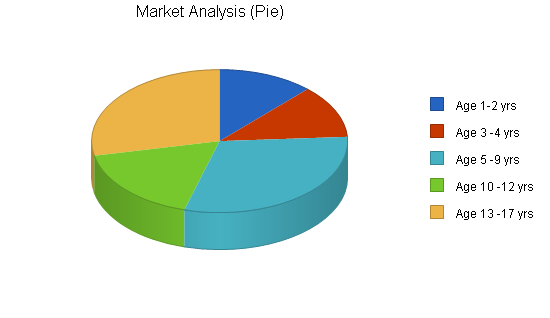
Market Segmentation
Using a broad definition of our market, every family with a child is a potential consumer of the programs and services offered by Hands On! If we were to temper that broad definition with a geographic boundary of a thirty-mile radius, we still have the opportunity to reach a vast market, the entire Chicagoland area. Simply stated, there are literally millions of households that meet this market definition. Our target market is families with children ages seventeen and under. Our core market is families with children between the ages of three and ten.
We feel that in order to establish a foothold within this vast market and create brand awareness for the unique and high-quality programs we are offering, we need to focus our initial marketing efforts on a smaller market segment. The initial marketing effort will extend through our first twelve months of operation and target a market segment within a five-mile radius of our location. By any measure, this remains a richly populated market of approximately 78,000 households with children (using 103rd and Western as the center point), representing 151,000 children between the ages of one and seventeen (1999 U.S. Census data).
As a result of scaling our initial efforts in this manner, we are able to leverage our strong ties within the local community, local media, and educational institutions. To drive awareness, we will supplement the support we receive from local institutions with a broad sweeping outreach program, focused direct mail campaigns, and media placement. Beverly/Morgan Park is a stable area with a history of supporting family-oriented programs offered both locally and throughout the greater metropolitan area. Once established, we will expand our market reach utilizing the same techniques, but scaled to reach a much broader audience.
Our outreach programs will focus primarily on serving children in low to moderate income areas of the city of Chicago and the surrounding communities. Programming will be tailored to fit the needs of children in the Chicago Public School system, as well as Chicago-based private and parochial schools. In addition, our programming will extend to those children in suburban public, private, and parochial schools, homeschoolers, children served by Easter Seals and the Progress Center for Independent Living, among others. Our outreach will also extend to those children enrolled in day care and preschool programs, and to those children who are patients at local children’s hospitals. We are in the process of developing relationships with Chicago-area galleries and arts organizations with the intent of extending our outreach into communities outside the five-mile radius of our location. We will combine programming, special events, and gallery shows with these organizations.
| Market Analysis | |||||||
| Year 1 | Year 2 | Year 3 | Year 4 | Year 5 | |||
| Potential Customers | Growth | CAGR | |||||
| Age 1-2 yrs | 5% | 18,089 | 18,993 | 19,943 | 20,940 | 21,987 | 5.00% |
| Age 3 -4 yrs | 3% | 18,151 | 18,605 | 19,070 | 19,547 | 20,036 | 2.50% |
| Age 5 -9 yrs | 5% | 45,838 | 48,130 | 50,537 | 53,064 | 55,717 | 5.00% |
| Age 10 -12 yrs | 5% | 26,100 | 27,405 | 28,775 | 30,214 | 31,725 | 5.00% |
| Age 13 -17 yrs | 2% | 42,688 | 43,542 | 44,413 | 45,301 | 46,207 | 2.00% |
| Total | 3.88% | 150,866 | 156,675 | 162,738 | 169,066 | 175,672 | 3.88% |
Service Providers Analysis
There is no known organization in the Chicagoland area that offers the unique art experience provided by Hands On!
Alternatives come from such Chicago area institutions as the Kohl Children’s Museum, the Chicago Children’s Museum, the Museum of Contemporary Art, and the Kraft Education Center at the Art Institute of Chicago, however, these institutions do not have the singular focus of Hands On!, on providing a rich art experience for children.
There are several area organizations where children can register for art classes. Local examples include the Beverly Art Center, Heritage Gallery, Spectrum Art Supplies, and the Chicago Park District. Lakeshore Learning offers free craft workshops on Saturday mornings. Again, an art class for children is only a part of what these institutions provide. Hands On! intends to establish cooperative relationships with these organizations with the expectation that increased awareness in these types of programs will result in mutual benefit.
In a much broader sense, our competition is not limited to places offering art classes and museums. There are many external activities in which families can choose to participate. Given free time and disposable income, families may choose among a variety of activities including sports, music classes, dance classes, and park district programs. We believe that families will recognize the benefit of an organization with a singular focus, as a means of providing balance, as an opportunity to enrich their children’s lives, and as a fun place to spend time with their children.
Beverly Art Center, Chicago Park District, and Lakeshore Learning are the closest to direct alternatives.
Strategy and Implementation Summary
Hands On! will be focused on families seeking to nurture their children’s creative potential through the visual and performing arts. Initially, we will address a segment of the Chicagoland market known for its stable, family orientation, and for its willingness to support and patronize local institutions. Once established, we will expand our focus to include the entire Chicagoland market.
Hands On! strives, through the fine arts, to create a unique environment in which children of all ages, ability, and experience can feel free to imagine, create, and welcome the arts into their lives. This environment will appeal to a broad cross-section of all families, without regard to racial, educational, or economic background.
Market Segmentation
Using a broad definition of our market, every family with a child is a potential consumer of the programs and services offered by Hands On! If we were to temper that broad definition with a geographic boundary of a thirty-mile radius, we still have the opportunity to reach a vast market, the entire Chicagoland area. Simply stated, there are literally millions of households that meet this market definition. Our target market is families with children ages seventeen and under. Our core market is families with children between the ages of three and ten.
We feel that in order to establish a foothold within this vast market and create brand awareness for the unique and high-quality programs we are offering, we need to focus our initial marketing efforts on a smaller market segment. The initial marketing effort will extend through our first twelve months of operation and target a market segment within a five-mile radius of our location. By any measure, this remains a richly populated market of approximately 78,000 households with children (using 103rd and Western as the center point), representing 151,000 children between the ages of one and seventeen (1999 U.S. Census data).
As a result of scaling our initial efforts in this manner, we are able to leverage our strong ties within the local community, local media, and educational institutions. To drive awareness, we will supplement the support we receive from local institutions with a broad sweeping outreach program, focused direct mail campaigns, and media placement. Beverly/Morgan Park is a stable area with a history of supporting family-oriented programs offered both locally and throughout the greater metropolitan area. Once established, we will expand our market reach utilizing the same techniques, but scaled to reach a much broader audience.
Our outreach programs will focus primarily on serving children in low to moderate income areas of the city of Chicago and the surrounding communities. Programming will be tailored to fit the needs of children in the Chicago Public School system, as well as Chicago-based private and parochial schools. In addition, our programming will extend to those children in suburban public, private, and parochial schools, homeschoolers, children served by Easter Seals and the Progress Center for Independent Living, among others. Our outreach will also extend to those children enrolled in day care and preschool programs, and to those children who are patients at local children’s hospitals. We are in the process of developing relationships with Chicago-area galleries and arts organizations with the intent of extending our outreach into communities outside the five-mile radius of our location. We will combine programming, special events, and gallery shows with these organizations.
| Market Analysis | |||||||
| Year 1 | Year 2 | Year 3 | Year 4 | Year 5 | |||
| Potential Customers | Growth | CAGR | |||||
| Age 1-2 yrs | 5% | 18,089 | 18,993 | 19,943 | 20,940 | 21,987 | 5.00% |
| Age 3 -4 yrs | 3% | 18,151 | 18,605 | 19,070 | 19,547 | 20,036 | 2.50% |
| Age 5 -9 yrs | 5% | 45,838 | 48,130 | 50,537 | 53,064 | 55,717 | 5.00% |
| Age 10 -12 yrs | 5% | 26,100 | 27,405 | 28,775 | 30,214 | 31,725 | 5.00% |
| Age 13 -17 yrs | 2% | 42,688 | 43,542 | 44,413 | 45,301 | 46,207 | 2.00% |
| Total | 3.88% | 150,866 | 156,675 | 162,738 | 169,066 | 175,672 | 3.88% |
Service Providers Analysis
There is no known organization in the Chicagoland area that offers the unique art experience provided by Hands On!
Alternatives come from such Chicago area institutions as the Kohl Children’s Museum, the Chicago Children’s Museum, the Museum of Contemporary Art, and the Kraft Education Center at the Art Institute of Chicago, however, these institutions do not have the singular focus of Hands On!, on providing a rich art experience for children.
There are several area organizations where children can register for art classes. Local examples include the Beverly Art Center, Heritage Gallery, Spectrum Art Supplies, and the Chicago Park District. Lakeshore Learning offers free craft workshops on Saturday mornings. Again, an art class for children is only a part of what these institutions provide. Hands On! intends to establish cooperative relationships with these organizations with the expectation that increased awareness in these types of programs will result in mutual benefit.
In a much broader sense, our competition is not limited to places offering art classes and museums. There are many external activities in which families can choose to participate. Given free time and disposable income, families may choose among a variety of activities including sports, music classes, dance classes, and park district programs. We believe that families will recognize the benefit of an organization with a singular focus, as a means of providing balance, as an opportunity to enrich their children’s lives, and as a fun place to spend time with their children.
Beverly Art Center, Chicago Park District, and Lakeshore Learning are the closest to direct alternatives.
Management Summary
The initial management team consists of Karolyn Kuehner, Executive Director; Sheri Jendra, Operations Director; and Nancy McGourty, Marketing Director.
Karolyn Kuehner, Executive Director. The Executive Director is hired by the board of directors. Responsibilities include, but are not limited to:
- Advise the board and carry out tasks assigned by the board.
- Oversee daily operations, project planning, and special events, working closely with each program coordinator.
- Personnel management (recruitment, hiring, training, evaluation and termination of staff).
- Together with the Operations Director, develop and manage the annual budget for board approval including necessary revisions.
- Program development.
- Supervision of artistic staff.
- Develop network of support within the arts community.
- Develop and implement outreach program.
Sheri Jendra, Operations Director. The Operations Director is hired by the Executive Director. Responsibilities include, but are not limited to:
- Advise the board and carry out tasks assigned by the board.
- Assist in personnel management.
- Development of administrative standards and procedures related to personnel and staff development.
- Supervision of staff.
- Serve as liaison between staff and board members.
- Coordinate with the Executive Director and the board to oversee activities including grant applications, management of grants, special projects, fiscal management.
- Together with the Executive Director, develop and manage the annual budget for board approval including necessary revisions.
- Oversee the preparation of the annual report of activities as well as fiscal reports.
- Manage network finances and reporting, including museum store.
- Coordinate work on annual audits.
- Define priorities for all supervised staff.
- Inventory management of art and office supplies.
Nancy McGourty, Marketing Director. The Marketing Director is hired by the Executive Director. Responsibilities include, but are not limited to:
- Advise the board and carry out tasks assigned by the board.
- All marketing activities including establish the marketing budget with the executive director; create and implement marketing plan; develop marketing materials; advertising placement; develop direct mail plan.
- Membership management including establish and maintain member and prospective member databases; produce renewal notices; special member mailings.
- Publication and distribution of the quarterly newsletter.
- Website maintenance.
- Direct fundraising activities.
- Coordinate volunteers.
- Coordinate solicitation of corporate and in-kind donations.
- Measure effectiveness of marketing activities (program tracking).
Organizational Structure
Our initial team includes three directors, a curator, four senior staff working artists, and two store clerks. During the second month of operation we will add two junior staff members, and in the third month of operation we will add another. In the fourth month, we will add the Culture Bugs/Art Colony program coordinator. All staff positions are part-time. The Executive Director will assume the responsibility of the program coordinator until that position is filled.
As stated in our articles of incorporation, our board of directors is to consist of a minimum of five and a maximum of twelve persons. We currently have seven persons serving on our board of directors representing various facets of both the arts and business.
Personnel Plan
Store Manager. This person is responsible for the operation of the Curiosity Shop. Responsibilities include sales, retail display, and balancing cash intake. Additionally, this person will collect admission fees and distribute membership and program information. (Part-time position for two employees, approximately 80 hours each per month.)
Culture Bugs and Art Colony Coordinator. This person plans and executes the Culture Bugs and Art Colony Programs. (Part-time position, approximately 60 hours per month.)
Curator. This person curates all exhibits in the Museum’s three galleries. (Part-time position, approximately 60 hours per month.)
Senior Staff. All senior staff members must have experience working with children through their art. Staff members assist children as needed and serve as monitors in the various open-art stations throughout the Museum. They demonstrate their skills to the children, guide visitors through the galleries, and maintain studio space. Staff also participate in the planning and execution of the daily Storytime at Poppyseed Palace, the Daily Special, and Second Sunday Family Workshops. (Part-time position for 4 employees at approximately 52 hours each per month.)
Junior Staff. Junior staff members assist senior staff members when needed. They ensure that all stations are kept clean and materials are in place. They monitor the children’s behavior and, if needed, gently assist them to engage in appropriate activities. Junior staff members are college students at Saint Xavier University. (Part-time position for 3 employees at approximately 54 hours each per month.)
| Personnel Plan | |||
| Year 1 | Year 2 | Year 3 | |
| Directors | $86,400 | $90,720 | $95,256 |
| Culture Bugs/Art Colony Coordinator | $6,480 | $9,180 | $9,720 |
| Curator | $10,800 | $11,520 | $12,240 |
| Store Staff | $16,320 | $17,136 | $17,993 |
| Junior Staff | $12,960 | $13,608 | $14,288 |
| Senior Staff | $37,440 | $39,936 | $42,432 |
| Total People | 14 | 14 | 14 |
| Total Payroll | $170,400 | $182,100 | $191,929 |
Financial Plan
The basis for our financial planning has been looking forward with conservative estimates for revenue and expenses. We are committed to consistent growth of our cash balances through prudent management of our expenses. Our focus will be on remaining profitable year to year, while also building adequate cash reserves.
Important Assumptions
Personnel burden is relatively low at 15% based on the assumption that the only benefits included will be minimal vacation time based on the number of hours worked. Personnel burden also includes taxes.
We anticipate carrying one month’s worth of inventory in the Curiosity Shop. The majority of items in the shop are sold on a consignment basis, and therefore do not affect inventory turnover.
The estimate of 8% funding on credit refers to the delay between the commitment of funding and the actual receipt of funds. We anticipate the great majority of our revenues will be paid by cash or check.
| General Assumptions | |||
| Year 1 | Year 2 | Year 3 | |
| Plan Month | 1 | 2 | 3 |
| Current Interest Rate | 6.50% | 6.50% | 6.50% |
| Long-term Interest Rate | 7.00% | 7.00% | 7.00% |
| Tax Rate | 0.00% | 0.00% | 0.00% |
| Other | 0 | 0 | 0 |
Break-even Analysis
The table and chart below show the level of funding, from all sources combined, we need on a monthly average, to cover our operating expenses.

| Break-even Analysis | |
| Monthly Revenue Break-even | $24,111 |
| Assumptions: | |
| Average Percent Variable Cost | 7% |
| Estimated Monthly Fixed Cost | $22,493 |
Projected Surplus or Deficit
Our projected annual surplus or deficit is shown on the following table. The detailed monthly projections are included in the appendix.


| Surplus and Deficit | |||
| Year 1 | Year 2 | Year 3 | |
| Funding | $287,643 | $318,966 | $351,605 |
| Direct Cost | $19,303 | $22,570 | $24,451 |
| Other | $0 | $0 | $0 |
| Total Direct Cost | $19,303 | $22,570 | $24,451 |
| Gross Surplus | $268,340 | $296,396 | $327,153 |
| Gross Surplus % | 93.29% | 92.92% | 93.05% |
| Expenses | |||
| Payroll | $170,400 | $182,100 | $191,929 |
| Sales and Marketing and Other Expenses | $54,325 | $56,000 | $56,700 |
| Depreciation | $2,004 | $2,004 | $2,004 |
| Leased Equipment | $600 | $600 | $600 |
| Utilities | $14,400 | $15,000 | $15,000 |
| Insurance | $2,625 | $3,500 | $3,500 |
| Payroll Taxes | $25,560 | $27,315 | $28,789 |
| Other | $0 | $0 | $0 |
| Total Operating Expenses | $269,914 | $286,519 | $298,523 |
| Surplus Before Interest and Taxes | ($1,574) | $9,877 | $28,631 |
| EBITDA | $430 | $11,881 | $30,635 |
| Interest Expense | $0 | $0 | $0 |
| Taxes Incurred | $0 | $0 | $0 |
| Net Surplus | ($1,574) | $9,877 | $28,631 |
| Net Surplus/Funding | -0.55% | 3.10% | 8.14% |
Projected Cash Flow
Management of cash flow is critical to our success. The monthly cash flow is shown in the illustration, with one bar representing the cash flow per month, and the other bar the monthly balance. The annual cash flow figures are included here and the more important detailed monthly numbers are included in the appendix. Should our monthly cash flows fail to meet expectations, directors salaries will not be paid. If further action is required, we will utilize revolving credit facilities.

| Pro Forma Cash Flow | |||
| Year 1 | Year 2 | Year 3 | |
| Cash Received | |||
| Cash from Operations | |||
| Cash Funding | $264,632 | $293,449 | $323,476 |
| Cash from Receivables | $19,666 | $25,153 | $27,749 |
| Subtotal Cash from Operations | $284,297 | $318,602 | $351,225 |
| Additional Cash Received | |||
| Sales Tax, VAT, HST/GST Received | $0 | $0 | $0 |
| New Current Borrowing | $0 | $0 | $0 |
| New Other Liabilities (interest-free) | $0 | $0 | $0 |
| New Long-term Liabilities | $0 | $0 | $0 |
| Sales of Other Current Assets | $0 | $0 | $0 |
| Sales of Long-term Assets | $0 | $0 | $0 |
| New Investment Received | $0 | $0 | $0 |
| Subtotal Cash Received | $284,297 | $318,602 | $351,225 |
| Expenditures | Year 1 | Year 2 | Year 3 |
| Expenditures from Operations | |||
| Cash Spending | $170,400 | $182,100 | $191,929 |
| Bill Payments | $106,718 | $126,009 | $128,808 |
| Subtotal Spent on Operations | $277,118 | $308,109 | $320,737 |
| Additional Cash Spent | |||
| Sales Tax, VAT, HST/GST Paid Out | $0 | $0 | $0 |
| Principal Repayment of Current Borrowing | $0 | $0 | $0 |
| Other Liabilities Principal Repayment | $0 | $0 | $0 |
| Long-term Liabilities Principal Repayment | $0 | $0 | $0 |
| Purchase Other Current Assets | $0 | $0 | $0 |
| Purchase Long-term Assets | $0 | $0 | $0 |
| Dividends | $0 | $0 | $0 |
| Subtotal Cash Spent | $277,118 | $308,109 | $320,737 |
| Net Cash Flow | $7,179 | $10,493 | $30,488 |
| Cash Balance | $32,179 | $42,672 | $73,160 |
Projected Balance Sheet
The following balance sheet shows our projected financial position during the next three years. The monthly estimates are included in the appendix.
| Pro Forma Balance Sheet | |||
| Year 1 | Year 2 | Year 3 | |
| Assets | |||
| Current Assets | |||
| Cash | $32,179 | $42,672 | $73,160 |
| Accounts Receivable | $3,346 | $3,710 | $4,090 |
| Inventory | $1,686 | $2,793 | $2,803 |
| Other Current Assets | $0 | $0 | $0 |
| Total Current Assets | $37,211 | $49,175 | $80,053 |
| Long-term Assets | |||
| Long-term Assets | $8,500 | $8,500 | $8,500 |
| Accumulated Depreciation | $2,004 | $4,008 | $6,012 |
| Total Long-term Assets | $6,496 | $4,492 | $2,488 |
| Total Assets | $43,707 | $53,667 | $82,541 |
| Liabilities and Capital | Year 1 | Year 2 | Year 3 |
| Current Liabilities | |||
| Accounts Payable | $10,281 | $10,364 | $10,607 |
| Current Borrowing | $0 | $0 | $0 |
| Other Current Liabilities | $0 | $0 | $0 |
| Subtotal Current Liabilities | $10,281 | $10,364 | $10,607 |
| Long-term Liabilities | $0 | $0 | $0 |
| Total Liabilities | $10,281 | $10,364 | $10,607 |
| Paid-in Capital | $70,000 | $70,000 | $70,000 |
| Accumulated Surplus/Deficit | ($35,000) | ($36,574) | ($26,697) |
| Surplus/Deficit | ($1,574) | $9,877 | $28,631 |
| Total Capital | $33,426 | $43,303 | $71,934 |
| Total Liabilities and Capital | $43,707 | $53,667 | $82,541 |
| Net Worth | $33,426 | $43,303 | $71,934 |
Standard Ratios
Our projected business ratios for the three years of this plan are shown below, along with ratios for an industry profile, based on the Standard Industry Classification (SIC) Index, 8412, for Museums and Art Galleries.
| Ratio Analysis | ||||
| Year 1 | Year 2 | Year 3 | Industry Profile | |
| Funding Growth | n.a. | 10.89% | 10.23% | 9.50% |
| Percent of Total Assets | ||||
| Accounts Receivable | 7.65% | 6.91% | 4.95% | 18.90% |
| Inventory | 3.86% | 5.20% | 3.40% | 1.00% |
| Other Current Assets | 0.00% | 0.00% | 0.00% | 36.40% |
| Total Current Assets | 85.14% | 91.63% | 96.99% | 56.30% |
| Long-term Assets | 14.86% | 8.37% | 3.01% | 43.70% |
| Total Assets | 100.00% | 100.00% | 100.00% | 100.00% |
| Current Liabilities | 23.52% | 19.31% | 12.85% | 32.50% |
| Long-term Liabilities | 0.00% | 0.00% | 0.00% | 28.50% |
| Total Liabilities | 23.52% | 19.31% | 12.85% | 61.00% |
| Net Worth | 76.48% | 80.69% | 87.15% | 39.00% |
| Percent of Funding | ||||
| Funding | 100.00% | 100.00% | 100.00% | 100.00% |
| Gross Surplus | 93.29% | 92.92% | 93.05% | 0.00% |
| Selling, General & Administrative Expenses | 93.84% | 89.83% | 84.90% | 82.00% |
| Advertising Expenses | 2.66% | 2.82% | 2.70% | 0.90% |
| Surplus Before Interest and Taxes | -0.55% | 3.10% | 8.14% | 1.70% |
| Main Ratios | ||||
| Current | 3.62 | 4.74 | 7.55 | 1.71 |
| Quick | 3.46 | 4.48 | 7.28 | 1.52 |
| Total Debt to Total Assets | 23.52% | 19.31% | 12.85% | 61.00% |
| Pre-tax Return on Net Worth | -4.71% | 22.81% | 39.80% | 1.10% |
| Pre-tax Return on Assets | -3.60% | 18.40% | 34.69% | 2.90% |
| Additional Ratios | Year 1 | Year 2 | Year 3 | |
| Net Surplus Margin | -0.55% | 3.10% | 8.14% | n.a |
| Return on Equity | -4.71% | 22.81% | 39.80% | n.a |
| Activity Ratios | ||||
| Accounts Receivable Turnover | 6.88 | 6.88 | 6.88 | n.a |
| Collection Days | 57 | 50 | 51 | n.a |
| Inventory Turnover | 9.45 | 10.08 | 8.74 | n.a |
| Accounts Payable Turnover | 11.38 | 12.17 | 12.17 | n.a |
| Payment Days | 27 | 30 | 30 | n.a |
| Total Asset Turnover | 6.58 | 5.94 | 4.26 | n.a |
| Debt Ratios | ||||
| Debt to Net Worth | 0.31 | 0.24 | 0.15 | n.a |
| Current Liab. to Liab. | 1.00 | 1.00 | 1.00 | n.a |
| Liquidity Ratios | ||||
| Net Working Capital | $26,930 | $38,811 | $69,446 | n.a |
| Interest Coverage | 0.00 | 0.00 | 0.00 | n.a |
| Additional Ratios | ||||
| Assets to Funding | 0.15 | 0.17 | 0.23 | n.a |
| Current Debt/Total Assets | 24% | 19% | 13% | n.a |
| Acid Test | 3.13 | 4.12 | 6.90 | n.a |
| Funding/Net Worth | 8.61 | 7.37 | 4.89 | n.a |
| Dividend Payout | 0.00 | 0.00 | 0.00 | n.a |
Appendix
| Funding Forecast | |||||||||||||
| Month 1 | Month 2 | Month 3 | Month 4 | Month 5 | Month 6 | Month 7 | Month 8 | Month 9 | Month 10 | Month 11 | Month 12 | ||
| Funding | |||||||||||||
| Membership | 0% | $1,500 | $2,000 | $2,500 | $2,400 | $2,400 | $2,400 | $2,400 | $2,300 | $2,200 | $2,200 | $2,200 | $2,500 |
| Admissions | 0% | $4,080 | $5,280 | $6,000 | $6,600 | $6,600 | $6,600 | $6,600 | $6,000 | $4,200 | $4,200 | $4,200 | $6,000 |
| Culture Bugs/Art Colony/Apprentice | 0% | $2,600 | $2,800 | $3,000 | $4,533 | $4,533 | $4,533 | $4,533 | $4,533 | $3,200 | $3,200 | $3,200 | $4,533 |
| Family Wkshp/Film & Concert Series | 0% | $205 | $505 | $205 | $505 | $205 | $505 | $205 | $505 | $205 | $505 | $205 | $505 |
| Birthday Parties/Rentals | 0% | $0 | $275 | $275 | $275 | $275 | $275 | $275 | $275 | $275 | $275 | $275 | $275 |
| Outreach Programs | 0% | $400 | $900 | $1,100 | $1,200 | $1,200 | $1,200 | $1,200 | $1,200 | $1,100 | $1,100 | $1,100 | $1,200 |
| Curiosity Shop | 0% | $700 | $1,500 | $1,800 | $1,400 | $1,600 | $1,700 | $1,700 | $1,700 | $1,500 | $1,500 | $1,500 | $1,600 |
| Foundation Grants | 0% | $0 | $0 | $10,000 | $0 | $10,000 | $0 | $0 | $10,000 | $0 | $10,000 | $0 | $10,000 |
| Corporate Sponsorship | 0% | $1,000 | $1,000 | $1,000 | $1,000 | $1,000 | $1,000 | $1,000 | $1,000 | $1,000 | $1,000 | $1,000 | $1,000 |
| Annual Family Benefit/Events | 0% | $0 | $5,000 | $0 | $0 | $0 | $35,000 | $0 | $0 | $5,000 | $0 | $0 | $0 |
| Affinity Campaigns | 0% | $0 | $300 | $400 | $0 | $500 | $500 | $0 | $500 | $500 | $0 | $500 | $500 |
| Total Funding | $10,485 | $19,560 | $26,280 | $17,913 | $28,313 | $53,713 | $17,913 | $28,013 | $19,180 | $23,980 | $14,180 | $28,113 | |
| Direct Cost of Funding | Month 1 | Month 2 | Month 3 | Month 4 | Month 5 | Month 6 | Month 7 | Month 8 | Month 9 | Month 10 | Month 11 | Month 12 | |
| Membership | $60 | $80 | $90 | $100 | $110 | $110 | $110 | $110 | $90 | $90 | $90 | $90 | |
| Admissions | $0 | $0 | $0 | $0 | $0 | $0 | $0 | $0 | $0 | $0 | $0 | $0 | |
| Culture Bugs/Art Colony/Apprentice | $100 | $130 | $140 | $200 | $200 | $200 | $200 | $200 | $150 | $150 | $150 | $200 | |
| Family Wkshp/Film & Concert Series | $25 | $275 | $25 | $275 | $25 | $275 | $25 | $275 | $25 | $275 | $25 | $275 | |
| Birthday Parties/Rentals | $0 | $63 | $63 | $63 | $63 | $63 | $63 | $63 | $63 | $63 | $63 | $63 | |
| Outreach Programs | $20 | $45 | $55 | $65 | $75 | $75 | $75 | $70 | $55 | $55 | $55 | $75 | |
| Curiosity Shop | $350 | $750 | $900 | $700 | $800 | $850 | $850 | $850 | $750 | $750 | $750 | $800 | |
| Foundation Grants | $15 | $15 | $15 | $15 | $15 | $15 | $15 | $15 | $15 | $15 | $15 | $15 | |
| Corporate Sponsorship | $10 | $10 | $10 | $10 | $10 | $10 | $10 | $10 | $10 | $10 | $10 | $10 | |
| Annual Family Benefit/Events | $0 | $500 | $0 | $0 | $0 | $2,500 | $0 | $0 | $500 | $0 | $0 | $0 | |
| Affinity Campaigns | $0 | $5 | $5 | $0 | $5 | $5 | $0 | $5 | $5 | $0 | $5 | $5 | |
| Subtotal Cost of Funding | $580 | $1,873 | $1,303 | $1,428 | $1,303 | $4,103 | $1,348 | $1,598 | $1,663 | $1,408 | $1,163 | $1,533 | |
| Personnel Plan | |||||||||||||
| Month 1 | Month 2 | Month 3 | Month 4 | Month 5 | Month 6 | Month 7 | Month 8 | Month 9 | Month 10 | Month 11 | Month 12 | ||
| Directors | 0% | $7,200 | $7,200 | $7,200 | $7,200 | $7,200 | $7,200 | $7,200 | $7,200 | $7,200 | $7,200 | $7,200 | $7,200 |
| Culture Bugs/Art Colony Coordinator | 0% | $0 | $0 | $0 | $720 | $720 | $720 | $720 | $720 | $720 | $720 | $720 | $720 |
| Curator | 0% | $900 | $900 | $900 | $900 | $900 | $900 | $900 | $900 | $900 | $900 | $900 | $900 |
| Store Staff | 0% | $1,360 | $1,360 | $1,360 | $1,360 | $1,360 | $1,360 | $1,360 | $1,360 | $1,360 | $1,360 | $1,360 | $1,360 |
| Junior Staff | 0% | $0 | $810 | $1,215 | $1,215 | $1,215 | $1,215 | $1,215 | $1,215 | $1,215 | $1,215 | $1,215 | $1,215 |
| Senior Staff | 0% | $3,120 | $3,120 | $3,120 | $3,120 | $3,120 | $3,120 | $3,120 | $3,120 | $3,120 | $3,120 | $3,120 | $3,120 |
| Total People | 10 | 12 | 13 | 14 | 14 | 14 | 14 | 14 | 14 | 14 | 14 | 14 | |
| Total Payroll | $12,580 | $13,390 | $13,795 | $14,515 | $14,515 | $14,515 | $14,515 | $14,515 | $14,515 | $14,515 | $14,515 | $14,515 | |
| General Assumptions | |||||||||||||
| Month 1 | Month 2 | Month 3 | Month 4 | Month 5 | Month 6 | Month 7 | Month 8 | Month 9 | Month 10 | Month 11 | Month 12 | ||
| Plan Month | 1 | 2 | 3 | 4 | 5 | 6 | 7 | 8 | 9 | 10 | 11 | 12 | |
| Current Interest Rate | 6.50% | 6.50% | 6.50% | 6.50% | 6.50% | 6.50% | 6.50% | 6.50% | 6.50% | 6.50% | 6.50% | 6.50% | |
| Long-term Interest Rate | 7.00% | 7.00% | 7.00% | 7.00% | 7.00% | 7.00% | 7.00% | 7.00% | 7.00% | 7.00% | 7.00% | 7.00% | |
| Tax Rate | 0.00% | 0.00% | 0.00% | 0.00% | 0.00% | 0.00% | 0.00% | 0.00% | 0.00% | 0.00% | 0.00% | 0.00% | |
| Other | 0 | 0 | 0 | 0 | 0 | 0 | 0 | 0 | 0 | 0 | 0 | 0 | |
| Surplus and Deficit | |||||||||||||
| Month 1 | Month 2 | Month 3 | Month 4 | Month 5 | Month 6 | Month 7 | Month 8 | Month 9 | Month 10 | Month 11 | Month 12 | ||
| Funding | $10,485 | $19,560 | $26,280 | $17,913 | $28,313 | $53,713 | $17,913 | $28,013 | $19,180 | $23,980 | $14,180 | $28,113 | |
| Direct Cost | $580 | $1,873 | $1,303 | $1,428 | $1,303 | $4,103 | $1,348 | $1,598 | $1,663 | $1,408 | $1,163 | $1,533 | |
| Other | $0 | $0 | $0 | $0 | $0 | $0 | $0 | $0 | $0 | $0 | $0 | $0 | |
| Total Direct Cost | $580 | $1,873 | $1,303 | $1,428 | $1,303 | $4,103 | $1,348 | $1,598 | $1,663 | $1,408 | $1,163 | $1,533 | |
| Gross Surplus | $9,905 | $17,687 | $24,977 | $16,485 | $27,010 | $49,610 | $16,565 | $26,415 | $17,517 | $22,572 | $13,017 | $26,580 | |
| Gross Surplus % | 94.47% | 90.42% | 95.04% | 92.03% | 95.40% | 92.36% | 92.47% | 94.30% | 91.33% | 94.13% | 91.80% | 94.55% | |
| Expenses | |||||||||||||
| Payroll | $12,580 | $13,390 | $13,795 | $14,515 | $14,515 | $14,515 | $14,515 | $14,515 | $14,515 | $14,515 | $14,515 | $14,515 | |
| Sales and Marketing and Other Expenses | $4,075 | $4,600 | $4,400 | $4,600 | $5,000 | $4,500 | $4,500 | $4,650 | $4,500 | $4,500 | $4,500 | $4,500 | |
| Depreciation | $167 | $167 | $167 | $167 | $167 | $167 | $167 | $167 | $167 | $167 | $167 | $167 | |
| Leased Equipment | $50 | $50 | $50 | $50 | $50 | $50 | $50 | $50 | $50 | $50 | $50 | $50 | |
| Utilities | $1,200 | $1,200 | $1,200 | $1,200 | $1,200 | $1,200 | $1,200 | $1,200 | $1,200 | $1,200 | $1,200 | $1,200 | |
| Insurance | $0 | $0 | $0 | $875 | $0 | $0 | $0 | $875 | $0 | $0 | $0 | $875 | |
| Payroll Taxes | 15% | $1,887 | $2,009 | $2,069 | $2,177 | $2,177 | $2,177 | $2,177 | $2,177 | $2,177 | $2,177 | $2,177 | $2,177 |
| Other | $0 | $0 | $0 | $0 | $0 | $0 | $0 | $0 | $0 | $0 | $0 | $0 | |
| Total Operating Expenses | $19,959 | $21,416 | $21,681 | $23,584 | $23,109 | $22,609 | $22,609 | $23,634 | $22,609 | $22,609 | $22,609 | $23,484 | |
| Surplus Before Interest and Taxes | ($10,054) | ($3,729) | $3,296 | ($7,099) | $3,901 | $27,001 | ($6,044) | $2,781 | ($5,092) | ($37) | ($9,592) | $3,096 | |
| EBITDA | ($9,887) | ($3,562) | $3,463 | ($6,932) | $4,068 | $27,168 | ($5,877) | $2,948 | ($4,925) | $130 | ($9,425) | $3,263 | |
| Interest Expense | $0 | $0 | $0 | $0 | $0 | $0 | $0 | $0 | $0 | $0 | $0 | $0 | |
| Taxes Incurred | $0 | $0 | $0 | $0 | $0 | $0 | $0 | $0 | $0 | $0 | $0 | $0 | |
| Net Surplus | ($10,054) | ($3,729) | $3,296 | ($7,099) | $3,901 | $27,001 | ($6,044) | $2,781 | ($5,092) | ($37) | ($9,592) | $3,096 | |
| Net Surplus/Funding | -95.89% | -19.06% | 12.54% | -39.63% | 13.78% | 50.27% | -33.74% | 9.93% | -26.55% | -0.16% | -67.65% | 11.01% | |
| Pro Forma Cash Flow | |||||||||||||
| Month 1 | Month 2 | Month 3 | Month 4 | Month 5 | Month 6 | Month 7 | Month 8 | Month 9 | Month 10 | Month 11 | Month 12 | ||
| Cash Received | |||||||||||||
| Cash from Operations | |||||||||||||
| Cash Funding | $9,646 | $17,995 | $24,178 | $16,480 | $26,048 | $49,416 | $16,480 | $25,772 | $17,646 | $22,062 | $13,046 | $25,864 | |
| Cash from Receivables | $0 | $28 | $863 | $1,583 | $2,080 | $1,461 | $2,333 | $4,202 | $1,460 | $2,217 | $1,547 | $1,892 | |
| Subtotal Cash from Operations | $9,646 | $18,023 | $25,041 | $18,063 | $28,128 | $50,877 | $18,813 | $29,974 | $19,106 | $24,279 | $14,593 | $27,756 | |
| Additional Cash Received | |||||||||||||
| Sales Tax, VAT, HST/GST Received | 0.00% | $0 | $0 | $0 | $0 | $0 | $0 | $0 | $0 | $0 | $0 | $0 | $0 |
| New Current Borrowing | $0 | $0 | $0 | $0 | $0 | $0 | $0 | $0 | $0 | $0 | $0 | $0 | |
| New Other Liabilities (interest-free) | $0 | $0 | $0 | $0 | $0 | $0 | $0 | $0 | $0 | $0 | $0 | $0 | |
| New Long-term Liabilities | $0 | $0 | $0 | $0 | $0 | $0 | $0 | $0 | $0 | $0 | $0 | $0 | |
| Sales of Other Current Assets | $0 | $0 | $0 | $0 | $0 | $0 | $0 | $0 | $0 | $0 | $0 | $0 | |
| Sales of Long-term Assets | $0 | $0 | $0 | $0 | $0 | $0 | $0 | $0 | $0 | $0 | $0 | $0 | |
| New Investment Received | $0 | $0 | $0 | $0 | $0 | $0 | $0 | $0 | $0 | $0 | $0 | $0 | |
| Subtotal Cash Received | $9,646 | $18,023 | $25,041 | $18,063 | $28,128 | $50,877 | $18,813 | $29,974 | $19,106 | $24,279 | $14,593 | $27,756 | |
| Expenditures | Month 1 | Month 2 | Month 3 | Month 4 | Month 5 | Month 6 | Month 7 | Month 8 | Month 9 | Month 10 | Month 11 | Month 12 | |
| Expenditures from Operations | |||||||||||||
| Cash Spending | $12,580 | $13,390 | $13,795 | $14,515 | $14,515 | $14,515 | $14,515 | $14,515 | $14,515 | $14,515 | $14,515 | $14,515 | |
| Bill Payments | $240 | $7,334 | $10,800 | $8,767 | $10,125 | $9,777 | $14,871 | $7,995 | $9,918 | $8,929 | $8,978 | $8,984 | |
| Subtotal Spent on Operations | $12,820 | $20,724 | $24,595 | $23,282 | $24,640 | $24,292 | $29,386 | $22,510 | $24,433 | $23,444 | $23,493 | $23,499 | |
| Additional Cash Spent | |||||||||||||
| Sales Tax, VAT, HST/GST Paid Out | $0 | $0 | $0 | $0 | $0 | $0 | $0 | $0 | $0 | $0 | $0 | $0 | |
| Principal Repayment of Current Borrowing | $0 | $0 | $0 | $0 | $0 | $0 | $0 | $0 | $0 | $0 | $0 | $0 | |
| Other Liabilities Principal Repayment | $0 | $0 | $0 | $0 | $0 | $0 | $0 | $0 | $0 | $0 | $0 | $0 | |
| Long-term Liabilities Principal Repayment | $0 | $0 | $0 | $0 | $0 | $0 | $0 | $0 | $0 | $0 | $0 | $0 | |
| Purchase Other Current Assets | $0 | $0 | $0 | $0 | $0 | $0 | $0 | $0 | $0 | $0 | $0 | $0 | |
| Purchase Long-term Assets | $0 | $0 | $0 | $0 | $0 | $0 | $0 | $0 | $0 | $0 | $0 | $0 | |
| Dividends | $0 | $0 | $0 | $0 | $0 | $0 | $0 | $0 | $0 | $0 | $0 | $0 | |
| Subtotal Cash Spent | $12,820 | $20,724 | $24,595 | $23,282 | $24,640 | $24,292 | $29,386 | $22,510 | $24,433 | $23,444 | $23,493 | $23,499 | |
| Net Cash Flow | ($3,174) | ($2,701) | $446 | ($5,219) | $3,488 | $26,585 | ($10,573) | $7,464 | ($5,328) | $835 | ($8,900) | $4,257 | |
| Cash Balance | $21,826 | $19,125 | $19,571 | $14,351 | $17,839 | $44,424 | $33,851 | $41,315 | $35,987 | $36,822 | $27,922 | $32,179 | |
| Pro Forma Balance Sheet | |||||||||||||
| Month 1 | Month 2 | Month 3 | Month 4 | Month 5 | Month 6 | Month 7 | Month 8 | Month 9 | Month 10 | Month 11 | Month 12 | ||
| Assets | Starting Balances | ||||||||||||
| Current Assets | |||||||||||||
| Cash | $25,000 | $21,826 | $19,125 | $19,571 | $14,351 | $17,839 | $44,424 | $33,851 | $41,315 | $35,987 | $36,822 | $27,922 | $32,179 |
| Accounts Receivable | $0 | $839 | $2,376 | $3,615 | $3,465 | $3,650 | $6,487 | $5,587 | $3,626 | $3,701 | $3,402 | $2,989 | $3,346 |
| Inventory | $1,500 | $920 | $2,060 | $1,757 | $1,571 | $1,433 | $4,513 | $3,165 | $2,567 | $1,904 | $1,549 | $1,386 | $1,686 |
| Other Current Assets | $0 | $0 | $0 | $0 | $0 | $0 | $0 | $0 | $0 | $0 | $0 | $0 | $0 |
| Total Current Assets | $26,500 | $23,585 | $23,561 | $24,943 | $19,388 | $22,923 | $55,424 | $42,603 | $47,509 | $41,592 | $41,773 | $32,297 | $37,211 |
| Long-term Assets | |||||||||||||
| Long-term Assets | $8,500 | $8,500 | $8,500 | $8,500 | $8,500 | $8,500 | $8,500 | $8,500 | $8,500 | $8,500 | $8,500 | $8,500 | $8,500 |
| Accumulated Depreciation | $0 | $167 | $334 | $501 | $668 | $835 | $1,002 | $1,169 | $1,336 | $1,503 | $1,670 | $1,837 | $2,004 |
| Total Long-term Assets | $8,500 | $8,333 | $8,166 | $7,999 | $7,832 | $7,665 | $7,498 | $7,331 | $7,164 | $6,997 | $6,830 | $6,663 | $6,496 |
| Total Assets | $35,000 | $31,918 | $31,727 | $32,942 | $27,220 | $30,588 | $62,922 | $49,934 | $54,673 | $48,589 | $48,603 | $38,960 | $43,707 |
| Liabilities and Capital | Month 1 | Month 2 | Month 3 | Month 4 | Month 5 | Month 6 | Month 7 | Month 8 | Month 9 | Month 10 | Month 11 | Month 12 | |
| Current Liabilities | |||||||||||||
| Accounts Payable | $0 | $6,972 | $10,509 | $8,429 | $9,806 | $9,273 | $14,607 | $7,663 | $9,621 | $8,630 | $8,680 | $8,630 | $10,281 |
| Current Borrowing | $0 | $0 | $0 | $0 | $0 | $0 | $0 | $0 | $0 | $0 | $0 | $0 | $0 |
| Other Current Liabilities | $0 | $0 | $0 | $0 | $0 | $0 | $0 | $0 | $0 | $0 | $0 | $0 | $0 |
| Subtotal Current Liabilities | $0 | $6,972 | $10,509 | $8,429 | $9,806 | $9,273 | $14,607 | $7,663 | $9,621 | $8,630 | $8,680 | $8,630 | $10,281 |
| Long-term Liabilities | $0 | $0 | $0 | $0 | $0 | $0 | $0 | $0 | $0 | $0 | $0 | $0 | $0 |
| Total Liabilities | $0 | $6,972 | $10,509 | $8,429 | $9,806 | $9,273 | $14,607 | $7,663 | $9,621 | $8,630 | $8,680 | $8,630 | $10,281 |
| Paid-in Capital | $70,000 | $70,000 | $70,000 | $70,000 | $70,000 | $70,000 | $70,000 | $70,000 | $70,000 | $70,000 | $70,000 | $70,000 | $70,000 |
| Accumulated Surplus/Deficit | ($35,000) | ($35,000) | ($35,000) | ($35,000) | ($35,000) | ($35,000) | ($35,000) | ($35,000) | ($35,000) | ($35,000) | ($35,000) | ($35,000) | ($35,000) |
| Surplus/Deficit | $0 | ($10,054) | ($13,783) | ($10,487) | ($17,586) | ($13,685) | $13,316 | $7,271 | $10,052 | $4,960 | $4,923 | ($4,670) | ($1,574) |
| Total Capital | $35,000 | $24,946 | $21,218 | $24,513 | $17,414 | $21,315 | $48,316 | $42,271 | $45,052 | $39,960 | $39,923 | $30,330 | $33,426 |
| Total Liabilities and Capital | $35,000 | $31,918 | $31,727 | $32,942 | $27,220 | $30,588 | $62,922 | $49,934 | $54,673 | $48,589 | $48,603 | $38,960 | $43,707 |
| Net Worth | $35,000 | $24,946 | $21,217 | $24,513 | $17,414 | $21,315 | $48,315 | $42,271 | $45,052 | $39,960 | $39,922 | $30,330 | $33,426 |

