
ArtSphere
Executive Summary
The ArtSphere Gallery School of Art (ArtSphere) began its operations in September of this year after expanding from its former back room into the full 787 square foot facility on the corner of Main and 1st Streets in Birmingham, AL. Since September the business has grown substantially, but in an unordered way. This business plan is being written to set a rational framework for growth to maximize profit potential. Successful realization of this plan will produce increasing profits annually by the end of the third year.
Keys to success and critical factors are, in order of importance:
- Penetration into the day-time market for art lessons.
- Completing some alterations to premises.
- Making changes to certain operational and pricing practices.
- Making sale of art supplies an additional profit source.

1.1 Objectives
The greatest opportunity for the ArtSphere is through the teaching of art to paying customers. The capacity to do this is limited in size to approximately eight persons at one time. The most important objective is to successfully penetrate the 9 A.M. to 3 P.M. day-time market. This is the largest portion of ArtSphere’s teaching capacity (61%). This offers without any doubt the most important element in the future development of profits. The prime objective is to gradually increase penetration of this market sector from its present near zero level to 90% of full capacity by the end of second year.
As the afternoon market sector (22% of total capacity) is already nearly fully booked, a secondary objective is to fill the evening hours (Monday through Thursday) 7:30 P.M. to 9:30 P.M. These eight hours are easier to fill. This goal should be reached by the end of Month 5.
A further objective is to separate art supplies from art lessons, so as to make the sale of art supplies a separate profit center.
A final objective is to maintain the present level of portrait work, produced under contract by clients, as well as maintain the historical level of sales of art work created by the owners of ArtSphere prior to the recent mushrooming of art instruction.
1.2 Mission
The ArtSphere is dedicated to providing competent, professional instruction in art in friendly, pleasant surroundings while catering to the varying needs of different target market groups. The ArtSphere tries to cultivate a more personal and longer term relationship with the customer than can be achieved by a typical six session generic art course taught at Bessemer State College. The ArtSphere recognizes that the real product it sells is different from the art instruction given. Helena Rubenstein is quoted as saying, “in the factory we manufacture cosmetics, but the product we sell is called ‘hope.'”
This thinking holds true at the ArtSphere. The product sold is viewed differently by different buyers. A serious young student with potential may need special help in compiling his portfolio when applying to art school. A retired 70 year-old woman may be seeking a fun way to fill up an otherwise empty day. A stress-ridden executive may be seeking solace and relaxation. Encouragement, technical advice, stress-relief, escape from loneliness, self-expression, etc. are just some of the products sold by the ArtSphere. The owners of the ArtSphere recognize that art lessons can be had at less than $5.00/hour in some state college evening courses. The ArtSphere cannot attempt to compete with these prices. It is only by tailoring the “real” product sought by customers that we will create and maintain a high level of sales.
1.3 Keys to Success
The most important element to success is how skillfully the owners can tailor the product to suit the varying needs (emotional, psychological, technical, etc.) of its customers.
- The limited spaces (maximum of eight) have no shelf life. They are like airplane seats: A 10 o’clock space unsold today is lost forever. It is essential, to avoid the problem of “no-shows,” that customers be signed up on a monthly basis, payable in advance. This does not preclude the possibility of switching time slots. “Walk-ins” can still be accommodated, based on availability, but these “products” must be sold at a premium to encourage customers to sign up.
- Like most businesses, it is key to recognize and encourage the “heavy user.” A “heavy user” would be someone happy to work at his easel two to three hours at a time, several times a week. If, however, an hour art lesson does not come to a signaled end, for example, lights being turned off, then the customer may simply continue working for hours. It is important to arrange a signaled end to a lesson by collecting students’ canvases to store them for the next session. Those wanting a longer session need only enroll for a longer period. Only in this manner can the owners profit from the “heavy user.”
- Both owners are artistic and at times reluctant to insist on certain policies designed to encourage profitability. A willingness to be flexible in this department is key to the success of this plan.
- The special nature of the product does not allow for it to be purchased on a “take-out” basis. It must be consumed on the premises. Therefore it is absolutely essential to create and maintain an environment in keeping with the special needs of customers. Ugly clutter, adequate lighting, clean-up and smoking policies, comfortable seating, etc. all must be addressed. The location of the ArtSphere within sight of the harbor and the town landing has all the potential for superior atmosphere compared to a typical rectangular classroom at a state college.
Company Summary
The “ArtSphere” was registered DBA jointly in the names of Paul and Hannah Nash several years ago.
The ArtSphere is located on the corner of Main and 1st Streets in Birmingham, AL. facing the town’s public landing. Approximately 75 students, mostly adolescents, are signed up for lessons at $10/hour which includes materials. The recently increased facilities have made possible an increase in the number of students. Lessons are offered a total of 49 hours weekly. Maximum capacity is considered eight at any one time, which works out to a possible sales potential of 392 learning hours/week. Limiting to eight students at any one time allows sufficient room for each student to sit or stand comfortably at an easel.
As penetration into the 9 A.M. to 3 P.M. market increases, Hannah will give up her teaching position in a pre-school and concentrate on the ArtSphere. Hannah also paints portraits on a contractual basis for customers (approximately $800 per month). This activity will continue unchanged, but will take place on weekends when classes are not offered. Paul Nash’s artwork will continue as well, also with concentration on weekends.
Saturdays and Sundays are when students’ and owners’ artwork is displayed in the Gallery; buyers and interested potential students are encouraged to come in the Gallery, have a cup of espresso, and watch an artist at work.
2.1 Company Ownership
The ArtSphere is registered DBA jointly under the names of Paul and Hannah Nash. Earnings are taxed according to the personal tax rate schedule.
Paul Nash graduated with a BFA degree from Boston University in 1977. He has been painting since 1970 and teaching since 1980. His work has been featured at many group shows and sometimes at one-man shows such as at the Court Street Gallery in Bessema. Paul has sold seven pieces of his artwork during the past 12 months. Paul is also the owner of “ArtSphere Productions” located in Beverly. “ArtSphere Productions” is involved in film/video production and editing.

Hannah Rogerson Nash graduated from Bessemer High and attended Bessemer State College, Rhode Island School of Design. She has extensive experience in painting, specializing in portrait and still life. She has sold 11 pieces of her work during the past 12 months. Her work is known under her maiden name Rogerson. Her teaching skills are widely recognized, having taught pre-school in Europe as well as locally. She is presently employed at the Orchard School in Birmingham, AL. where she has been a teacher since 1993. In addition, Hannah worked from 1984-1993 as a self-employed photo retoucher.
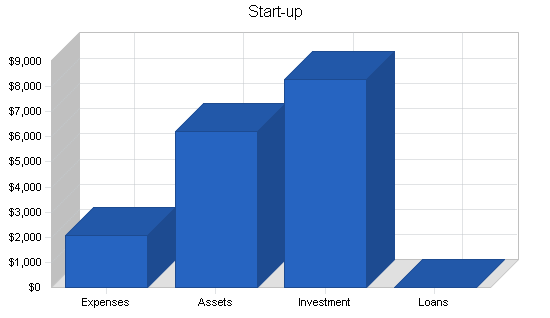
2.2 Start-up Summary
Our planned expenses for our first full year are shown in the following chart and table.
| Start-up Funding | |
| Start-up Expenses to Fund | $2,065 |
| Start-up Assets to Fund | $6,200 |
| Total Funding Required | $8,265 |
| Assets | |
| Non-cash Assets from Start-up | $6,200 |
| Cash Requirements from Start-up | $0 |
| Additional Cash Raised | $0 |
| Cash Balance on Starting Date | $0 |
| Total Assets | $6,200 |
| Liabilities and Capital | |
| Liabilities | |
| Current Borrowing | $0 |
| Long-term Liabilities | $0 |
| Accounts Payable (Outstanding Bills) | $0 |
| Other Current Liabilities (interest-free) | $0 |
| Total Liabilities | $0 |
| Capital | |
| Planned Investment | |
| Principals | $8,265 |
| Investor 2 | $0 |
| Other | $0 |
| Additional Investment Requirement | $0 |
| Total Planned Investment | $8,265 |
| Loss at Start-up (Start-up Expenses) | ($2,065) |
| Total Capital | $6,200 |
| Total Capital and Liabilities | $6,200 |
| Total Funding | $8,265 |
| Start-up | |
| Requirements | |
| Start-up Expenses | |
| Legal (DBA Register) | $25 |
| Stationery, etc. | $500 |
| Brochures | $300 |
| Consultants | $950 |
| Coffee Maker | $200 |
| Cordless Phone | $90 |
| Expensed Equipment | $0 |
| Other | $0 |
| Total Start-up Expenses | $2,065 |
| Start-up Assets | |
| Cash Required | $0 |
| Start-up Inventory | $0 |
| Other Current Assets | $0 |
| Long-term Assets | $6,200 |
| Total Assets | $6,200 |
| Total Requirements | $8,265 |
2.3 Company Locations and Facilities
The ArtSphere is located on the corner of Main and 1st Streets in Birmingham, AL. Total square footage comes to 787, with two doors onto the street. The facilities at this location are leased from the owners, John Smith and Andrew Abbot, at a monthly rate of $1,225. Electricity runs about $50/month, and gas about $600 annually. The lessors have indicated their intentions to sell the property and have entered into negotiations with the owners of the ArtSphere. The asking price is $148,000. The unit is one of six units of 1st Street Wharf Condominium Trust which has recently undertaken an extensive condition-of-building study prepared by professional consultants. Current plans are to renovate the 1st Street side of the building including new siding, new corner boards, and paint. The Trustees of FSWCT are committed to a high standard of maintenance.
Products and Services
The ArtSphere is expanding its offerings. Our primary focus is now on offering art instruction classes. We will tailor our classes by market segment and time of day, providing instructional opportunities during the morning and mid-day, after school sessions, and evening classes.
We will have a wide range of art supplies available to complement student sessions as well as for sale to the general public.
Additionally, the owners will continue to show and sell their own work in the Gallery, as well as produce commission portraits and other work.
Market Analysis Summary
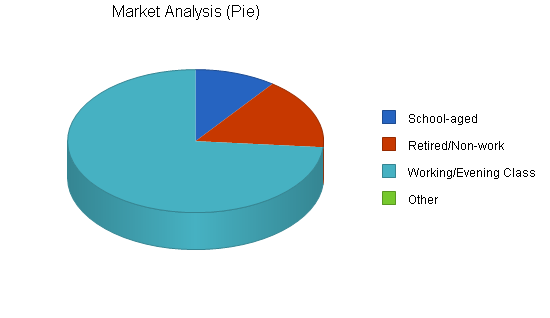
The offerings by ArtSphere require, by their very nature, an investment of time on the part of the purchaser. Three customer groups have been identified based on the availability of time on their part:
- School-aged (over 10 yrs).
- Retired/non-working.
- Working/evening class.
This accounts for virtually everyone in Birmingham, AL older than 10 yet younger than 75. It would be more accurate to state that these people will seek, during their respective free hours, some hobby, some pleasant, time-filling activity, or other form of relaxation.
4.1 Market Segmentation
| Market Group | Time Slot | Size of Market |
| School-Aged (Over 10 years) | 3:30 P.M. to 5:30 P.M. | 1,666 |
| Retired/Non-Working | 9 A.M. to 3 P.M. | 2,645 |
| Working/Evening Class | 7 P.M. to 9 P.M. | 12,042 |
| TOTAL | All time slots | 16,353 |
The total figure of 16,353 accounts for virtually everyone in Birmingham, AL older than 10 yet younger than 75. Even though there are people older than 75 and younger than 10 who actually take art lessons, the market analysis should not be taken to mean that 16,353 persons in Birmingham, AL are in search of art instruction.
| Market Analysis | |||||||
| Year 1 | Year 2 | Year 3 | Year 4 | Year 5 | |||
| Potential Customers | Growth | CAGR | |||||
| School-aged | 1% | 1,666 | 1,683 | 1,700 | 1,717 | 1,734 | 1.01% |
| Retired/Non-work | 7% | 2,645 | 2,830 | 3,028 | 3,240 | 3,467 | 7.00% |
| Working/Evening Class | 9% | 12,042 | 13,126 | 14,307 | 15,595 | 16,999 | 9.00% |
| Other | 0% | 0 | 0 | 0 | 0 | 0 | 0.00% |
| Total | 7.94% | 16,353 | 17,639 | 19,035 | 20,552 | 22,200 | 7.94% |
4.2 Target Market Segment Strategy
Our ultimate goal is to fill all of our scheduled class offerings and fully utilize our newly expanded teaching space. To do that we have looked at the daily time periods when we wished to teach, and then identified the market segment most likely to seek art instruction during those times. We then tailored our class offerings to appeal to the interests and life styles of those people.
We then priced the classes competitively for adults and children and then grouped the lessons into prepaid monthly blocks to fit peoples’ various budgetary needs.
4.2.1 Market Needs
There currently is a need in Birmingham for regularly scheduled, moderately priced, locally sited art instruction classes, available at different times of the day. Existing venues are either fully booked and unable to serve a larger market segment, are membership groups, or are sideline businesses.
The people of Birmingham need more art instructional opportunities, especially ones focused and tailored to the interests, skill levels and time availabilities of the students.
4.3 Service Business Analysis
Art instruction is offered in several ways:
Artists who teach classes
- To supplement or support their own fine art endeavors.
- Sideline businesses.
- Poor setting, usually taught in “extra” or crowded space.
- Limited class offerings.
- Prices vary.
Private tutors
- Very focused instruction for serious students.
- Expensive.
Arts associations/museums
- Offer classes to members or the general public.
- Limited offerings.
- Often taught by volunteers.
- Prices generally affordable. May vary with membership.
Galleries
- Employ artist instructors – classes are marketing tool.
- Sponsor classes by artists currently displayed.
- Class offerings often limited to gallery’s genre.
- Prices vary.
Schools and Colleges
- Classes may be academia focused.
- Travel may be necessary.
- Time slot offerings may be limited.
- Long term committment to class.
- Prices may vary.
4.3.1 Main Competitors
Outside of the ArtSphere there are other locations in Birmingham where art lessons are available:
ART SCHOOL OF BIRMINGHAM
This school is located in a room of the Professional Building at 1331 Milgray Lane. Paul Nash has been teaching there in the evenings and on Saturday mornings since 1975. He has room for about 12-15 and teaches a structured approach. Paul is well-known within the town, having taught art on the local TV channel. The main thrust of his business appears to be his portrait business which is located on School Street across from the Cafe Roma. Lessons are sold in blocks of four for $56. Each lesson is an hour and one half.
Paul mentioned that his classes are generally booked up. He does not offer lessons during the day.
The Art School of Birmingham is listed in the Yellow Pages, Nash’s artwork is shown in several local galleries, and as a teacher, he gives a convincing impression of professionalism when talking about his teaching method.
BIRMINGHAM ART WORKS
Hannah Rogerson Nash has a studio located on the second floor of the same School Street building which houses Paul Nash’s portrait studio. Hannah has, using her own description, a very unstructured approach to teaching art. She is willing to teach anything a person might want to learn. Her Friday afternoons are completely occupied with children, but other than then she is wide open. She did mention teaching two women and a 12-year-old. No schedule of classes or fees is posted outside her studio door and she is not listed in the Yellow Pages. She has placed a small ad in the local paper offering an “Art Workshop.” Within the same ad she offers “orchids, plants, & plant care” indicating that art lessons are not her major line. She mentioned on the phone a price of $20 for a two hour group lesson and $30 for a private lesson. Being able to offer a “private” lesson would indicate a rather light teaching load.
BIRMINGHAM ARTS ASSOCIATION
Birmingham Arts offers a selection of four art classes during the day. They are described in their news letter which is mailed out only to members. Enrollment in the classes does not always reach the cut-off point of six in which case the class is cancelled. A typical class is two hours one morning a week, and runs for six weeks. Cost is $84 for members, slightly more for non-members. This works out to $7.00 per instruction hour.
There are also some courses offered in near-by Bessemer:
BESSEMER STATE COLLEGE
The Bessemer State College Community Enrichment Program offers several art classes in the evenings. A typical class (Introduction to Drawing) is offered Thursday evenings from 7:00P.M. to 9:30 P.M. and costs $68 for six sessions. Average cost works out to be about $4.50 per instruction hour. Notification of these courses is mailed to all residential addresses in Birmingham.
Strategy and Implementation Summary
The ArtSphere recognizes that the real product it sells is different from the art instruction given. Helena Rubenstein is quoted as saying, “in the factory we manufacture cosmetics, but the product we sell is called ‘hope.'”
This thinking holds true at the ArtSphere. The product sold is viewed differently by different buyers. A serious young student with potential may need special help in compiling his portfolio when applying to art school. A retired 70 year-old woman may be seeking a fun way to fill up an otherwise empty day. A stress-ridden executive may be seeking solace and relaxation. Encouragement, technical advice, stress-relief, escape from loneliness, self-expression, etc are just some of the products sold by the ArtSphere. The owners of the ArtSphere recognize that art lessons can be had at less than $5.00/hour in some state college evening courses. The ArtSphere cannot attempt to compete with these prices. It is only by tailoring the “real” product sought by customers that we will create and maintain a high level of sales.
5.1 Competitive Edge
There are many facets of the ArtSphere which make it a top-notch competitor in the art class business, a few are outlined below:
- All day multi-time slot schedule.
- Classes tailored to market segment.
- Two instructors.
- Dedicated instructional space
- Art supplies available on-site.
- Gallery venue for student artwork exhibits.
- High profile location.
5.2 Marketing Strategy
When comparing the market segment table below with ArtSphere’s available capacity, it is evident which direction the marketing thrust should take:
| Market Group | Time Slot | Capacity |
Instruction Hours |
| School-Aged (Over 10 yrs.) | 3:30 P.M. to 5:30 P.M. | 1,666 |
88 (11 hrs X 8 easels) |
|
Retired/Non-Working |
9 A.M. to 3 P.M. | 2,645 |
240 (30 hrs X 8) |
| Working/Evening Class | 7 P.M. to 9 P.M. | 12,042 |
64 (8 hrs X 8) |
The school-age market group with its potential market size of 1,666 has within the space of a couple months of operation taken up nearly all the limited 88 teaching hours of capacity for that time slot with some spill-over into the smaller evening class time period. This latter time period in the evening should be the easiest to fill considering its potential market of 12,042.
Clearly, the marketing strategy at ArtSphere needs to be concentrated on the biggest time slot, the 9 A.M. to 3 P.M. period. As of this writing, nearly all of the 8 easels are unoccupied Monday through Friday.
5.3 Sales Strategy
The ArtSphere has no sales force outside of its owners, Paul and Hannah, who will close the deals with interested customers created by actions of the marketing strategy. Many of the initial contacts will come via telephone inquiries responding to the offer of a free art lesson. Whoever takes the call should draw out the calling party and jot down a brief profile. Developing a sixth sense for the goals of the customer (stress relief, find new hobby, etc.) is key. If a customer is looking for stress-relief, then peaceful surroundings are essential. That potential customer should not be given his or her first free lesson during a crowded time slot, but rather when things at the studio are quiet and less active. Someone looking to escape boredom on the other hand should be scheduled when there are more people in the studio. A conscious decision also needs to be made concerning which teacher the caller is likely to relate to. If a caller does not come in for the offered free lesson, a follow-up call should be made by one of the owners. There is a direct relationship between the number of free lessons given and the number of people who will sign up.
Directly upon completion of the free lesson, an unabrasive effort should be made to effect a sign-up. If the person does not sign up, a follow-up call should be made. If Paul gave the free lesson, Hannah should make the follow-up call. It could be that the potential customer will respond better to the other teacher.
Walk-in inquiries should be handled in a similar fashion. Brochures containing particulars and an up-to-date price schedule should be available in a box by the door. Because of the studio’s high-profile location with large picture windows facing onto a busy pedestrian area, it is common for passers-by to look in. Good salesmanship will result is developing an ability to differentiate the interested from the merely curious. It is important not to be shy with interested parties. If the same person is noticed frequently looking in the window, or picks up a brochure and scans it, one of the owners must make a sales approach, even if it means opening the door and inviting the person in. Offer a cup of coffee, try to form a rough profile and offer to set up a time for a free lesson.
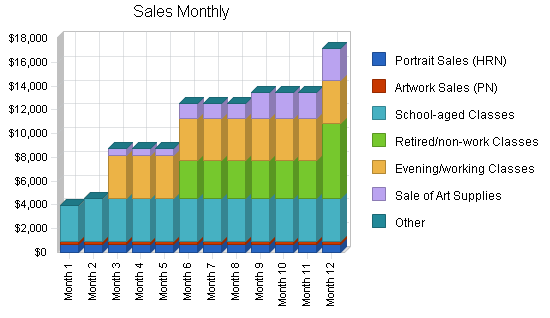
5.3.1 Sales Forecast
It is assumed that Hannah’s portrait contracts will continue at historical levels (1/month @ ave. price $650).
Sale of Paul Nash’s artwork will continue at historical levels ($3,600 annually, spread out evenly).
School-aged art lessons represent only 88 instruction hours/week taking up the 3:30 P.M. to 5:30 P.M. time slots each day (6:30 P.M. on Fridays). These slots are nearly all filled now. It is assumed that these hours will remain full throughout the year. Assume 75 of the possible 88 will be filled each week, four weeks/month at a sales price of $10/hour lesson.
The retired/non-work art classes will begin to grow after the planned renovations scheduled for January. Projections assume that price for four 90 minute instruction sessions will be $79. Sales to begin in March starting with the one fully booked 90-minute lesson daily Monday-Friday. These classes will have eight students each. A second daily class will be formed six months later, and after one year, there will be a third. This will bring this section of ArtSphere capacity up to 75% (four and one half of six hrs/day, or 180 instruction hours out of 240 possible). Assume each month to contain four weeks exactly.
This sector at the moment is practically nil. Growth depends on completion of modifications to premises, and success in ArtSphere’s marketing approach to this group.
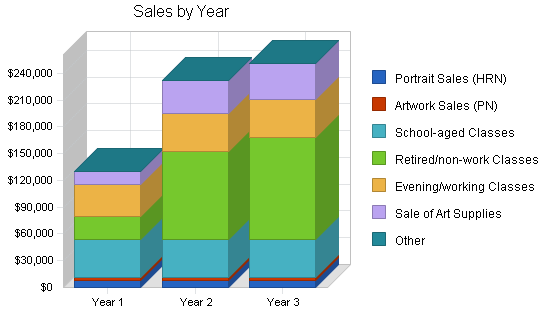
| Sales Forecast | |||
| Year 1 | Year 2 | Year 3 | |
| Sales | |||
| Portrait Sales (HRN) | $7,800 | $7,800 | $7,800 |
| Artwork Sales (PN) | $3,600 | $3,600 | $3,600 |
| School-aged Classes | $42,600 | $42,600 | $42,600 |
| Retired/non-work Classes | $25,280 | $97,960 | $113,760 |
| Evening/working Classes | $35,840 | $43,008 | $43,008 |
| Sale of Art Supplies | $14,800 | $37,080 | $40,080 |
| Other | $0 | $0 | $0 |
| Total Sales | $129,920 | $232,048 | $250,848 |
| Direct Cost of Sales | Year 1 | Year 2 | Year 3 |
| Portrait Sales (HRN) | $1,170 | $1,170 | $1,170 |
| Artwork Sales (PN) | $540 | $540 | $540 |
| School-aged Classes | $2,160 | $0 | $0 |
| Retired/non-work Classes | $0 | $0 | $0 |
| Evening/working Classes | $0 | $0 | $0 |
| Sale of Art Supplies | $10,360 | $25,956 | $28,056 |
| Other | $0 | $0 | $0 |
| Subtotal Direct Cost of Sales | $14,230 | $27,666 | $29,766 |
5.3.2 Sales Programs
- Classes will be offered in many time slots throughout the day and evening, with instruction tailored to the customers.
- A wide variety of art supplies will be available for purchase by students during their classes, and by the general public.
- Hannah will continue her commission portrait work and exhibit in the gallery.
- Paul will continue to produce his artwork and exhibit and sell in the gallery.
- Weekend gallery exhibitions of owners’ and students’ work will encourage the sale of finished works and supplies and registration of new students.
5.4 Milestones
We have set some milestones to help us focus on needed projects and to keep us on track to complete them.
| Milestones | |||||
| Milestone | Start Date | End Date | Budget | Manager | Department |
| New Flooring | 9/1/1997 | 9/1/1997 | $2,800 | PN & HRN | N/A |
| Storage Racks for Canvases | 4/1/1997 | 4/1/1997 | $1,000 | PN & HRN | N/A |
| Yellow Pages Ad | 3/9/1997 | 3/9/1997 | $65 | PN & HRN | N/A |
| Seating for Seniors | 4/1/1997 | 4/1/1997 | $750 | PN & HRN | N/A |
| Printing, L-head, Brochure | 2/15/1997 | 2/15/1997 | $800 | PN & HRN | N/A |
| Brochure at Yankee D., etc. | 4/1/1997 | 4/1/1997 | $0 | PN & HRN | N/A |
| Open House Plans | 4/1/1997 | 4/1/1997 | $0 | PN & HRN | N/A |
| Ads Formulation (Spring Off) | 4/15/1997 | 4/15/1997 | $0 | PN & HRN | N/A |
| Finished Ads (Two Types) | 5/1/1997 | 5/1/1997 | $0 | PN & HRN | N/A |
| Finalize Spring Offensive | 5/1/1997 | 5/1/1997 | $0 | PN & HRN | N/A |
| Totals | $5,415 | ||||
Management Summary
The ArtSphere is owned and operated by Paul Nash and Hannah Rogerson Nash. There are no plans to hire any employees.
Initially, Paul will provide the bulk of instruction. Hannah is currently employed at the Orchard School in Birmingham, and as ArtSphere’s class offerings fill, she intends to leave Orchard School to concentrate fully on ArtSphere.
Hannah and Paul will take minimal salaries during this start-up period to ensure adequate cash flow and cash balance.
| Personnel Plan | |||
| Year 1 | Year 2 | Year 3 | |
| Hannah | $16,000 | $26,400 | $22,990 |
| Paul | $20,000 | $26,400 | $29,040 |
| Other | $0 | $0 | $0 |
| Total People | 0 | 0 | 0 |
| Total Payroll | $36,000 | $52,800 | $52,030 |
Financial Plan
The following subtopics present our financial plan.
7.1 Break-even Analysis
The following table and chart summarize our break-even analysis.

| Break-even Analysis | |
| Monthly Revenue Break-even | $6,673 |
| Assumptions: | |
| Average Percent Variable Cost | 11% |
| Estimated Monthly Fixed Cost | $5,942 |
7.2 Projected Profit and Loss
Our projected profit and loss is shown in the following table and charts.


| Pro Forma Profit and Loss | |||
| Year 1 | Year 2 | Year 3 | |
| Sales | $129,920 | $232,048 | $250,848 |
| Direct Cost of Sales | $14,230 | $27,666 | $29,766 |
| Other | $0 | $0 | $0 |
| Total Cost of Sales | $14,230 | $27,666 | $29,766 |
| Gross Margin | $115,690 | $204,382 | $221,082 |
| Gross Margin % | 89.05% | 88.08% | 88.13% |
| Expenses | |||
| Payroll | $36,000 | $52,800 | $52,030 |
| Sales and Marketing and Other Expenses | $11,129 | $21,626 | $23,876 |
| Depreciation | $1,892 | $2,067 | $2,067 |
| Leased Equipment | $0 | $0 | $0 |
| Utilities (Gas & Elec.) | $1,642 | $1,642 | $1,642 |
| Insurance | $540 | $540 | $540 |
| Rent | $14,700 | $14,700 | $14,700 |
| Payroll Taxes | $5,400 | $7,920 | $7,805 |
| Other | $0 | $0 | $0 |
| Total Operating Expenses | $71,303 | $101,295 | $102,660 |
| Profit Before Interest and Taxes | $44,387 | $103,087 | $118,423 |
| EBITDA | $46,279 | $105,154 | $120,490 |
| Interest Expense | $0 | $0 | $0 |
| Taxes Incurred | $15,508 | $36,080 | $40,954 |
| Net Profit | $28,879 | $67,007 | $77,468 |
| Net Profit/Sales | 22.23% | 28.88% | 30.88% |
7.3 Projected Cash Flow
The following chart and table show our projected cash flow.

| Pro Forma Cash Flow | |||
| Year 1 | Year 2 | Year 3 | |
| Cash Received | |||
| Cash from Operations | |||
| Cash Sales | $129,920 | $232,048 | $250,848 |
| Subtotal Cash from Operations | $129,920 | $232,048 | $250,848 |
| Additional Cash Received | |||
| Sales Tax, VAT, HST/GST Received | $0 | $0 | $0 |
| New Current Borrowing | $0 | $0 | $0 |
| New Other Liabilities (interest-free) | $0 | $0 | $0 |
| New Long-term Liabilities | $0 | $0 | $0 |
| Sales of Other Current Assets | $0 | $0 | $0 |
| Sales of Long-term Assets | $0 | $0 | $0 |
| New Investment Received | $0 | $0 | $0 |
| Subtotal Cash Received | $129,920 | $232,048 | $250,848 |
| Expenditures | Year 1 | Year 2 | Year 3 |
| Expenditures from Operations | |||
| Cash Spending | $36,000 | $52,800 | $52,030 |
| Bill Payments | $57,136 | $111,363 | $119,017 |
| Subtotal Spent on Operations | $93,136 | $164,163 | $171,047 |
| Additional Cash Spent | |||
| Sales Tax, VAT, HST/GST Paid Out | $0 | $0 | $0 |
| Principal Repayment of Current Borrowing | $0 | $0 | $0 |
| Other Liabilities Principal Repayment | $0 | $0 | $0 |
| Long-term Liabilities Principal Repayment | $0 | $0 | $0 |
| Purchase Other Current Assets | $0 | $0 | $0 |
| Purchase Long-term Assets | $0 | $0 | $0 |
| Dividends | $0 | $0 | $0 |
| Subtotal Cash Spent | $93,136 | $164,163 | $171,047 |
| Net Cash Flow | $36,784 | $67,885 | $79,801 |
| Cash Balance | $36,784 | $104,669 | $184,470 |
7.4 Projected Balance Sheet
The following table outlines our projected balance sheet.
| Pro Forma Balance Sheet | |||
| Year 1 | Year 2 | Year 3 | |
| Assets | |||
| Current Assets | |||
| Cash | $36,784 | $104,669 | $184,470 |
| Inventory | $2,267 | $4,407 | $4,741 |
| Other Current Assets | $0 | $0 | $0 |
| Total Current Assets | $39,050 | $109,076 | $189,211 |
| Long-term Assets | |||
| Long-term Assets | $6,200 | $6,200 | $6,200 |
| Accumulated Depreciation | $1,892 | $3,959 | $6,026 |
| Total Long-term Assets | $4,308 | $2,241 | $174 |
| Total Assets | $43,358 | $111,317 | $189,385 |
| Liabilities and Capital | Year 1 | Year 2 | Year 3 |
| Current Liabilities | |||
| Accounts Payable | $8,280 | $9,231 | $9,832 |
| Current Borrowing | $0 | $0 | $0 |
| Other Current Liabilities | $0 | $0 | $0 |
| Subtotal Current Liabilities | $8,280 | $9,231 | $9,832 |
| Long-term Liabilities | $0 | $0 | $0 |
| Total Liabilities | $8,280 | $9,231 | $9,832 |
| Paid-in Capital | $8,265 | $8,265 | $8,265 |
| Retained Earnings | ($2,065) | $26,814 | $93,820 |
| Earnings | $28,879 | $67,007 | $77,468 |
| Total Capital | $35,079 | $102,085 | $179,553 |
| Total Liabilities and Capital | $43,358 | $111,317 | $189,385 |
| Net Worth | $35,079 | $102,085 | $179,553 |
7.5 Business Ratios
The following table compares computed standard business rations for this plan against averaged ratios for the Fine Arts Schools industry, NAICS code 611610.
| Ratio Analysis | ||||
| Year 1 | Year 2 | Year 3 | Industry Profile | |
| Sales Growth | 0.00% | 78.61% | 8.10% | 4.59% |
| Percent of Total Assets | ||||
| Inventory | 5.23% | 3.96% | 2.50% | 2.25% |
| Other Current Assets | 0.00% | 0.00% | 0.00% | 36.99% |
| Total Current Assets | 90.06% | 97.99% | 99.91% | 44.98% |
| Long-term Assets | 9.94% | 2.01% | 0.09% | 55.02% |
| Total Assets | 100.00% | 100.00% | 100.00% | 100.00% |
| Current Liabilities | 19.10% | 8.29% | 5.19% | 23.64% |
| Long-term Liabilities | 0.00% | 0.00% | 0.00% | 33.36% |
| Total Liabilities | 19.10% | 8.29% | 5.19% | 57.00% |
| Net Worth | 80.90% | 91.71% | 94.81% | 43.00% |
| Percent of Sales | ||||
| Sales | 100.00% | 100.00% | 100.00% | 100.00% |
| Gross Margin | 89.05% | 88.08% | 88.13% | 100.00% |
| Selling, General & Administrative Expenses | 66.84% | 59.20% | 57.45% | 63.44% |
| Advertising Expenses | 2.10% | 1.24% | 1.15% | 4.51% |
| Profit Before Interest and Taxes | 34.16% | 44.42% | 47.21% | 3.46% |
| Main Ratios | ||||
| Current | 4.72 | 11.82 | 19.25 | 1.20 |
| Quick | 4.44 | 11.34 | 18.76 | 0.82 |
| Total Debt to Total Assets | 19.10% | 8.29% | 5.19% | 59.16% |
| Pre-tax Return on Net Worth | 126.54% | 100.98% | 65.95% | 4.27% |
| Pre-tax Return on Assets | 102.37% | 92.61% | 62.53% | 10.46% |
| Additional Ratios | Year 1 | Year 2 | Year 3 | |
| Net Profit Margin | 22.23% | 28.88% | 30.88% | n.a |
| Return on Equity | 82.33% | 65.64% | 43.14% | n.a |
| Activity Ratios | ||||
| Inventory Turnover | 9.47 | 8.29 | 6.51 | n.a |
| Accounts Payable Turnover | 7.90 | 12.17 | 12.17 | n.a |
| Payment Days | 27 | 28 | 29 | n.a |
| Total Asset Turnover | 3.00 | 2.08 | 1.32 | n.a |
| Debt Ratios | ||||
| Debt to Net Worth | 0.24 | 0.09 | 0.05 | n.a |
| Current Liab. to Liab. | 1.00 | 1.00 | 1.00 | n.a |
| Liquidity Ratios | ||||
| Net Working Capital | $30,771 | $99,844 | $179,379 | n.a |
| Interest Coverage | 0.00 | 0.00 | 0.00 | n.a |
| Additional Ratios | ||||
| Assets to Sales | 0.33 | 0.48 | 0.75 | n.a |
| Current Debt/Total Assets | 19% | 8% | 5% | n.a |
| Acid Test | 4.44 | 11.34 | 18.76 | n.a |
| Sales/Net Worth | 3.70 | 2.27 | 1.40 | n.a |
| Dividend Payout | 0.00 | 0.00 | 0.00 | n.a |
Appendix
| Sales Forecast | |||||||||||||
| Month 1 | Month 2 | Month 3 | Month 4 | Month 5 | Month 6 | Month 7 | Month 8 | Month 9 | Month 10 | Month 11 | Month 12 | ||
| Sales | |||||||||||||
| Portrait Sales (HRN) | 0% | $650 | $650 | $650 | $650 | $650 | $650 | $650 | $650 | $650 | $650 | $650 | $650 |
| Artwork Sales (PN) | 0% | $300 | $300 | $300 | $300 | $300 | $300 | $300 | $300 | $300 | $300 | $300 | $300 |
| School-aged Classes | 0% | $3,000 | $3,600 | $3,600 | $3,600 | $3,600 | $3,600 | $3,600 | $3,600 | $3,600 | $3,600 | $3,600 | $3,600 |
| Retired/non-work Classes | 0% | $0 | $0 | $0 | $0 | $0 | $3,160 | $3,160 | $3,160 | $3,160 | $3,160 | $3,160 | $6,320 |
| Evening/working Classes | 0% | $0 | $0 | $3,584 | $3,584 | $3,584 | $3,584 | $3,584 | $3,584 | $3,584 | $3,584 | $3,584 | $3,584 |
| Sale of Art Supplies | 0% | $0 | $0 | $640 | $640 | $640 | $1,240 | $1,240 | $1,240 | $2,140 | $2,140 | $2,140 | $2,740 |
| Other | 0% | $0 | $0 | $0 | $0 | $0 | $0 | $0 | $0 | $0 | $0 | $0 | $0 |
| Total Sales | $3,950 | $4,550 | $8,774 | $8,774 | $8,774 | $12,534 | $12,534 | $12,534 | $13,434 | $13,434 | $13,434 | $17,194 | |
| Direct Cost of Sales | Month 1 | Month 2 | Month 3 | Month 4 | Month 5 | Month 6 | Month 7 | Month 8 | Month 9 | Month 10 | Month 11 | Month 12 | |
| Portrait Sales (HRN) | $98 | $98 | $98 | $98 | $98 | $98 | $98 | $98 | $98 | $98 | $98 | $98 | |
| Artwork Sales (PN) | $45 | $45 | $45 | $45 | $45 | $45 | $45 | $45 | $45 | $45 | $45 | $45 | |
| School-aged Classes | $270 | $270 | $270 | $270 | $270 | $270 | $270 | $270 | $0 | $0 | $0 | $0 | |
| Retired/non-work Classes | $0 | $0 | $0 | $0 | $0 | $0 | $0 | $0 | $0 | $0 | $0 | $0 | |
| Evening/working Classes | $0 | $0 | $0 | $0 | $0 | $0 | $0 | $0 | $0 | $0 | $0 | $0 | |
| Sale of Art Supplies | $0 | $0 | $448 | $448 | $448 | $868 | $868 | $868 | $1,498 | $1,498 | $1,498 | $1,918 | |
| Other | $0 | $0 | $0 | $0 | $0 | $0 | $0 | $0 | $0 | $0 | $0 | $0 | |
| Subtotal Direct Cost of Sales | $413 | $413 | $861 | $861 | $861 | $1,281 | $1,281 | $1,281 | $1,641 | $1,641 | $1,641 | $2,061 | |
| Personnel Plan | |||||||||||||
| Month 1 | Month 2 | Month 3 | Month 4 | Month 5 | Month 6 | Month 7 | Month 8 | Month 9 | Month 10 | Month 11 | Month 12 | ||
| Hannah | 0% | $0 | $0 | $500 | $500 | $1,000 | $2,000 | $2,000 | $2,000 | $2,000 | $2,000 | $2,000 | $2,000 |
| Paul | 0% | $1,000 | $1,000 | $1,000 | $1,000 | $2,000 | $2,000 | $2,000 | $2,000 | $2,000 | $2,000 | $2,000 | $2,000 |
| Other | 0% | $0 | $0 | $0 | $0 | $0 | $0 | $0 | $0 | $0 | $0 | $0 | $0 |
| Total People | 0 | 0 | 0 | 0 | 0 | 0 | 0 | 0 | 0 | 0 | 0 | 0 | |
| Total Payroll | $1,000 | $1,000 | $1,500 | $1,500 | $3,000 | $4,000 | $4,000 | $4,000 | $4,000 | $4,000 | $4,000 | $4,000 | |
| General Assumptions | |||||||||||||
| Month 1 | Month 2 | Month 3 | Month 4 | Month 5 | Month 6 | Month 7 | Month 8 | Month 9 | Month 10 | Month 11 | Month 12 | ||
| Plan Month | 1 | 2 | 3 | 4 | 5 | 6 | 7 | 8 | 9 | 10 | 11 | 12 | |
| Current Interest Rate | 10.00% | 10.00% | 10.00% | 10.00% | 10.00% | 10.00% | 10.00% | 10.00% | 10.00% | 10.00% | 10.00% | 10.00% | |
| Long-term Interest Rate | 10.00% | 10.00% | 10.00% | 10.00% | 10.00% | 10.00% | 10.00% | 10.00% | 10.00% | 10.00% | 10.00% | 10.00% | |
| Tax Rate | 30.00% | 35.00% | 35.00% | 35.00% | 35.00% | 35.00% | 35.00% | 35.00% | 35.00% | 35.00% | 35.00% | 35.00% | |
| Other | 0 | 0 | 0 | 0 | 0 | 0 | 0 | 0 | 0 | 0 | 0 | 0 | |
| Pro Forma Profit and Loss | |||||||||||||
| Month 1 | Month 2 | Month 3 | Month 4 | Month 5 | Month 6 | Month 7 | Month 8 | Month 9 | Month 10 | Month 11 | Month 12 | ||
| Sales | $3,950 | $4,550 | $8,774 | $8,774 | $8,774 | $12,534 | $12,534 | $12,534 | $13,434 | $13,434 | $13,434 | $17,194 | |
| Direct Cost of Sales | $413 | $413 | $861 | $861 | $861 | $1,281 | $1,281 | $1,281 | $1,641 | $1,641 | $1,641 | $2,061 | |
| Other | $0 | $0 | $0 | $0 | $0 | $0 | $0 | $0 | $0 | $0 | $0 | $0 | |
| Total Cost of Sales | $413 | $413 | $861 | $861 | $861 | $1,281 | $1,281 | $1,281 | $1,641 | $1,641 | $1,641 | $2,061 | |
| Gross Margin | $3,538 | $4,138 | $7,914 | $7,914 | $7,914 | $11,254 | $11,254 | $11,254 | $11,794 | $11,794 | $11,794 | $15,134 | |
| Gross Margin % | 89.56% | 90.93% | 90.19% | 90.19% | 90.19% | 89.78% | 89.78% | 89.78% | 87.79% | 87.79% | 87.79% | 88.02% | |
| Expenses | |||||||||||||
| Payroll | $1,000 | $1,000 | $1,500 | $1,500 | $3,000 | $4,000 | $4,000 | $4,000 | $4,000 | $4,000 | $4,000 | $4,000 | |
| Sales and Marketing and Other Expenses | $400 | $400 | $400 | $449 | $1,593 | $899 | $899 | $899 | $2,043 | $899 | $899 | $1,349 | |
| Depreciation | $0 | $172 | $172 | $172 | $172 | $172 | $172 | $172 | $172 | $172 | $172 | $172 | |
| Leased Equipment | $0 | $0 | $0 | $0 | $0 | $0 | $0 | $0 | $0 | $0 | $0 | $0 | |
| Utilities (Gas & Elec.) | $175 | $175 | $175 | $175 | $95 | $75 | $75 | $75 | $97 | $175 | $175 | $175 | |
| Insurance | $45 | $45 | $45 | $45 | $45 | $45 | $45 | $45 | $45 | $45 | $45 | $45 | |
| Rent | $1,225 | $1,225 | $1,225 | $1,225 | $1,225 | $1,225 | $1,225 | $1,225 | $1,225 | $1,225 | $1,225 | $1,225 | |
| Payroll Taxes | 15% | $150 | $150 | $225 | $225 | $450 | $600 | $600 | $600 | $600 | $600 | $600 | $600 |
| Other | $0 | $0 | $0 | $0 | $0 | $0 | $0 | $0 | $0 | $0 | $0 | $0 | |
| Total Operating Expenses | $2,995 | $3,167 | $3,742 | $3,791 | $6,580 | $7,016 | $7,016 | $7,016 | $8,182 | $7,116 | $7,116 | $7,566 | |
| Profit Before Interest and Taxes | $543 | $971 | $4,172 | $4,123 | $1,334 | $4,238 | $4,238 | $4,238 | $3,612 | $4,678 | $4,678 | $7,568 | |
| EBITDA | $543 | $1,143 | $4,344 | $4,295 | $1,506 | $4,410 | $4,410 | $4,410 | $3,784 | $4,850 | $4,850 | $7,740 | |
| Interest Expense | $0 | $0 | $0 | $0 | $0 | $0 | $0 | $0 | $0 | $0 | $0 | $0 | |
| Taxes Incurred | $163 | $340 | $1,460 | $1,443 | $467 | $1,483 | $1,483 | $1,483 | $1,264 | $1,637 | $1,637 | $2,649 | |
| Net Profit | $380 | $631 | $2,711 | $2,680 | $867 | $2,754 | $2,754 | $2,754 | $2,347 | $3,040 | $3,040 | $4,919 | |
| Net Profit/Sales | 9.61% | 13.86% | 30.90% | 30.54% | 9.88% | 21.98% | 21.98% | 21.98% | 17.47% | 22.63% | 22.63% | 28.61% | |
| Pro Forma Cash Flow | |||||||||||||
| Month 1 | Month 2 | Month 3 | Month 4 | Month 5 | Month 6 | Month 7 | Month 8 | Month 9 | Month 10 | Month 11 | Month 12 | ||
| Cash Received | |||||||||||||
| Cash from Operations | |||||||||||||
| Cash Sales | $3,950 | $4,550 | $8,774 | $8,774 | $8,774 | $12,534 | $12,534 | $12,534 | $13,434 | $13,434 | $13,434 | $17,194 | |
| Subtotal Cash from Operations | $3,950 | $4,550 | $8,774 | $8,774 | $8,774 | $12,534 | $12,534 | $12,534 | $13,434 | $13,434 | $13,434 | $17,194 | |
| Additional Cash Received | |||||||||||||
| Sales Tax, VAT, HST/GST Received | 0.00% | $0 | $0 | $0 | $0 | $0 | $0 | $0 | $0 | $0 | $0 | $0 | $0 |
| New Current Borrowing | $0 | $0 | $0 | $0 | $0 | $0 | $0 | $0 | $0 | $0 | $0 | $0 | |
| New Other Liabilities (interest-free) | $0 | $0 | $0 | $0 | $0 | $0 | $0 | $0 | $0 | $0 | $0 | $0 | |
| New Long-term Liabilities | $0 | $0 | $0 | $0 | $0 | $0 | $0 | $0 | $0 | $0 | $0 | $0 | |
| Sales of Other Current Assets | $0 | $0 | $0 | $0 | $0 | $0 | $0 | $0 | $0 | $0 | $0 | $0 | |
| Sales of Long-term Assets | $0 | $0 | $0 | $0 | $0 | $0 | $0 | $0 | $0 | $0 | $0 | $0 | |
| New Investment Received | $0 | $0 | $0 | $0 | $0 | $0 | $0 | $0 | $0 | $0 | $0 | $0 | |
| Subtotal Cash Received | $3,950 | $4,550 | $8,774 | $8,774 | $8,774 | $12,534 | $12,534 | $12,534 | $13,434 | $13,434 | $13,434 | $17,194 | |
| Expenditures | Month 1 | Month 2 | Month 3 | Month 4 | Month 5 | Month 6 | Month 7 | Month 8 | Month 9 | Month 10 | Month 11 | Month 12 | |
| Expenditures from Operations | |||||||||||||
| Cash Spending | $1,000 | $1,000 | $1,500 | $1,500 | $3,000 | $4,000 | $4,000 | $4,000 | $4,000 | $4,000 | $4,000 | $4,000 | |
| Bill Payments | $105 | $3,164 | $3,375 | $4,531 | $4,572 | $4,893 | $5,429 | $5,608 | $5,664 | $7,274 | $6,222 | $6,300 | |
| Subtotal Spent on Operations | $1,105 | $4,164 | $4,875 | $6,031 | $7,572 | $8,893 | $9,429 | $9,608 | $9,664 | $11,274 | $10,222 | $10,300 | |
| Additional Cash Spent | |||||||||||||
| Sales Tax, VAT, HST/GST Paid Out | $0 | $0 | $0 | $0 | $0 | $0 | $0 | $0 | $0 | $0 | $0 | $0 | |
| Principal Repayment of Current Borrowing | $0 | $0 | $0 | $0 | $0 | $0 | $0 | $0 | $0 | $0 | $0 | $0 | |
| Other Liabilities Principal Repayment | $0 | $0 | $0 | $0 | $0 | $0 | $0 | $0 | $0 | $0 | $0 | $0 | |
| Long-term Liabilities Principal Repayment | $0 | $0 | $0 | $0 | $0 | $0 | $0 | $0 | $0 | $0 | $0 | $0 | |
| Purchase Other Current Assets | $0 | $0 | $0 | $0 | $0 | $0 | $0 | $0 | $0 | $0 | $0 | $0 | |
| Purchase Long-term Assets | $0 | $0 | $0 | $0 | $0 | $0 | $0 | $0 | $0 | $0 | $0 | $0 | |
| Dividends | $0 | $0 | $0 | $0 | $0 | $0 | $0 | $0 | $0 | $0 | $0 | $0 | |
| Subtotal Cash Spent | $1,105 | $4,164 | $4,875 | $6,031 | $7,572 | $8,893 | $9,429 | $9,608 | $9,664 | $11,274 | $10,222 | $10,300 | |
| Net Cash Flow | $2,845 | $386 | $3,899 | $2,743 | $1,202 | $3,641 | $3,105 | $2,926 | $3,770 | $2,160 | $3,212 | $6,894 | |
| Cash Balance | $2,845 | $3,231 | $7,131 | $9,873 | $11,075 | $14,716 | $17,821 | $20,748 | $24,517 | $26,677 | $29,889 | $36,784 | |
| Pro Forma Balance Sheet | |||||||||||||
| Month 1 | Month 2 | Month 3 | Month 4 | Month 5 | Month 6 | Month 7 | Month 8 | Month 9 | Month 10 | Month 11 | Month 12 | ||
| Assets | Starting Balances | ||||||||||||
| Current Assets | |||||||||||||
| Cash | $0 | $2,845 | $3,231 | $7,131 | $9,873 | $11,075 | $14,716 | $17,821 | $20,748 | $24,517 | $26,677 | $29,889 | $36,784 |
| Inventory | $0 | $588 | $1,175 | $1,315 | $1,454 | $1,594 | $1,409 | $1,409 | $1,409 | $1,805 | $1,805 | $1,805 | $2,267 |
| Other Current Assets | $0 | $0 | $0 | $0 | $0 | $0 | $0 | $0 | $0 | $0 | $0 | $0 | $0 |
| Total Current Assets | $0 | $3,432 | $4,406 | $8,445 | $11,327 | $12,669 | $16,125 | $19,230 | $22,156 | $26,322 | $28,482 | $31,694 | $39,050 |
| Long-term Assets | |||||||||||||
| Long-term Assets | $6,200 | $6,200 | $6,200 | $6,200 | $6,200 | $6,200 | $6,200 | $6,200 | $6,200 | $6,200 | $6,200 | $6,200 | $6,200 |
| Accumulated Depreciation | $0 | $0 | $172 | $344 | $516 | $688 | $860 | $1,032 | $1,204 | $1,376 | $1,548 | $1,720 | $1,892 |
| Total Long-term Assets | $6,200 | $6,200 | $6,028 | $5,856 | $5,684 | $5,512 | $5,340 | $5,168 | $4,996 | $4,824 | $4,652 | $4,480 | $4,308 |
| Total Assets | $6,200 | $9,632 | $10,434 | $14,301 | $17,011 | $18,181 | $21,465 | $24,398 | $27,152 | $31,146 | $33,134 | $36,174 | $43,358 |
| Liabilities and Capital | Month 1 | Month 2 | Month 3 | Month 4 | Month 5 | Month 6 | Month 7 | Month 8 | Month 9 | Month 10 | Month 11 | Month 12 | |
| Current Liabilities | |||||||||||||
| Accounts Payable | $0 | $3,052 | $3,224 | $4,379 | $4,410 | $4,712 | $5,242 | $5,421 | $5,421 | $7,067 | $6,014 | $6,014 | $8,280 |
| Current Borrowing | $0 | $0 | $0 | $0 | $0 | $0 | $0 | $0 | $0 | $0 | $0 | $0 | $0 |
| Other Current Liabilities | $0 | $0 | $0 | $0 | $0 | $0 | $0 | $0 | $0 | $0 | $0 | $0 | $0 |
| Subtotal Current Liabilities | $0 | $3,052 | $3,224 | $4,379 | $4,410 | $4,712 | $5,242 | $5,421 | $5,421 | $7,067 | $6,014 | $6,014 | $8,280 |
| Long-term Liabilities | $0 | $0 | $0 | $0 | $0 | $0 | $0 | $0 | $0 | $0 | $0 | $0 | $0 |
| Total Liabilities | $0 | $3,052 | $3,224 | $4,379 | $4,410 | $4,712 | $5,242 | $5,421 | $5,421 | $7,067 | $6,014 | $6,014 | $8,280 |
| Paid-in Capital | $8,265 | $8,265 | $8,265 | $8,265 | $8,265 | $8,265 | $8,265 | $8,265 | $8,265 | $8,265 | $8,265 | $8,265 | $8,265 |
| Retained Earnings | ($2,065) | ($2,065) | ($2,065) | ($2,065) | ($2,065) | ($2,065) | ($2,065) | ($2,065) | ($2,065) | ($2,065) | ($2,065) | ($2,065) | ($2,065) |
| Earnings | $0 | $380 | $1,011 | $3,722 | $6,402 | $7,268 | $10,023 | $12,777 | $15,532 | $17,879 | $20,919 | $23,960 | $28,879 |
| Total Capital | $6,200 | $6,580 | $7,211 | $9,922 | $12,602 | $13,468 | $16,223 | $18,977 | $21,732 | $24,079 | $27,119 | $30,160 | $35,079 |
| Total Liabilities and Capital | $6,200 | $9,632 | $10,434 | $14,301 | $17,011 | $18,181 | $21,465 | $24,398 | $27,152 | $31,146 | $33,134 | $36,174 | $43,358 |
| Net Worth | $6,200 | $6,580 | $7,211 | $9,922 | $12,602 | $13,468 | $16,223 | $18,977 | $21,732 | $24,079 | $27,119 | $30,160 | $35,079 |

