
Hart Fraeme Gallery
Executive Summary
Introduction
Hart Fraeme Gallery is a fine art gallery and full-service custom frame shop. The cornerstone of Hart Fraeme Gallery’s business is high-quality custom framing. The company is unique in its field in that it offers same-day and 11-day custom framing, in contrast to the industry-standard 21-day lead time. Hart Fraeme Gallery is founded on a dedication to offer the Triopolis metro area the most innovative, trend-setting designs and a finished product of impeccable quality at unmatched speeds.
The Company
Hart Fraeme Gallery is an S-Corporation that is owned and operated by Hart Fraeme, who has several years of experience operating another art gallery and custom frame shop. The knowledge, expertise, and contacts that Mr. Fraeme has accumulated during this time have led him to found Hart Fraeme Gallery.
Presently, the company does not have a retail location, although plans are in place to acquire a location in the Uptown Mall by September of 2005. This location is attractive due to the relative lack of nearby frame shops, as well as the area demographics, which mirror those of Hart Fraeme Gallery’s target customer.
Products and Services
As mentioned above, Hart Fraeme Gallery’s primary focus will be on custom framing, which is expected to generate roughly 75% of monthly income. Although the company will also offer artwork for sale, this is done mostly as a service to its customers, and will typically account for no more than 25% of monthly sales. Nevertheless, artwork is necessary as a tool to model and sell custom framing options, which are many. The business will offer a selection of nearly 500 mouldings and more than a thousand unique matboards. In addition, Hart Fraeme Gallery will offer a large variety of decorative mat cuts, design styles, and display options.
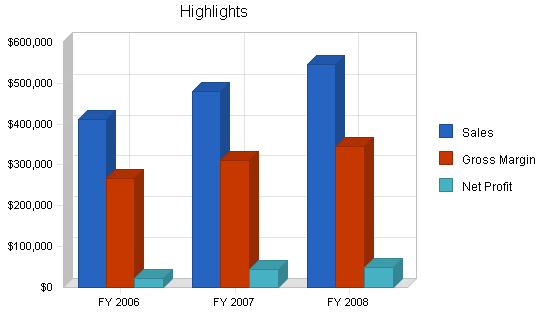
Financial Outlook
The demand for artwork and custom framing is strong: 42% of consumers report that they are likely to make an art or framing purchase in the upcoming year. Additionally, industry analyses predict a 4-6% growth in custom framing sales for 2006. Given this, Hart Fraeme Gallery is confident that it can enter and establish itself in the market successfully. Financial projections are positive, and the company expects to generate healthy sustainable income and gross margin over the next three years.
1.1 Objectives
Hart Fraeme Gallery has four major goals. The first two are related to establishing a market presence at the outset, while the third and fourth are ongoing goals.
-
- Open a retail location in the Triopolis metropolitan area. Specifically, the company plans to enter into a lease agreement with the Uptown Mall, to lease a retail space of 1,500 – 2,500 square feet, with a stockroom / workshop area of at least 750 square feet.
-
- Establish consumer awareness of both product and company through marketing. This can be accomplished by advertising weekly in local newspapers, including Pioneer Press and Star Tribune for four weeks prior to and two weeks following the grand opening, and then on alternate weeks thereafter for three months, advertising more or less as results suggest. Additionally, the company will create a website detailing products and services, which will include an online shopping cart for Web purchases.
-
- Lead the industry in completion time, with an 11-day time frame for project completion on most orders and same-day framing with selected materials. To do this, it will be necessary to purchase the requisite framing equipment, and to keep it on-site, along with a selection of stock materials for same-day projects. It is also necessary to establish business relationships with leaders in the materials industry such as Roma Moulding and Mouldique, and to maintain weekly ordering and delivery schedules with such vendors.
- Focus primarily on custom framing, emphasizing leading-edge and high-end design. To do this, the company will monitor changing design and décor trends. Particularly, staff must follow such trends; therefore, the company will subscribe to several trade magazines, such as Picture Framing Magazine, Decor, and Art Business News.
1.2 Mission
Hart Fraeme Gallery is founded on a dedication to offer the Triopolis the most innovative, trend-setting designs and a finished product of impeccable quality at unmatched speeds.
To this end, the company takes pride in three things:
- Eye-catching, unique frame designs, stemming from a strong knowledge and continuing study of both current and traditional decorating styles and design trends.
- The highest quality craftsmanship and an ongoing commitment to excellence.
- Dedication to work and constant drive to exceed the industry-standard three-week time frame for product completion.
1.3 Keys to Success
Hart Fraeme Gallery has four key factors that are integral to success:
- Quality Craftsmanship – Because picture framing is aesthetic in nature, the finished product must be of impeccable quality.
- Innovation and Creativity – Custom framing implies uniqueness, and the customer expects a one-of-a-kind product individually tailored to his preferences.
- Fast, Professional Service – In a business where the established lead time is three weeks, eleven days is a refreshing change of pace. Additionally, in today’s society, same-day framing is in demand.
- Embracing Technology – The computer has become an essential time-saver for all businesses, including art and framing, and computerized equipment is fast becoming a necessity for the modern framer.
Company Summary
Hart Fraeme Gallery is a new art gallery and custom frame shop, servicing Triopolis. Hart Fraeme Gallery is unique in that it offers same-day and 11-day framing, in contrast with the industry-standard 21-day framing.
2.1 Company Ownership
Hart Fraeme Gallery is a State-based S-Corporation, owned and operated by Hart G. Fraeme. Hart is 27 years old and holds a B.A. in Mathematics and Spanish from the University of St. Thomas in Pleasantville. Hart has three years experience as senior manager for Metropolitan Art and Frame, overseeing daily business operations, designing and building frames, ordering artwork and materials, establishing trade relationships, designing advertising materials, and managing human resources, including employee training, review, and recruitment. He also has experience in sales and service industries, including both retail and construction environments.
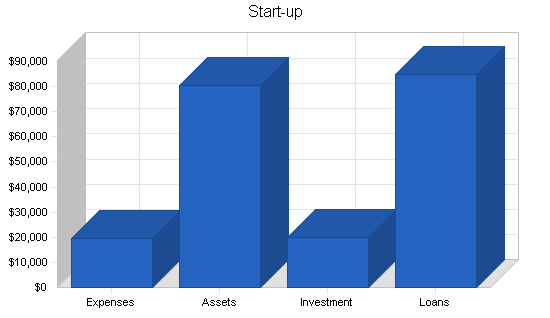
2.2 Start-up Summary
The start-up costs for this company can be broken into five major categories:
- Framing Equipment – Much of the necessary equipment for framing (saws, mat cutter, underpinner, chopper, press) requires supporting equipment (vacuums, air compressors, computers). Additionally, there are many hand tools required for framing that add up to a significant expense. The total cost for the equipment required by a modern frame shop is estimated in the following table.
- Retail Equipment and Fixtures – Expenses such as cash registers, computers, bookkeeping software, desks, filing cabinets, break room furnishings, as well as other fixtures and furniture are shown below.
- Inventory – The company must purchase a significant amount of artwork, some of which will be framed and some of which will not. Additionally, materials must be purchased for the artwork that will be framed.
- Working Capital – Working capital will be needed for day-to-day operations, including payroll and other various expenses.
- Other – The business will also require additional cash to cover other costs, including legal expenses, remodeling, advertising, rent, and creating a website.
| Start-up | |
| Requirements | |
| Start-up Expenses | |
| Legal | $1,000 |
| Stationery etc. | $500 |
| Insurance | $1,000 |
| Rent | $4,000 |
| Computer | $4,000 |
| Advertising | $4,000 |
| Remodeling and Signage | $5,000 |
| Total Start-up Expenses | $19,500 |
| Start-up Assets | |
| Cash Required | $15,000 |
| Start-up Inventory | $23,000 |
| Other Current Assets | $3,500 |
| Long-term Assets | $39,000 |
| Total Assets | $80,500 |
| Total Requirements | $100,000 |
Brought to you by
Create a professional business plan
Using AI and step-by-step instructions
Create Your PlanSecure funding
Validate ideas
Build a strategy
Products and Services
Hart Fraeme Gallery will focus on two things: art and framing. Specifically, the business will design and build custom picture frames, as well as sell both framed and unframed open-, limited-edition and original art from a variety of artists and publishers.
Typically, picture frames involve several elements, such as moulding, matboard, glass, et cetera. Custom framing allows the customer to pick each element individually, to create a frame that uniquely matches their tastes. There is a great variety of materials available, both direct from the manufacturers as well as from various distributors.
Artwork comes in a variety of styles, such as landscape, abstract, and portraiture, and in a variety of mediums, on a variety of surfaces, such as oil on canvas, acrylic on Masonite, and more. Additionally, print art is created in one of many ways, including lithograph, giclée, serigraph, and others. Finally, art is available to the trade from a myriad of sources, including individual artists, local and national publishers, et cetera.
Market Analysis Summary
The art and frame business continues to be both challenging and interesting. Within the larger category of wall décor, framed art has historically commanded a substantial portion of the market, with roughly 70% of wall décor items being framed pictures. Other wall décor alternatives include decorative shelving, handicrafts, mirrors, tapestries, and sconces.
Who Buys Art
In 2003, 44% of American households made some sort of art purchase. These purchases can be broken down into four categories: Unframed Art, Pre-Framed Art, Custom Framing, and Original Artwork.
| – | % of Households Purchased Last Year | # Pieces Purchased (Median – Average) |
Amount Spent (Median – Average) |
| Unframed Art | 29% | 3 – 10 | $24 – $56 |
| Pre-Framed Art | 26% | 3 – 7 | $59 – $83 |
| Custom Framing | 19% | 2 – 9 | $100 – $200 |
| Original Artwork | 14% | 1 – 2 | $100 – $300 |
Key Demographic Information for Unframed Art:
- Consumers aged 35-54 were significantly more likely to make multiple purchases, while younger buyers, aged 18-24 were more likely to make singular purchases.
- Older consumers, those aged 55+ typically spent 20% less than their younger counterparts.
- Buyers in metro urban and suburban areas spent more than did those in rural areas, with a median price of $35 versus $20 for those in rural areas.
- College graduates spent an average of $83 per piece, as compared to $31 spent by high-school incompletes.
- Buyers in the $50,000+ income bracket spent 20% more on average.
Key Demographic Information for Pre-Framed Art:
- Younger buyers typically purchased more pre-framed art. Of those aged 25-34, 16% bought five or more pieces of already-framed art last year, while just 4% of those 35-54 report this same purchasing level.
- Men spend more on average than women, with 37% of women spending less than $25, versus just 21% of males.
- Again, those living in urban and suburban areas spent more (30% more) than those in rural areas.
- Single-person households tended to purchase 30% more pieces of pre-framed art than those in multi-person households.
Key Demographic Information for Custom Framing:
- Higher income and higher educated households purchased more and spent more on custom framing.
- Buyers with children living with them tended to spend more than those without. Of those with children, 20% spent $200-$300, whereas only 12% of those without children spent the same.
Key Demographic Information for Original Artwork:
- On average, men spent more than women, with an average of $320 by men versus $250 spent by women.
- Consumers with higher income levels tended to spend more on original artwork.
Important Considerations:
The survey from which this information is taken did not supply answers; instead, the answers were categorized after the survey had been finished. This has particular significance for both the Custom Framing and Original Artwork categories, where 19% of those asked did not remember or did not wish to say how much they had spent on custom framing and 31% did not report how much they had spent on their original artwork.
What Types of Art Do People Buy
Typically, artwork falls into one of the following categories: Abstract, Birds & Waterfowl, Camouflage, Domestic Animals, Fantasy & Humor, Floral, Landscape, Maritime, Military & Aviation, Music & Dance, Portraiture & Romance, Religious, Sports, Still Life, Western, and Wildlife. These categories continually fluctuate in popularity, according to many factors, such as season, décor trends, geography, popularity of specific artists, etc.
In the past, the Midwest has had a strong tendency towards wildlife art. Within the last few years, however, we have seen a significant shift away from this trend towards more contemporary subjects, particularly portraiture & romance, fantasy & humor, and landscape. A new style of art has also been emerging, both here and throughout the country, depicting fine wines and spirits, and has experienced substantial success, particularly with customers in higher income brackets in the 25-44 age range.
Frame design plays an important role for customers, as well. Research has shown that today’s consumers, especially those that are more affluent and better educated place a premium on high-quality, unique merchandise. Custom products are tailored to the customer, and often that individuality plays an important role in the decision to purchase that item.
Furthermore, a new reason for custom framing has recently been discovered. Advancements in conservation framing over the last ten years have left consumers with collectable artwork that shows little to no signs of age, although the antiquated frame no longer fits with their décor. With décor styles changing, past favorites such as light oak mouldings and thin mat borders are increasingly being replaced with frames that reflect today’s decorating trends.
4.1 Market Segmentation
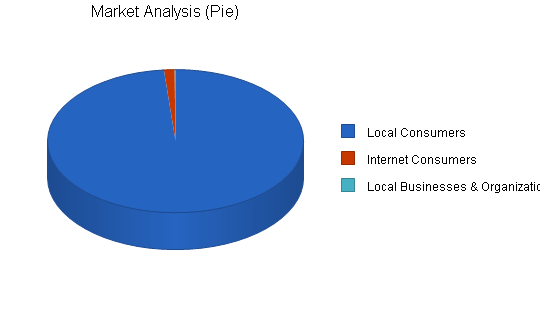
Hart Fraeme Gallery is positioned to serve three types of customers:
- Local Consumers – Local consumers are the standard, walk-in customer. These customers live nearby and thus share the demographics of the local area. These customers are primarily interested in decorating their home or office, and will represent a majority of Hart Fraeme Gallery’s customers, especially with respect to custom framing.
- Internet Consumers – Internet consumers are worldwide, and include anyone with access to the Internet. These customers typically have the same motives as local consumers, but have chosen to use the Internet to make their purchase. Due to shipping constraints, this group purchases unframed art almost exclusively, and although it is possible to ship framed artwork, custom framing is impractical for this group.
- Local Business & Organizations – These customers are typically interested in framed art to decorate a large area or production framing for a group of pieces. Although this group represents the smallest segment of Hart Fraeme Gallery’s market, these customers typically make larger purchases.
| Market Analysis | |||||||
| 2005 | 2006 | 2007 | 2008 | 2009 | |||
| Potential Customers | Growth | CAGR | |||||
| Local Consumers | 10% | 1,500 | 1,650 | 1,848 | 2,033 | 2,236 | 10.50% |
| Internet Consumers | 8% | 20 | 24 | 27 | 29 | 31 | 11.58% |
| Local Businesses & Organizations | 5% | 2 | 4 | 5 | 5 | 5 | 25.74% |
| Total | 10.53% | 1,522 | 1,678 | 1,880 | 2,067 | 2,272 | 10.53% |
4.2 Target Market Segment Strategy
Because a majority of Hart Fraeme Gallery’s income is generated by custom framing, the target market segment will be the local consumer. The other segments account for only a small percentage of the custom framing done in a typical year, due to various constraints, including the difficulty in choosing custom framing via the Internet, the sheer quantity of custom framing that would need to be designed by most large organizations, as well as other issues that surround custom framing for large quantities or over long distances. Individual walk-in consumers are the only segment reasonably able to make custom framing purchases.
Within the broad category of local consumers, there are further obvious distinctions that can be made: gender, age, education, income, and others; however, because many things besides artwork can be framed, and because a beautiful, comfortable home is something that everyone desires, the most important subsection of local consumers are the homeowners. Homeowners are the logical focus for three reasons: homeowners typically earn more than their counterparts, homeowners typically have more wall space to decorate, and homeowners are more likely to remodel their current home, which generally creates a need for new or reframed artwork.
Brought to you by
Create a professional business plan
Using AI and step-by-step instructions
Create Your PlanSecure funding
Validate ideas
Build a strategy
4.3 Service Business Analysis
In the Triopolis metro area, there are approximately 330 businesses that fall into the general category of Home Décor – Art Galleries and Picture Framers. There are also other businesses that sell art and wall décor items, including department stores, furniture stores, etc. But despite this abundance, there still remains a large unclaimed market share. This is due primarily to changing décor and design trends. Many galleries in our state were started when wildlife art was at its peak. This specialization has left them vulnerable to changing markets, especially the current shift towards more contemporary subjects.
There is also a substantial shift away from generic one-size-fits-all products towards customized merchandise. This is partially due to the increased popularity of television shows featuring interior design and home decorating; the recent demystification of home décor has enabled homeowners to approach a variety of home decorating tasks. The benefits of this newfound empowerment are twofold. First, people now feel that they can competently approach custom framing. Second, home improvement and redecorating projects often follow one another, because the homeowner feels that they must renovate the rest of their house to match the style of the newly remodeled room. This is good news for the art market, since many people feel that artwork and wall décor set the style for the room, and that redecorating requires new artwork.
Additionally, saturation plays a role: in greater Triopolis many of the similar businesses are clustered into Uneville and Cuidaddos proper, with the suburbs usually being home to only a few art and frame shops. Particularly, Uptown is home to only one custom frame shop, and although larger craft stores offer custom framing, they only offer a small selection of framing options.
4.3.1 Competition and Buying Patterns
The three major sources for art include art galleries, home products stores, and discount stores. To a lesser degree, people also purchase art from gift shops, art shows, directly from the artist, from custom frame shops, and from department stores. Consumers are also using the Internet as a rising source for artwork.
| Art Gallery | 33% | Artist | 17% |
| Art Show | 16% | Custom Frame Shop | 13% |
| Department Store | 15% | Discount Store | 22% |
| Furniture Store | 11% | Gift Shop | 19% |
| Home Products Store | 24% | Internet | 6% |
| Other | 14% | – | – |
Not surprisingly, art galleries are the leading source for artwork, with 33% of those who bought art in 2003 having made a purchase at an art gallery. This has been the case for several years, and it is expected that art galleries will remain as one of the top three sources for artwork.
Demographic Information for Art Galleries:
A higher incidence of purchases made at art galleries was positively correlated with higher education and income levels.
Demographic Information for Home Products Stores:
Consumers aged younger than 35 showed notably more purchasing from home products stores, such as Pottery Barn, Linens & Things, etc. than those 35 and older.
Demographic Information for Discount Stores:
Buyers 18-24 and those with income levels less than $25,000 reported the highest incidence of purchases at discount stores, such as Wal-Mart and K-Mart. Those in rural areas also had significantly higher rates of purchase than their urban and suburban counterparts (43% vs. 30%).
Demographic Information for Gift Shops:
Households with income levels between $25,000-$35,000 used gift shops substantially more as a source for art than those in the other income brackets.
Demographic Information for Artists:
Purchasing artwork directly from the artist was directly correlated with higher income and education levels.
Demographic Information for Art Shows:
Again, a higher incidence of art show purchases coincided with higher education and income levels.
Demographic Information for Department Stores:
Those in the 18-24 age range made significantly more purchases at department stores than all other age brackets.
Demographic Information for Custom Frame Shops:
Households with income levels greater than $50,000 used custom frame shops as a source for art more than other income levels. Also, customers without children had a substantially higher incidence of purchase than those with children under 18 (18% vs. 9%).
Demographic Information for Furniture Stores:
Furniture stores had results similar to department stores, with the most purchases being made by those aged 18-24.
Demographic Information for the Internet:
Internet purchases were positively correlated with higher education levels, as well as with younger buyers.
Strategy and Implementation Summary
The primary focus for Hart Fraeme Gallery is to establish and differentiate itself in the marketplace. This can be accomplished through advertising within the community that the company will serve, and by striving to build a positive reputation, particularly with regard to fast project completion time and friendly, creative customer service.
5.1 Competitive Edge
Innovation and advancement is key to any business, including art and framing. Unfortunately, businesses in the art market have been resistant to change and modernization, including the incorporation of computers, accepting changes in décor and design, and using modern equipment to accelerate the process of construction.
The primary advantage of Hart Fraeme Gallery will be the same-day framing and short completion time. In an industry where the standard completion time is three weeks, eleven days is a refreshing change of pace for those who purchase custom framing. Additionally, same-day framing has largely been regarded as either impossible or not worth the effort, since it was assumed that same-day jobs were just impulse shoppers who were more concerned with price than quality. The reality of same-day framing has proven to be quite different; many people who want same day framing have a deadline to meet, such as a birthday, Fathers’ Day, or other event, and are simply unfamiliar with custom framing and its time constraints. Since very few, if any, custom frame shops can offer sane-day framing, it represents a significant opportunity for the business.
The second advantage is technology. The computer has become an essential business tool, accelerating bookkeeping, communication, transactions, etc. Many manufacturers of framing equipment offer computerized machinery, which not only reduces the time needed to build frames, but guarantees consistency and accuracy to a degree unachievable through manual means. This computerized equipment has become a necessity for the modern framer, although it has only recently become widely available.
Additionally, Mr. Fraeme has created a software suite customized to the field, to streamline ordering and design. With adaptation in mind, it has been created it in such a way so as to give the user the ability to make changes as the need arises and to accommodate new possibilities in framing; this feature sets Mr. Fraeme’s program apart from those currently available. Alternative software is available commercially for approximately $1,500, and although this software has not yet been marketed, the possibility remains for the future.
The third advantage is flexibility and openness to change. Given that trends change frequently, the ability to follow them is an absolute necessity in this business. In a business that sells decorative commodities, the merchandise must be stylish and attractive; however, because different people have different styles, this requires a great deal of flexibility and an open mind. Hart Fraeme Gallery is committed to flexibility.
5.2 Marketing Strategy
The marketing strategy for Hart Fraeme Gallery hinges on three main principles:
- Satisfied customers are the most effective form of marketing. When a customer feels they can rely on Hart Fraeme Gallery for creative design, impeccable quality, and fast, friendly service they are eager to share that confidence with friends and family. With 42% of consumers reporting that they are likely to make an art or framing purchase in the upcoming year, word of mouth is an invaluable marketing tool.
- Because repeat customers represent a large portion of art and frame clientele, it is imperative that Hart Fraeme Gallery builds a strong customer base early on. To do this, the company plans to offer sales promotions on custom framing to encourage new customers, advertising such promotions in local newspapers.
- Same-day framing is something that few, if any other frame shops are able to offer. Hart Fraeme Gallery intends to capitalize on this capability by promoting same-day framing in all advertisements as well as with in-store signage.
5.3 Sales Strategy
Pricing for Artwork
Art is priced by a keystone markup. The artist or publisher sets a standard retail price, which is typically twice the wholesale price. Therefore, all galleries will sell the same print at the same price. The exception is artwork that has been sold out at the publisher. Once this happens, prices are set by supply and demand, since these prints must be purchased from one of approximately 3,500 galleries nationwide participating in the listing program. The markup on these prints is not a set percentage, although it is generally between 20-35% above the wholesale cost.
Pricing For Custom Framing
The price for a typical frame is determined from six variables, as chosen by the customer. These are Moulding, Matboards, Glass, Mounting, Fitting, and Extras. Moulding, matboard, and glass prices are all determined by their material cost, whereas fitting, mounting, and extras are all priced according to labor hours. Materials undergo various markups over their wholesale cost, while labor is typically priced out at an industry-standard sixty dollars per hour. However, in order to provide pricing at the time of order, labor time is estimated, based on size and complexity of the project.
Pricing on Materials
Moulding:
‘Moulding’ refers to the wood or metal exterior of the frame. Although vendors only supply moulding in ten-foot lengths, retail customers purchase moulding by the foot. Because of this, the markup on moulding is approximately 300%. Additionally, the unused portion can be used for other projects, although it must be stored safely until it is needed, to avoid damage.
Matboards:
Matboards are the colored sheets under the glass between the image and the moulding. Again, matboards are only available in 32″ x 40″ and 40″ x 60″ sizes, but are sold by the United Inch. Therefore, the markup on a matboard is variable, although pricing is generally adjusted so that the retail price of a 4″ x 6″ image is approximately 150% of the wholesale cost, and the retail price for the whole matboard is roughly 300% of the wholesale; however, due to the way matboards are cut, they leave a center fallout which can be used again. Thus, any given matboard can be used 3-4 times, although like mouldings, matboards must be stored in a certain way.
Glass:
Glass, like matboard, is sold by the United Inch. Unlike matboard, glass is available in eight standard sizes. This means that there is little waste involved in glass, although glass is fragile by nature, and prone to breaking. The markup on glass is generally 100%, although some specialty glasses, which require special handling and cutting, are subject to a 200%-300% markup. Also, although glass is very fragile and a large quantity of glass must be stored, it can generally be kept in its packaging until it is needed, thus eliminating special storage needs.
Pricing on Labor
Fitting:
‘Fitting’ refers to the labor involved in cutting, joining, and assembling the frame. As mentioned above, fitting is priced at an industry-standard $60/hr. Most frames require one of three types of fitting: standard fitting, fitting with fillet, or shadowbox fitting. These three types vary in complexity and time required, and are priced accordingly. A majority of frames take 45-60 minutes to fit, although they range from as little as ten minutes to as much as two hours.
Mounting:
‘Mounting’ is the cost of labor and materials to mount the picture or item inside the frame. The mounting techniques used are specialized to the type of item being mounted, and range in time from a typical five minutes for most prints to nearly an hour for items such as jerseys. The average price range for mounting, including labor and materials, is between $15-$30.
Extras:
Framing extras, such as specialty mat cuts, octagonal frames and other non-standard framing requests are priced at the usual $60/hr, plus the price of any additional materials. Many extras are fairly standard, such as nameplates and extra openings, although an important part of offering custom framing is being able to handle unique framing requests.
5.3.1 Sales Forecast
It is estimated that sales of framed and unframed artwork, including special orders will account for 25%-40% of income, varying slightly by season. A very small portion, approximately 2% of these sales, will be Internet sales. The remaining 60%-75% of income is comprised of custom framing. Because roughly half of retail sales will be pre-framed artwork, the estimated replacement cost for the artwork is roughly 30% of retail price, on average. The cost of materials for framing, including the price of the materials used to frame artwork for sale in the store is predicted to be 35% of custom framing income; however, projects which require the same materials can sometimes be completed using the same piece of material, thus at times this cost may be considerably less than predicted.
Additionally, framing requires supplies and maintenance, such as foam board, blade sharpening, glue, nails, mat cutter blades, and others that represent a small but routine expense. Because these supplies are depleted at a rate proportional to the number of frame jobs completed, but are purchased in bulk (i.e. 16 nails per frame job, but bought in quantities of 1,000 nails per box) the cost for these supplies and services is tiered at an estimated rate of $150 per 25 frame jobs. If the average frame job is expected to generate roughly $250-$275 in sales, this means that framing supplies will represent an expense of $150 per $6,500 in custom framing sales, although because these materials are identical for all frame jobs, there is the possibility for some materials to be used for more than one project, which may favorably affect this cost.
Although the art and frame business is not considered to be seasonal, it does experience several high and low points, like most retail businesses. Of particular impact is the lull in June, when most children are done with school, the high point in September when children are returning to school, and the general retail peak around the holiday season. A typical year for art and framing involves strong post-holiday sales, declining slightly until June, where sales drop sharply, remaining somewhat low until September, when sales make marked improvement, improving slightly in October and then substantially in November and December.
Finally, due to the individualized service nature of custom framing, many sales are to repeat customers. Therefore, sales are expected to be markedly (approximately 30%-40%) below average during the first one to two years, until a regular customer base has been established. It has been estimated that it takes the average custom frame shop seven years to fully establish its customer base, during which time sales grow at an accelerated rate. Using advertising as a catalyst for this process, Hart Fraeme Gallery hopes to attract more customers sooner, although it will still require much patience.


| Sales Forecast | |||
| FY 2006 | FY 2007 | FY 2008 | |
| Sales | |||
| Unframed Artwork | $56,650 | $62,315 | $68,545 |
| Framed Artwork | $56,650 | $62,315 | $68,545 |
| Special Orders | $5,050 | $5,800 | $6,400 |
| Custom Framing | $292,200 | $350,640 | $403,250 |
| Total Sales | $410,550 | $481,070 | $546,740 |
| Direct Cost of Sales | FY 2006 | FY 2007 | FY 2008 |
| Unframed Artwork | $34,000 | $39,000 | $45,000 |
| Materials for Framing | $102,600 | $123,120 | $147,750 |
| Framing Supplies and Maintenance | $7,650 | $8,100 | $9,450 |
| Subtotal Direct Cost of Sales | $144,250 | $170,220 | $202,200 |
5.4 Milestones
The following table provides details for many of the important milestones. Many of these milestones hinge on the successful completion of prior milestones. The dates were chosen based on realistic delivery times and necessary construction times, and therefore must be completed within their allotted time frames to ensure the success of contingent milestones.

| Milestones | |||||
| Milestone | Start Date | End Date | Budget | Manager | Department |
| Establish Vendor Accounts | 6/21/2005 | 7/14/2005 | $0 | ABC | Department |
| Advertise Grand Opening | 7/1/2005 | 9/30/2005 | $4,000 | ABC | Department |
| Purchase Framing Equipment | 7/14/2005 | 8/14/2005 | $36,000 | ABC | Department |
| Purchase Initial Inventory | 7/14/2005 | 8/7/2005 | $16,000 | ABC | Department |
| Remodel | 7/14/2005 | 8/14/2005 | $7,400 | ABC | Department |
| Launch Website | 7/14/2005 | 8/14/2005 | $3,500 | ABC | Department |
| Frame for Initial Inventory | 8/7/2005 | 8/31/2005 | $7,500 | ABC | Department |
| Hire Two Sales Associates | 8/7/2005 | 8/31/2005 | $100 | ABC | Department |
| Totals | $74,500 | ||||
Web Plan Summary
Hart Fraeme Gallery is currently developing a website at the address http://www.HartFraemeGallery.com. This website will serve three purposes:
- The primary function of the website will be to serve as a reference for both Hart Fraeme Gallery staff and customers. Hart Fraeme Gallery will carry the artwork of a large variety of artists and publishers, and a website will be the solution to several practical issues. First, the sheer amount of artwork available makes it impossible to stock and display everything. Second, because artwork comes from a great many sources, a website is an effective way to centralize information and make it accessible to customers.
- The website will also be an online store, where customers can order artwork, as well as a small selection of custom framing. Although the website will generate only a small amount of income, this additional cash flow will be used to finance the website.
- The Hart Fraeme Gallery website will have company information, including contact info and services offered.
6.1 Website Marketing Strategy
The biggest marketing opportunity that Hart Fraeme Gallery has is offered through publishers and artists. To support their dealers, many artists and publishers promote exchanging links. This not only directs customers to local dealers, but also helps improve ranking on search engines.
Hart Fraeme Gallery will also include the website address on all stationery, including letterhead, business cards, and order forms, as well as in all advertisements and on shipping containers.
6.2 Development Requirements
Hart Fraeme Gallery has already secured hosting with a local provider, Berry Bros, Inc. Berry Bros will provide the required technical services, including FTP support and security. Additionally, they will prepare a monthly statistical usage report for use in analyzing and improving web usage.
Website design and development will be handled by Andrew Johnson, an independent Web developer who specializes in dynamic multimedia databases. Early meetings with Mr. Johnson have been productive, and he is confident that the website will be finished by August of 2005.
Basic website maintenance, including updates and data entry will be handled by Hart Fraeme Gallery staff. Mr. Johnson has proposed creating a simple tool that will greatly speed data entry by allowing Hart Fraeme Gallery staff to add, remove, and edit database material, rather than relying on Mr. Johnson for any changes. Site content, such as images and text will be maintained by Mr. Fraeme, who is proficient with several computer languages, including HTML and ASP.
Management Summary
At present, Hart Fraeme Gallery’s sole employee is its founder, Hart Fraeme. Mr. Fraeme will be responsible for the entirety of tasks associated with operating an art and framing business, including assisting customers, designing and building frames, ordering, and human resources. By January 2006, Hart Fraeme Gallery plans to appoint an assistant manager, who will act as a key holder and peer supervisor.
7.1 Personnel Plan
Given the small business nature of Hart Fraeme Gallery, this personnel plan is intended serve as a guide to staffing, although staffing decisions must ultimately be based on business need.
Hart Fraeme Gallery’s personnel plan can be summarized as follows:
- Mr. Fraeme will serve as manager, and will oversee daily operations as well as fill in to meet work needs.
- One assistant manager who will act as both key holder and peer supervisor, although the assistant manager will perform many of the same duties as a sales and design associate.
- One full-time sales and design associate who will be primarily responsible for assisting customers with questions and purchases, including custom frame design.
In the first year, Hart Fraeme Gallery assumes that it will initially employ two sales and design associates, one of whom will be appointed as an assistant manager by January of 2006. During the 2006-2007 holiday season, it is expected that an additional sales and design associate will be hired to help with the increase in business, with continuing employment to be determined by staffing demands.
| Personnel Plan | |||
| FY 2006 | FY 2007 | FY 2008 | |
| Owner | $48,000 | $48,000 | $48,000 |
| Assistant Manager | $16,000 | $24,000 | $26,000 |
| Sales and Design Associates | $24,320 | $23,000 | $37,500 |
| Total People | 3 | 3 | 4 |
| Total Payroll | $88,320 | $95,000 | $111,500 |
Financial Plan
Hart Fraeme Gallery will secure a short-term loan to purchase essential equipment and inventory. By opening for business at the start of the industry’s busy season, the company expects to operate for several months with a positive cash influx. This will make it possible for Hart Fraeme Gallery to meet its financial obligations for the remainder of the year.
The company also expects to be able to increase consumer awareness and its customer base to maintain a healthy level of growth over the next several years. This will be made possible through advertising, as well as through word-of-mouth recommendations by exceeding industry standards and customer expectations for order completion time.
Finally, Hart Fraeme Gallery will minimize costs by using its small business, personal nature to build and maintain an enthusiastic, dependable, and flexible workforce.
8.1 Projections
8.2 Start-up Funding
At this time, Mr. Fraeme has purchased and framed several pieces of artwork, and will provide many of the necessary tools and peripherial equipment for framing, as well as a vehicle to transport equipment and materials. He will also be providing office and break room furnishings, including a computer, tables, desks, chairs, filing cabinets and a refrigerator. In addition to these assets Mr. Fraeme will invest personal savings.
The computerized mat cutter, which represents roughly two-thirds of equipment costs, will be paid for in installments over a period of 48 months via a lease-to-own program, available through the manufacturer.
The initial inventory and materials will be purchased on Net-30 terms, with a possible financing option.
Financing will need to be secured for these and remaining expenses.
| Start-up Funding | |
| Start-up Expenses to Fund | $19,500 |
| Start-up Assets to Fund | $80,500 |
| Total Funding Required | $100,000 |
| Assets | |
| Non-cash Assets from Start-up | $65,500 |
| Cash Requirements from Start-up | $15,000 |
| Additional Cash Raised | $5,000 |
| Cash Balance on Starting Date | $20,000 |
| Total Assets | $85,500 |
| Liabilities and Capital | |
| Liabilities | |
| Current Borrowing | $85,000 |
| Long-term Liabilities | $0 |
| Accounts Payable (Outstanding Bills) | $0 |
| Other Current Liabilities (interest-free) | $0 |
| Total Liabilities | $85,000 |
| Capital | |
| Planned Investment | |
| Owner | $20,000 |
| Investor | $0 |
| Additional Investment Requirement | $0 |
| Total Planned Investment | $20,000 |
| Loss at Start-up (Start-up Expenses) | ($19,500) |
| Total Capital | $500 |
| Total Capital and Liabilities | $85,500 |
| Total Funding | $105,000 |
8.3 Important Assumptions
Hart Fraeme Gallery makes several important financial assumptions in this plan, as defined below:
- Assume access to capital and financing to support our financial plan.
- Assume financial progress based on realistic sales to minimum sales against highest expenses.
- Assume a steady economy, without major recession that would greatly hinder our target market’s access to their personal luxury finds.
8.4 Break-even Analysis
For the purposes of a break-even analysis, Hart Fraeme Gallery assumes per month fixed operating costs as shown below. This includes payroll, rent, utilities, and other costs associated with operating an art gallery and custom frame shop. The analysis shows that $30,553 in sales is required to break even, which is roughly 11% below estimated monthly sales for the first year.
In terms of units sold, the business must achieve sales of roughly 3-4 frame orders and 1-3 pieces of artwork on an average day. Because these numbers are approximately 15%-30% below industry norms, Hart Fraeme Gallery is confident that it can maintain its break-even figures.

| Break-even Analysis | |
| Monthly Revenue Break-even | $29,269 |
| Assumptions: | |
| Average Percent Variable Cost | 35% |
| Estimated Monthly Fixed Cost | $18,985 |
8.5 Projected Profit and Loss
Hart Fraeme Gallery makes several important assumptions in calculating profit and loss:
- Sales are estimated at minimum to average values, while expenses are estimated at above average to maximum values.
- Materials expenses will not increase drastically over the next several years, but will grow at a rate that matches increasing consumption.
- Rent expenses will also grow at a slow, predictable rate.
- Staffing and payroll expansions will be powered by increased sales.


| Pro Forma Profit and Loss | |||
| FY 2006 | FY 2007 | FY 2008 | |
| Sales | $410,550 | $481,070 | $546,740 |
| Direct Cost of Sales | $144,250 | $170,220 | $202,200 |
| Other Costs of Sales | $0 | $0 | $0 |
| Total Cost of Sales | $144,250 | $170,220 | $202,200 |
| Gross Margin | $266,300 | $310,850 | $344,540 |
| Gross Margin % | 64.86% | 64.62% | 63.02% |
| Expenses | |||
| Payroll | $88,320 | $95,000 | $111,500 |
| Marketing/Promotion | $10,250 | $10,000 | $10,000 |
| Depreciation | $3,000 | $3,500 | $4,000 |
| Rent | $48,000 | $60,000 | $63,000 |
| Percentage Rent | $41,200 | $48,100 | $54,700 |
| Payroll Taxes | $13,248 | $0 | $0 |
| Utilities | $19,000 | $20,000 | $22,000 |
| Insurance | $1,800 | $1,900 | $2,100 |
| Accounting Services | $2,400 | $2,500 | $2,600 |
| Other | $600 | $750 | $900 |
| Total Operating Expenses | $227,818 | $241,750 | $270,800 |
| Profit Before Interest and Taxes | $38,482 | $69,100 | $73,740 |
| EBITDA | $41,482 | $72,600 | $77,740 |
| Interest Expense | $7,590 | $5,980 | $4,300 |
| Taxes Incurred | $9,268 | $18,936 | $20,832 |
| Net Profit | $21,624 | $44,184 | $48,608 |
| Net Profit/Sales | 5.27% | 9.18% | 8.89% |
8.6 Projected Cash Flow
The cash flow estimations for Hart Fraeme Gallery hinge on the assumption that the influx of cash from September till February will be strong enough to maintain a positive balance for the remainder of the year. This is especially crucial in the first year, since Hart Fraeme Gallery will not be able to rely on profits from the previous.
Hart Fraeme Gallery is able to employ an effective system to help with cash-flow management. Given the nature of custom framing and the broad scope of materials available, it is most practical to purchase materials for framing after an order has been placed. Combined with the current system for payment on custom framing orders, (50% due on order, with the remainder due upon receipt) this system is advantageous for cash-flow management.

| Pro Forma Cash Flow | |||
| FY 2006 | FY 2007 | FY 2008 | |
| Cash Received | |||
| Cash from Operations | |||
| Cash Sales | $410,550 | $481,070 | $546,740 |
| Subtotal Cash from Operations | $410,550 | $481,070 | $546,740 |
| Additional Cash Received | |||
| Sales Tax, VAT, HST/GST Received | $0 | $0 | $0 |
| New Current Borrowing | $0 | $0 | $0 |
| New Other Liabilities (interest-free) | $0 | $0 | $0 |
| New Long-term Liabilities | $0 | $0 | $0 |
| Sales of Other Current Assets | $0 | $0 | $0 |
| Sales of Long-term Assets | $0 | $0 | $0 |
| New Investment Received | $0 | $0 | $0 |
| Subtotal Cash Received | $410,550 | $481,070 | $546,740 |
| Expenditures | FY 2006 | FY 2007 | FY 2008 |
| Expenditures from Operations | |||
| Cash Spending | $88,320 | $95,000 | $111,500 |
| Bill Payments | $263,499 | $332,284 | $380,982 |
| Subtotal Spent on Operations | $351,819 | $427,284 | $492,482 |
| Additional Cash Spent | |||
| Sales Tax, VAT, HST/GST Paid Out | $0 | $0 | $0 |
| Principal Repayment of Current Borrowing | $16,800 | $16,800 | $16,800 |
| Other Liabilities Principal Repayment | $0 | $0 | $0 |
| Long-term Liabilities Principal Repayment | $0 | $0 | $0 |
| Purchase Other Current Assets | $0 | $0 | $0 |
| Purchase Long-term Assets | $6,240 | $6,240 | $6,240 |
| Dividends | $0 | $0 | $0 |
| Subtotal Cash Spent | $374,859 | $450,324 | $515,522 |
| Net Cash Flow | $35,691 | $30,746 | $31,218 |
| Cash Balance | $55,691 | $86,437 | $117,656 |
8.7 Projected Balance Sheet
The figures in the Projected Balance Sheet are promising, indicating a slow but steady increase in net worth. Hart Fraeme Gallery does not foresee any difficulty in meeting its financial obligations, provided that revenue predictions are met.
| Pro Forma Balance Sheet | |||
| FY 2006 | FY 2007 | FY 2008 | |
| Assets | |||
| Current Assets | |||
| Cash | $55,691 | $86,437 | $117,656 |
| Inventory | $9,100 | $10,738 | $12,756 |
| Other Current Assets | $3,500 | $3,500 | $3,500 |
| Total Current Assets | $68,291 | $100,676 | $133,911 |
| Long-term Assets | |||
| Long-term Assets | $45,240 | $51,480 | $57,720 |
| Accumulated Depreciation | $3,000 | $6,500 | $10,500 |
| Total Long-term Assets | $42,240 | $44,980 | $47,220 |
| Total Assets | $110,531 | $145,656 | $181,131 |
| Liabilities and Capital | FY 2006 | FY 2007 | FY 2008 |
| Current Liabilities | |||
| Accounts Payable | $20,207 | $27,947 | $31,615 |
| Current Borrowing | $68,200 | $51,400 | $34,600 |
| Other Current Liabilities | $0 | $0 | $0 |
| Subtotal Current Liabilities | $88,407 | $79,347 | $66,215 |
| Long-term Liabilities | $0 | $0 | $0 |
| Total Liabilities | $88,407 | $79,347 | $66,215 |
| Paid-in Capital | $20,000 | $20,000 | $20,000 |
| Retained Earnings | ($19,500) | $2,124 | $46,308 |
| Earnings | $21,624 | $44,184 | $48,608 |
| Total Capital | $22,124 | $66,308 | $114,916 |
| Total Liabilities and Capital | $110,531 | $145,656 | $181,131 |
| Net Worth | $22,124 | $66,308 | $114,916 |
8.8 Business Ratios
Over the next several years Hart Fraeme Gallery is poised to meet or exceed many of the industry-standard ratios. Nevertheless, there are some discrepancies in the ratio comparison; however, many of these can be explained by the fact that Hart Fraeme Gallery does business in two separate but related industries: art and framing. Because much of the business Hart Fraeme Gallery does will be custom framing, the ratios used for the industry standard are for picture framing, using the Standard Industrial Classification code 7699.1809. In some cases, the ratios for artwork sales are much different. The following ratios are particularly worth noting:
- Sales Growth – Because Hart Fraeme Gallery will be a new business, the ratio for sales growth is expected to be somewhat inflated for the first few years that the company is in business.
- Assets – In general, the ratios for Hart Fraeme Gallery’s assets are between the industry standard ratios for the two industries.
- Gross Margin – Due to the difference in wholesale ratios between artwork and framing materials, the ratio for Hart Fraeme Gallery is again higher than the ratio for artwork sales but lower than the ratio for picture framing.
- Selling, General, and Administrative Expenses – Again, Hart Fraeme Gallery’s ratio is higher than for artwork sales but lower than picture framing.
- Returns on Net Worth, Assets, and Equity – Many of these figures seem heavily exaggerated due to the fact that Hart Fraeme Gallery is a new company and thus has marked initial growth for net worth, assets, and equity.
| Ratio Analysis | ||||
| FY 2006 | FY 2007 | FY 2008 | Industry Profile | |
| Sales Growth | 0.00% | 17.18% | 13.65% | 4.89% |
| Percent of Total Assets | ||||
| Inventory | 8.23% | 7.37% | 7.04% | 13.95% |
| Other Current Assets | 3.17% | 2.40% | 1.93% | 30.83% |
| Total Current Assets | 61.78% | 69.12% | 73.93% | 66.56% |
| Long-term Assets | 38.22% | 30.88% | 26.07% | 33.44% |
| Total Assets | 100.00% | 100.00% | 100.00% | 100.00% |
| Current Liabilities | 79.98% | 54.48% | 36.56% | 29.31% |
| Long-term Liabilities | 0.00% | 0.00% | 0.00% | 21.88% |
| Total Liabilities | 79.98% | 54.48% | 36.56% | 51.19% |
| Net Worth | 20.02% | 45.52% | 63.44% | 48.81% |
| Percent of Sales | ||||
| Sales | 100.00% | 100.00% | 100.00% | 100.00% |
| Gross Margin | 64.86% | 64.62% | 63.02% | 100.00% |
| Selling, General & Administrative Expenses | 59.60% | 55.43% | 54.13% | 83.47% |
| Advertising Expenses | 0.00% | 0.00% | 0.00% | 0.56% |
| Profit Before Interest and Taxes | 9.37% | 14.36% | 13.49% | 2.99% |
| Main Ratios | ||||
| Current | 0.77 | 1.27 | 2.02 | 1.80 |
| Quick | 0.67 | 1.13 | 1.83 | 1.16 |
| Total Debt to Total Assets | 79.98% | 54.48% | 36.56% | 59.36% |
| Pre-tax Return on Net Worth | 139.63% | 95.19% | 60.43% | 6.07% |
| Pre-tax Return on Assets | 27.95% | 43.34% | 38.34% | 14.93% |
| Additional Ratios | FY 2006 | FY 2007 | FY 2008 | |
| Net Profit Margin | 5.27% | 9.18% | 8.89% | n.a |
| Return on Equity | 97.74% | 66.63% | 42.30% | n.a |
| Activity Ratios | ||||
| Inventory Turnover | 11.88 | 17.16 | 17.21 | n.a |
| Accounts Payable Turnover | 14.04 | 12.17 | 12.17 | n.a |
| Payment Days | 27 | 26 | 28 | n.a |
| Total Asset Turnover | 3.71 | 3.30 | 3.02 | n.a |
| Debt Ratios | ||||
| Debt to Net Worth | 4.00 | 1.20 | 0.58 | n.a |
| Current Liab. to Liab. | 1.00 | 1.00 | 1.00 | n.a |
| Liquidity Ratios | ||||
| Net Working Capital | ($20,116) | $21,328 | $67,696 | n.a |
| Interest Coverage | 5.07 | 11.56 | 17.15 | n.a |
| Additional Ratios | ||||
| Assets to Sales | 0.27 | 0.30 | 0.33 | n.a |
| Current Debt/Total Assets | 80% | 54% | 37% | n.a |
| Acid Test | 0.67 | 1.13 | 1.83 | n.a |
| Sales/Net Worth | 18.56 | 7.26 | 4.76 | n.a |
| Dividend Payout | 0.00 | 0.00 | 0.00 | n.a |
Appendix
| Sales Forecast | |||||||||||||
| Sep | Oct | Nov | Dec | Jan | Feb | Mar | Apr | May | Jun | Jul | Aug | ||
| Sales | |||||||||||||
| Unframed Artwork | 0% | $3,750 | $4,500 | $7,500 | $13,500 | $4,500 | $4,000 | $3,750 | $3,750 | $3,500 | $2,250 | $2,500 | $3,150 |
| Framed Artwork | 0% | $3,750 | $4,500 | $7,500 | $13,500 | $4,500 | $4,000 | $3,750 | $3,750 | $3,500 | $2,250 | $2,500 | $3,150 |
| Special Orders | 0% | $400 | $420 | $500 | $650 | $475 | $400 | $380 | $375 | $365 | $350 | $360 | $375 |
| Custom Framing | 0% | $22,500 | $27,000 | $31,000 | $38,000 | $31,000 | $28,000 | $24,000 | $22,500 | $21,000 | $13,500 | $15,000 | $18,700 |
| Total Sales | $30,400 | $36,420 | $46,500 | $65,650 | $40,475 | $36,400 | $31,880 | $30,375 | $28,365 | $18,350 | $20,360 | $25,375 | |
| Direct Cost of Sales | Sep | Oct | Nov | Dec | Jan | Feb | Mar | Apr | May | Jun | Jul | Aug | |
| Unframed Artwork | $2,250 | $2,700 | $4,500 | $8,100 | $2,700 | $2,400 | $2,250 | $2,250 | $2,100 | $1,350 | $1,500 | $1,900 | |
| Materials for Framing | $7,900 | $9,500 | $10,900 | $13,300 | $10,900 | $9,800 | $8,400 | $7,900 | $7,400 | $4,700 | $5,300 | $6,600 | |
| Framing Supplies and Maintenance | $600 | $750 | $750 | $900 | $750 | $750 | $600 | $600 | $600 | $300 | $450 | $600 | |
| Subtotal Direct Cost of Sales | $10,750 | $12,950 | $16,150 | $22,300 | $14,350 | $12,950 | $11,250 | $10,750 | $10,100 | $6,350 | $7,250 | $9,100 | |
| Personnel Plan | |||||||||||||
| Sep | Oct | Nov | Dec | Jan | Feb | Mar | Apr | May | Jun | Jul | Aug | ||
| Owner | 0% | $4,000 | $4,000 | $4,000 | $4,000 | $4,000 | $4,000 | $4,000 | $4,000 | $4,000 | $4,000 | $4,000 | $4,000 |
| Assistant Manager | 0% | $0 | $0 | $0 | $0 | $2,000 | $2,000 | $2,000 | $2,000 | $2,000 | $2,000 | $2,000 | $2,000 |
| Sales and Design Associates | 0% | $2,880 | $2,880 | $2,880 | $2,880 | $1,600 | $1,600 | $1,600 | $1,600 | $1,600 | $1,600 | $1,600 | $1,600 |
| Total People | 3 | 3 | 3 | 3 | 3 | 3 | 3 | 3 | 3 | 3 | 3 | 3 | |
| Total Payroll | $6,880 | $6,880 | $6,880 | $6,880 | $7,600 | $7,600 | $7,600 | $7,600 | $7,600 | $7,600 | $7,600 | $7,600 | |
| Pro Forma Profit and Loss | |||||||||||||
| Sep | Oct | Nov | Dec | Jan | Feb | Mar | Apr | May | Jun | Jul | Aug | ||
| Sales | $30,400 | $36,420 | $46,500 | $65,650 | $40,475 | $36,400 | $31,880 | $30,375 | $28,365 | $18,350 | $20,360 | $25,375 | |
| Direct Cost of Sales | $10,750 | $12,950 | $16,150 | $22,300 | $14,350 | $12,950 | $11,250 | $10,750 | $10,100 | $6,350 | $7,250 | $9,100 | |
| Other Costs of Sales | $0 | $0 | $0 | $0 | $0 | $0 | $0 | $0 | $0 | $0 | $0 | $0 | |
| Total Cost of Sales | $10,750 | $12,950 | $16,150 | $22,300 | $14,350 | $12,950 | $11,250 | $10,750 | $10,100 | $6,350 | $7,250 | $9,100 | |
| Gross Margin | $19,650 | $23,470 | $30,350 | $43,350 | $26,125 | $23,450 | $20,630 | $19,625 | $18,265 | $12,000 | $13,110 | $16,275 | |
| Gross Margin % | 64.64% | 64.44% | 65.27% | 66.03% | 64.55% | 64.42% | 64.71% | 64.61% | 64.39% | 65.40% | 64.39% | 64.14% | |
| Expenses | |||||||||||||
| Payroll | $6,880 | $6,880 | $6,880 | $6,880 | $7,600 | $7,600 | $7,600 | $7,600 | $7,600 | $7,600 | $7,600 | $7,600 | |
| Marketing/Promotion | $1,500 | $1,000 | $1,500 | $1,500 | $1,000 | $750 | $500 | $500 | $500 | $500 | $500 | $500 | |
| Depreciation | $250 | $250 | $250 | $250 | $250 | $250 | $250 | $250 | $250 | $250 | $250 | $250 | |
| Rent | $4,000 | $4,000 | $4,000 | $4,000 | $4,000 | $4,000 | $4,000 | $4,000 | $4,000 | $4,000 | $4,000 | $4,000 | |
| Percentage Rent | $3,000 | $3,700 | $4,700 | $6,700 | $4,000 | $3,600 | $3,200 | $3,000 | $2,900 | $1,900 | $2,000 | $2,500 | |
| Payroll Taxes | 15% | $1,032 | $1,032 | $1,032 | $1,032 | $1,140 | $1,140 | $1,140 | $1,140 | $1,140 | $1,140 | $1,140 | $1,140 |
| Utilities | $1,500 | $1,500 | $2,000 | $2,000 | $1,500 | $1,500 | $1,500 | $1,500 | $1,500 | $1,500 | $1,500 | $1,500 | |
| Insurance | $150 | $150 | $150 | $150 | $150 | $150 | $150 | $150 | $150 | $150 | $150 | $150 | |
| Accounting Services | 15% | $200 | $200 | $200 | $200 | $200 | $200 | $200 | $200 | $200 | $200 | $200 | $200 |
| Other | $50 | $50 | $50 | $50 | $50 | $50 | $50 | $50 | $50 | $50 | $50 | $50 | |
| Total Operating Expenses | $18,562 | $18,762 | $20,762 | $22,762 | $19,890 | $19,240 | $18,590 | $18,390 | $18,290 | $17,290 | $17,390 | $17,890 | |
| Profit Before Interest and Taxes | $1,088 | $4,708 | $9,588 | $20,588 | $6,235 | $4,210 | $2,040 | $1,235 | ($25) | ($5,290) | ($4,280) | ($1,615) | |
| EBITDA | $1,338 | $4,958 | $9,838 | $20,838 | $6,485 | $4,460 | $2,290 | $1,485 | $225 | ($5,040) | ($4,030) | ($1,365) | |
| Interest Expense | $697 | $685 | $673 | $662 | $650 | $638 | $627 | $615 | $603 | $592 | $580 | $568 | |
| Taxes Incurred | $117 | $1,207 | $2,674 | $5,978 | $1,676 | $1,072 | $424 | $186 | ($189) | ($1,765) | ($1,458) | ($655) | |
| Net Profit | $274 | $2,816 | $6,240 | $13,948 | $3,910 | $2,500 | $989 | $434 | ($440) | ($4,117) | ($3,402) | ($1,528) | |
| Net Profit/Sales | 0.90% | 7.73% | 13.42% | 21.25% | 9.66% | 6.87% | 3.10% | 1.43% | -1.55% | -22.44% | -16.71% | -6.02% | |
| Pro Forma Cash Flow | |||||||||||||
| Sep | Oct | Nov | Dec | Jan | Feb | Mar | Apr | May | Jun | Jul | Aug | ||
| Cash Received | |||||||||||||
| Cash from Operations | |||||||||||||
| Cash Sales | $30,400 | $36,420 | $46,500 | $65,650 | $40,475 | $36,400 | $31,880 | $30,375 | $28,365 | $18,350 | $20,360 | $25,375 | |
| Subtotal Cash from Operations | $30,400 | $36,420 | $46,500 | $65,650 | $40,475 | $36,400 | $31,880 | $30,375 | $28,365 | $18,350 | $20,360 | $25,375 | |
| Additional Cash Received | |||||||||||||
| Sales Tax, VAT, HST/GST Received | 0.00% | $0 | $0 | $0 | $0 | $0 | $0 | $0 | $0 | $0 | $0 | $0 | $0 |
| New Current Borrowing | $0 | $0 | $0 | $0 | $0 | $0 | $0 | $0 | $0 | $0 | $0 | $0 | |
| New Other Liabilities (interest-free) | $0 | $0 | $0 | $0 | $0 | $0 | $0 | $0 | $0 | $0 | $0 | $0 | |
| New Long-term Liabilities | $0 | $0 | $0 | $0 | $0 | $0 | $0 | $0 | $0 | $0 | $0 | $0 | |
| Sales of Other Current Assets | $0 | $0 | $0 | $0 | $0 | $0 | $0 | $0 | $0 | $0 | $0 | $0 | |
| Sales of Long-term Assets | $0 | $0 | $0 | $0 | $0 | $0 | $0 | $0 | $0 | $0 | $0 | $0 | |
| New Investment Received | $0 | $0 | $0 | $0 | $0 | $0 | $0 | $0 | $0 | $0 | $0 | $0 | |
| Subtotal Cash Received | $30,400 | $36,420 | $46,500 | $65,650 | $40,475 | $36,400 | $31,880 | $30,375 | $28,365 | $18,350 | $20,360 | $25,375 | |
| Expenditures | Sep | Oct | Nov | Dec | Jan | Feb | Mar | Apr | May | Jun | Jul | Aug | |
| Expenditures from Operations | |||||||||||||
| Cash Spending | $6,880 | $6,880 | $6,880 | $6,880 | $7,600 | $7,600 | $7,600 | $7,600 | $7,600 | $7,600 | $7,600 | $7,600 | |
| Bill Payments | $408 | $12,744 | $27,479 | $36,809 | $49,723 | $20,895 | $24,540 | $21,349 | $21,548 | $19,990 | $11,065 | $16,948 | |
| Subtotal Spent on Operations | $7,288 | $19,624 | $34,359 | $43,689 | $57,323 | $28,495 | $32,140 | $28,949 | $29,148 | $27,590 | $18,665 | $24,548 | |
| Additional Cash Spent | |||||||||||||
| Sales Tax, VAT, HST/GST Paid Out | $0 | $0 | $0 | $0 | $0 | $0 | $0 | $0 | $0 | $0 | $0 | $0 | |
| Principal Repayment of Current Borrowing | $1,400 | $1,400 | $1,400 | $1,400 | $1,400 | $1,400 | $1,400 | $1,400 | $1,400 | $1,400 | $1,400 | $1,400 | |
| Other Liabilities Principal Repayment | $0 | $0 | $0 | $0 | $0 | $0 | $0 | $0 | $0 | $0 | $0 | $0 | |
| Long-term Liabilities Principal Repayment | $0 | $0 | $0 | $0 | $0 | $0 | $0 | $0 | $0 | $0 | $0 | $0 | |
| Purchase Other Current Assets | $0 | $0 | $0 | $0 | $0 | $0 | $0 | $0 | $0 | $0 | $0 | $0 | |
| Purchase Long-term Assets | $520 | $520 | $520 | $520 | $520 | $520 | $520 | $520 | $520 | $520 | $520 | $520 | |
| Dividends | $0 | $0 | $0 | $0 | $0 | $0 | $0 | $0 | $0 | $0 | $0 | $0 | |
| Subtotal Cash Spent | $9,208 | $21,544 | $36,279 | $45,609 | $59,243 | $30,415 | $34,060 | $30,869 | $31,068 | $29,510 | $20,585 | $26,468 | |
| Net Cash Flow | $21,192 | $14,876 | $10,221 | $20,041 | ($18,768) | $5,985 | ($2,180) | ($494) | ($2,703) | ($11,160) | ($225) | ($1,093) | |
| Cash Balance | $41,192 | $56,068 | $66,289 | $86,330 | $67,562 | $73,547 | $71,367 | $70,873 | $68,170 | $57,010 | $56,784 | $55,691 | |
| Pro Forma Balance Sheet | |||||||||||||
| Sep | Oct | Nov | Dec | Jan | Feb | Mar | Apr | May | Jun | Jul | Aug | ||
| Assets | Starting Balances | ||||||||||||
| Current Assets | |||||||||||||
| Cash | $20,000 | $41,192 | $56,068 | $66,289 | $86,330 | $67,562 | $73,547 | $71,367 | $70,873 | $68,170 | $57,010 | $56,784 | $55,691 |
| Inventory | $23,000 | $12,250 | $12,950 | $16,150 | $22,300 | $14,350 | $12,950 | $11,250 | $10,750 | $10,100 | $6,350 | $7,250 | $9,100 |
| Other Current Assets | $3,500 | $3,500 | $3,500 | $3,500 | $3,500 | $3,500 | $3,500 | $3,500 | $3,500 | $3,500 | $3,500 | $3,500 | $3,500 |
| Total Current Assets | $46,500 | $56,942 | $72,518 | $85,939 | $112,130 | $85,412 | $89,997 | $86,117 | $85,123 | $81,770 | $66,860 | $67,534 | $68,291 |
| Long-term Assets | |||||||||||||
| Long-term Assets | $39,000 | $39,520 | $40,040 | $40,560 | $41,080 | $41,600 | $42,120 | $42,640 | $43,160 | $43,680 | $44,200 | $44,720 | $45,240 |
| Accumulated Depreciation | $0 | $250 | $500 | $750 | $1,000 | $1,250 | $1,500 | $1,750 | $2,000 | $2,250 | $2,500 | $2,750 | $3,000 |
| Total Long-term Assets | $39,000 | $39,270 | $39,540 | $39,810 | $40,080 | $40,350 | $40,620 | $40,890 | $41,160 | $41,430 | $41,700 | $41,970 | $42,240 |
| Total Assets | $85,500 | $96,212 | $112,058 | $125,749 | $152,210 | $125,762 | $130,617 | $127,007 | $126,283 | $123,200 | $108,560 | $109,504 | $110,531 |
| Liabilities and Capital | Sep | Oct | Nov | Dec | Jan | Feb | Mar | Apr | May | Jun | Jul | Aug | |
| Current Liabilities | |||||||||||||
| Accounts Payable | $0 | $11,838 | $26,268 | $35,119 | $49,031 | $20,073 | $23,828 | $20,629 | $20,871 | $19,628 | $10,505 | $16,252 | $20,207 |
| Current Borrowing | $85,000 | $83,600 | $82,200 | $80,800 | $79,400 | $78,000 | $76,600 | $75,200 | $73,800 | $72,400 | $71,000 | $69,600 | $68,200 |
| Other Current Liabilities | $0 | $0 | $0 | $0 | $0 | $0 | $0 | $0 | $0 | $0 | $0 | $0 | $0 |
| Subtotal Current Liabilities | $85,000 | $95,438 | $108,468 | $115,919 | $128,431 | $98,073 | $100,428 | $95,829 | $94,671 | $92,028 | $81,505 | $85,852 | $88,407 |
| Long-term Liabilities | $0 | $0 | $0 | $0 | $0 | $0 | $0 | $0 | $0 | $0 | $0 | $0 | $0 |
| Total Liabilities | $85,000 | $95,438 | $108,468 | $115,919 | $128,431 | $98,073 | $100,428 | $95,829 | $94,671 | $92,028 | $81,505 | $85,852 | $88,407 |
| Paid-in Capital | $20,000 | $20,000 | $20,000 | $20,000 | $20,000 | $20,000 | $20,000 | $20,000 | $20,000 | $20,000 | $20,000 | $20,000 | $20,000 |
| Retained Earnings | ($19,500) | ($19,500) | ($19,500) | ($19,500) | ($19,500) | ($19,500) | ($19,500) | ($19,500) | ($19,500) | ($19,500) | ($19,500) | ($19,500) | ($19,500) |
| Earnings | $0 | $274 | $3,090 | $9,330 | $23,279 | $27,188 | $29,688 | $30,678 | $31,112 | $30,672 | $26,555 | $23,153 | $21,624 |
| Total Capital | $500 | $774 | $3,590 | $9,830 | $23,779 | $27,688 | $30,188 | $31,178 | $31,612 | $31,172 | $27,055 | $23,653 | $22,124 |
| Total Liabilities and Capital | $85,500 | $96,212 | $112,058 | $125,749 | $152,210 | $125,762 | $130,617 | $127,007 | $126,283 | $123,200 | $108,560 | $109,504 | $110,531 |
| Net Worth | $500 | $774 | $3,590 | $9,830 | $23,779 | $27,688 | $30,188 | $31,178 | $31,612 | $31,172 | $27,055 | $23,653 | $22,124 |


