
Miami Beach Film Society
Executive Summary
The Miami Beach Film Society (MBFS) is a not-for-profit 501(c)(3) organization that is expanding to finally have a permanent home, The Miami Beach Cinematheque, which will not only serve as the home but will also be the office/headquarters for MBFS’ main annual event, THE FESTIVAL OF FILM FESTIVALS: The Miami Beach International Film Festival (MBIFF), which will debut in the second year of Cinematheque operation. This plan concentrates on the first year of operation, opening the Cinematheque with a strategic start-up “Founding Circle”, and then operating it through creative programming, marketing, product and service sales, and fundraising.
We are seeking funding to add to our previous donations, for initial start-up expenses to be used for build-out, rent and related issues, equipment, and initial cash to handle the first few months of expenses. Our annual revenue will continue with a combination of memberships, admissions to programs, product and services sales, fundraising activities, and city, county, and state grants.
We have already formed several strategic alliances with various organizations and businesses that will help or have helped to make the Cinematheque and MBIFF a success. During the first year of the Cinematheque, our business goals are in five main categories:
- Opening the space successfully;
- Generating earned revenue from a combination of ticket sales, product and service sales, and additional fundraising;
- Keeping gross profit margins high;
- Raising substantial percentages of revenue from grant sources to develop and maintain membership level;
- Including outreach as a main goal to include various audiences.
The Miami Beach Film Society’s mission is to provide a cultural alternative to the commercial film experience, and to celebrate and promote the artistic elements of the medium and related ones, and to nurture and promote the art of filmmaking itself. Included in the mission will be special consideration for the cultural diversity of Miami Beach. The Cinematheque will be a base to utilize, enjoy, learn, and discover. It will also be a workplace of inclusion and respect, with a focus on the development of creativity and ideas.
MBFS has been programming special events for years, and the MBFS specialty has been success with collaboration with other cultural institutions, its creative programming utilizing the uniqueness of Miami Beach, and its outstanding sense of marketing.
The products and services provided by the Cinematheque will all complement the main mission of the organization, to provide a cultural alternative to the commercial film going experience. The standards of quality of the merchandise and services presented will be based on creativity and imagination, culminating in a unique experience for cinematheques. The Miami Beach Cinematheque will be different. Such creative programming as “Food & Film: Movies To Dine For”, “Yoga & Film”, and “Cafe Con Cinema” combines the intriguing and sometimes provocative aspects of our diversified local culture, supplemented by high quality merchandise that serves as educational souvenirs and reference material.
Our core market for the Cinematheque is the type of person who appreciates the arts and cinema in particular, and is interested in an alternative to the typical commercial offerings in the film and arts experiences. This core market exists in all the categories of our main markets, as described in detail in the Market Segmentation section, and our target markets are based on the biggest percentages of the pie, but we would like to develop the smaller percentages of the pie also, so we are targeting certain markets to develop that support.
There is no organization in South Beach that currently provides the services and emphasis that MBFS will provide for Miami Beach. Recently The Alliance “arthouse” Cinema on Lincoln Road closed, so the Cinematheque is filling an important gap in alternative programming. Our hard core film audience will be pleased to know that programming will be aimed in their direction, but with a different package. Squeezing seven nights out of an audience that supports one or two on a regular basis is why we will have programming such as “Views From the Underground” and “Foreign Film Fridays” in our programming line-up for niche markets and outreach for underserved audiences, as well as “Jazz or Classical Filmbrunch” featuring live entertainment and a lighter fare appealing to a wider audience.
With our singular focus on film and related arts, we have a solid direction and we are positioned as the premiere source for cinema and photographic arts presentation and education in Miami Beach. The Cinematheque will be the main venue for film appreciation, enrichment, and enjoyment of all the related arts and activities tied to the art of film. Therefore a marketing focus will be on these benefits of visiting and participating in the Cinematheque. Through our diverse range of programs, a fresh experience for frequent visitors will provide an ongoing development in the appreciation, enjoyment, and education that the Cinematheque offers.
Key areas of our marketing strategy include membership development, development of the Founding Circle, The Cinematheque Newsletter and other direct mailings, telemarketing, on-site marketing of Cinematheque products and services, targeted advertisements, general listings, the website, radio and Public Service Announcements (PSA), flyers, programs, and brochures, the database, and press contacts.
MBFS has begun an extensive fundraising campaign to provide initial start-up costs for the Cinematheque. Each area of need will be strategically matched with a potential donor, starting with construction costs and ending with festival grants. The areas of fundraising include the Start-Up Donor Drive, grant development, fundraising events, hiring fundraising professionals, and sponsorship agreements, as well as research of other film festival operations.
The Miami Beach Cinematheque website www.mbcinema.com will be an example of the creativity and style for the film society and the eventual film festival. The website will have strategic directional links on all pages to lead to sales, whether on-line or later on-site. The Miami Beach International Film Festival website will be separate, www.miamibeachfilmfestival.com, and the two sites will mutually benefit by being linked at many strategic points.
Run for years by a Director and Board of Directors, the opening of the Cinematheque will expand the team to include an Operations Manager, and the Director will assume that position as he always has until the need arises to make it a paid position. As always, there will be volunteers in several capacities, and the volunteer Board will play a big part in organizing this area. They each will have a role in managing an area of volunteer duties. As the time comes closer to the Miami Beach International Film Festival (MBIFF) development, the team will be in place, ready for the bigger project, with potential managers in line for paid positions as they are needed. The Board of Trustees (Trustees), also volunteer, will be expanded and developed by the Director and Board to make available expert advise, donations of in-kind and products and services.
Founder and Director Dana Keith, Director of the Miami Beach Film Society since 1993 when he founded the non-profit organization, is uniquely qualified to run this project, which he has developed since incorporation. He has two bachelor’s degrees, one in Cinema (emphasizing film history, aesthetics, and criticism), and one in Fine Arts (emphasizing graphic arts with photography/photolithography), from the University of California, Santa Barbara. His film exhibition background includes management of the Arlington Center for the Performing Arts in Santa Barbara, and The Red Rock 11 Theatres, at the time the world’s largest theatre complex. Researching for Cinematheques and Museums for ten years in Europe has influenced his interests and has been invaluable in developing the conceptual ideas of the film society and Cinematheque. His collection of souvenir programs from all over the world covering the entire history of cinema is considered by experts as one of the world’s best, and will be a large aspect of the Cinematheque for marketing, exhibition, and education.

The Board of Directors has remained intact for years, serving in many capacities and helping to make MBFS a major part of the cultural structure of Miami Beach. Actress Barbara Pergament – Chairman, Lucille Acocella of Northwest Airlines – Secretary/Treasurer, George Neary, the Director of Cultural Tourism for The Greater Miami Visitors and Convention Bureau, Marybeth Sheehan with DeNiro Realty, Cristiane Roget of AP+Films International, and Seth Finkel, Esq. – Legal Consultant have all been long time volunteer supporters, and will now be even more instrumental in the expansion of the Society, helping to develop the Board of Trustees, and helping to guide the organization.
In line for important positions on the team include future Programmers/Production Directors Juan Carlos Zaldivar and Rhonda Mitrani. Director/producer Juan Carlos Zaldivar completed both his BFA and MFA in film studies at NYU Film School, served as a juror for the Sundance Film Festival short film category, and wrote/directed the Sundance trailers that year, How To Make A Bird, How To Make A Tree, and How To Make A River. He was elected a Sundance Film Institute Fellow that summer. Juan produces for the PBS show In The Life. He teaches at the Undergraduate Film Program at NYU, and is a member of the National Association of Latino Independent Producers.
Rhonda L. Mitrani, Director/producer/editor, is graduate of the University of Michigan, BFA. She began her film career at Miramax Films in New York as Post Coordinator on such films as Marvin’s Room, and assisted on Modulations which played at Sundance and Berlin Film Festivals. As editor, she was principal on such films as Hit and Run, and edited for the Internet company Pseudo Programs and recently for the film The Suitor. She is a regular editor for ABC news. Cuba Mia is her first feature documentary.
Other team members include Technical Coordinator Aleksandar Stojanovic of CWS Productions, Grants Consultant Pola Reydburd, Special Events Producer Paulo Sadri with TMG Productions, International Film Festival Liaison Sandy Mandelberger of International Media Resources, and North and South American Correspondent Jesse Rodriguiz based in Chicago. This international team forms the basis that will help make the Cinematheque and MBIFF a major success. The team is expected to grow as we develop.
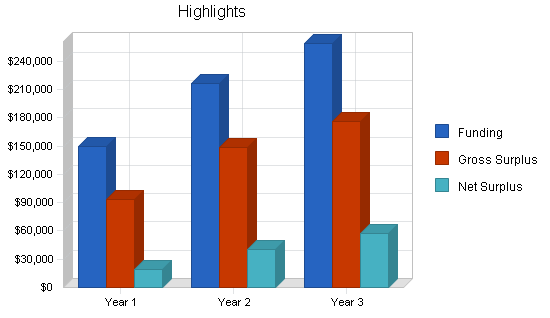
The balance sheet and the various tables of this plan show managed but sufficient growth of net worth, and a sufficiently healthy financial position. The yearly and monthly estimates are included in several topic areas, and in the appendix.
With continued growth as allowed by this strong plan, MBFS will be in position to continue development for the Miami Beach International Film Festival, which will grow after the first year into a major international film festival, while the Cinematheque continues to thrive as a successful addition to Miami Beach culture.
1.1 Objectives
During the first year of the Cinematheque, our business goals are:
- To open the space on Espanola Way with a basic build-out, helped by the in-kind and monetary donations of appropriate partners, individuals and businesses.
- To generate over $10,000 monthly in earned income by the end of the first year from a combination of ticket sales to various programming, memberships, retail sales in several departments, outreach, meeting space fees and related services, Internet and telephone services, and additional fundraising.
- To keep a strong gross profit margin of at least 60% from sales of products and services.
- To receive at least $10,000 in the first year from newly developed funding sources such as grants that will come over time depending on deadlines and qualifications.
- To develop and maintain a strong membership base at different levels of donorship.
- To develop an outreach program that includes new markets and opens the doors for the ultimate programming goal: The Miami Beach International Film Festival, which will debut just months into the second year.
1.2 Mission
The Miami Beach Film Society’s mission is to provide a cultural alternative to the commercial film experience, and to celebrate and promote the artistic elements of the medium, and to nurture and promote the art of filmmaking itself. The Cinematheque will be the home of MBFS, and will provide an historical and unique environment for the the Society to pursue its mission.
Included in the mission will be special consideration for the cultural diversity of Miami Beach and the world, and the Cinematheque will serve as a base for the promotion of the inclusion of international elements, with the ultimate display being The Miami Beach International Film Festival. The Cinematheque will become the base for film and arts appreciation for a wide spectrum of local cultural communities and visitors alike. It will a place to utilize, enjoy, learn, and discover. It will also be a workplace of inclusion and respect, with a main focus on the development of creativity and ideas.
Organization Summary
The Miami Beach Film Society (MBFS) has been a non-profit 501(c)(3) organization in existance since 1993. The timing is finally right for our mission to have a permanent home, so our new focus will be the development of The Miami Beach Cinematheque, which will provide a space for year-round programming and a working environment for the headquarters of the Miami Beach International Film Festival.
MBFS has been presenting programming in unique ways for years on Miami Beach, combining film with other important aspects of Miami Beach culture such as the utilization of the celebrated architecture (such as “Vintage Films in Art Deco Spaces”), the strong restaurant industry presence of the beach (with “Food and Film: Movies to Dine For”, a five year sold-out series of films in restaurants where the chef creates a menu inspired by the film of the night), Miami Beach history (with mini-festivals such as “The Esther Williams Film Festival at Miami Beach Swimming Pools”), and collaboration with other cultural institutions (such as “Shock of the New: Film in the New Age” with the Wolfsonian Museum, and “Ingmar Bergman: Women Dreams, and Demons” with the Bass Museum of Art).
We have currently been participating in the City of Miami Beach “2nd Thursdays” program, where the non-profit cultural arts organizations sponsor a free activity for beach residents and visitors. To gain momentum for our concept on Espanola Way, we have been presenting French films at the French Cafe A La Folie which will eventually be our next door neighbor. We will continue the series and expand on the idea, to include free films in the newly restored Plaza de Espana (see details below) while continuing to present in smaller venues such as A La Folie, and of course, we will show free films every “2nd Thursday” at the Cinematheque.
The Cinematheque will not only become a cultural “anchor” for Espanola Way, but for the City of Miami Beach. Besides a presentation space unlike any other, we will have a “museum” aspect, concentrating specifically on our realm of expertise, complementing the other museums on South Beach, to form a well rounded cultural network. The Cinematheque will be the home of the Cinematheque Archive, one of the world’s most complete and impressive collections of rare souvenir program booklets spanning the entire history of cinema, from 1895 to today, which will be utilized for exhibition, education, and promotion. An on-line tour of the Cinematheque Archive “The History of Cinema Illustrated by Souvenir Programs” will form a basis for the general understanding and reference of film history highlights, and will help to define the areas of programming at the Cinematheque and provide an entertaining and fascinating tool for people interested in furthering their knowledge of cinema history. Original programs from many countries, telling the story of American Silents and The Golden Age of the Studio System, German Expressionism, Russian Constructivism, Italian Neorealism, French Nouvelle Vague, and many more contemporary genres and movements will be utilized for in-house exhibitions. The on-line tour will eventually be published, and the exhibition will go on tour to other cinematheques and film museums around the world.
Below are examples of the over 5,000 original souvenir programmes from the Cinematheque Archive, spanning the entire history of cinema from 1895 to today, making up the on-line educational tour and eventual exhibition “The History Of Cinema Illustrated By Souvenir Programmes”:
- The Kiss, Edison 1896 USA/American
- Cabiria, Pastrone 1914 Italy/American
- Potemkin, Eisenstein 1925 USSR/German
- Metropolis, Lang 1926, Germany/German
- Citizen Kane, Welles 1941 USA/American
- Masculin/Feminin, Godard 1966, France/Danish
- Ugetsu, Mizoguchi 1953 Japan /German
- Persona, Bergman 1966, Sweden/Austrian
- Blue Velvet, Lynch 1986, USA/German
We have already formed several strategic alliances with various organizations and businesses that will help or have helped to make the Cinematheque and MBIFF a success.
The City of Miami Beach itself is an important ally, as a supporter of the Cinematheque and co-presenter of MBIFF. Director of Tourism Michael Aller and Mayor David Dermer, as well as other city officials have been supportive and helpful in recognizing the value of this important project.
The independent special event producer, TMG Productions, which produces our annual “Oscar Night” (an official licensed party of the Academy of Motion Picture Arts and Sciences itself), will continue to aid in fundraising for that annual party, and for others in the future, such as the special events for MBIFF.
Other professionals “in the field” (not based in Miami, but in other areas of the world in the film industry) will be of tremendous importance to development of sponsorship, programming, and alliances, for the Cinematheque and MBIFF. For example, Jesse Rodriguez, former Operations Manager for the Chicago Film Festival and other film festival capacities, will be a consultant in many development and operational areas, including sponsorship and programming. Sandy Mandelberger, of International Media Resources, will be consultant in development and liaison in the international film festival circuit.
Cultural organizations such as the New World Symphony, The Miami City Ballet, The Wolfsonian, The Bass Museum, and others all can or have participated in collaboration with MBFS. Collaborative presentations will be a major part of the Cinematheque, such as accompaniment by musical duets, dancers, or performance artists. MBIFF will specialize in collaboration to make a festival that incorporates many arts.
Schools and universities will be a major part of Cinematheque programming, and the Fisher Fineberg school will benefit by having the Cinematheque at its border. We plan to unite the schools by preparing programming with the schools in mind.
2.1 Programming
Programming at the Cinematheque will be a varied collection of types of nights that serve a wide spectrum of local Miami Beach and visitor contingencies. It will also offer several workshops and demonstrations that will continue the MBFS mission and allow a wider audience to participate in the Cinematheque activities. Tuesday through Sunday will have regular nights of specialized programming, and there will be creative monthly special events such as “Food & Film” where the best chefs provide a demo of their culinary inspirations based on a film. Also a monthly Meet The Artists event for the “2nd Thursdays Miami Beach Cultural Arts Night” will concentrate on bringing an arts appreciation to local students and independent film enthusiasts by allowing them to meet the directors and discuss their work.
Throughout the year the Cinematheque will also be available as a supplemental space for all the local film festivals, as a hub and meeting place for information and activities such as panels, intimate screenings, and photography exhibitions related to the current festival.
Miami Beach Cinematheque
Monthly Calendar (not including annual events such as festivals that would change this regular programming)
Mondays
(dark night available for private and corporate meetings)
Tuesdays
8:30pm ~Yoga and Film~
A transcendental visual and aural experience with non-narrative film.
Mats available for an actual enhanced yoga class.
Wednesdays
8:30pm Café Con Cinema
Films en Espanol, supplemented by tapas, and Flamenco or Salsa preludes
Thursdays
8:30pm Views From The uNderground
Cutting edge/experimental films from the microcinema movement that you won’t find at the cineplex
and every 2nd Thursday (free)
Meet the Artists
Your chance to meet the directors and discuss their work
Fridays
8:30pm Foreign Film Friday*
Films from the rest of the world
Saturdays
11:30am Jazz Filmbrunch
A light brunch with vintage films and a jazz intro
8:30pm Indies Under The Stars*
Independent films inside or in the courtyard
Sundays
11:30am Classical Filmbrunch
Light fare and silent or not-so-silent films with accompaniment
8:30pm GaySunDayNite
Gay themed films with, uh, dramatic intros, to say the least
and once a month on Sunday nights
“FOOD & FILM: Movies To Dine For”
South Beach’s best chefs demonstrate their talents, inspired by food on film.
*outdoor screenings weather permitting
THE FESTIVAL OF FILM FESTIVALS: The Miami Beach International Film Festival
THE FESTIVAL OF FILM FESTIVALS will be the largest annual project of MBFS, in collaboration with several international partners, and is in development as the Cinematheque opens. Debuting a year after the Cinematheque opening, the concept of the festival is to bring together the winners of the other international film festivals, in an end-of-the-year round-up, to compete once more in the main competition category.
MBIFF will be the last international film festival of the year, collecting the best of the best. Film festival directors from the chosen festivals (rotating every year to include 10-12) will be invited to present their winner, with the film’s director and stars, to promote their festival and the winning film.
There will be sidebars to the festival also, such as Florida On Film celebrating our rich tradition of local film making and festivals. For one week a year the Cinematheque will be everywhere, not just at its intimate year ’round home. The Cinematheque will remain the meeting place for the juries, the press conferences, and advance tickets and sales of official merchandise, but most of the screenings would be at various venues on South Beach.
2.2 Facilities
The Cinematheque Location is planned for 508 Espanola Way, just off the Plaza de Espana, in the historic “Spanish Village” in the heart of the Art Deco District of South Beach. It is housed in a 1925 Gothic Revival section of the Mediterranean Style Village. The city of Miami Beach is restoring the block with a million dollar renovation that includes streetscape upgrades, historically correct lamp posts, and iron signage. Next door is an authentic French cafe/creperie, as well as other restaurants and shops in development. Included in the city renovation plans is a major new pedestrian “esplanade” that will connect Lincoln Road to Espanola Way which leads directly to Plaza de Espana. The Cinematheque will help change the reputation of Espanola Way by becoming a major cultural anchor for the historic street, and it will bring new light to the area that has been inactive for years. It will continue the original 1925 plans of architect N.T.B Roney by providing space for bohemian artists within a unique revival of architectural styles.
The Cinematheque Facilities
With design by the celebrated interior designer Patrick Kennedy (designer of the Hotel Astor and Sagamore, among many other spaces on South Beach and beyond) the intimate Main Room will be the hub of activity where most programming will take place and films will be shown. The space is a Photographic Arts Gallery that shows films, as opposed to a formal theatre. It will be a small cafe/lounge-style arrangement for a relaxed viewing experience, with a seating capacity of less than 50. Not meant to be a presenting space for large festivals (such as the Miami Beach International Film Festival that will be mainly presented in other locations), but rather a space conducive to a year-round programming schedule of smaller scale, it will also be the main office for the larger festival, as well as the space for announcements associated with larger events, specialized and invitational screenings, and mini festivals. Continuing the fantasy tradition of Espanola Way, the ceiling will be a starred tribute to the “atmospheric theatres” of the 1920s and 30s. The design will be a clean updated space with Andalusian and Gothic influences, utilized as a gallery and screening room by night, and a post production studio by day.
The Cinematheque Gallery will also be within the main room, featuring ongoing exhibitions of world class cutting edge photography, graphics, video art, and performance art. The Cinematheque Archive and other collections will also appear as exhibitions.
The photographic gallery will have a strong alliance with the internationally known photography showcase. The showcase is a collection of international photographers who will be given the opportunity to have month long exhibitions at the Cinematheque and will form the base for a strong photographic presence in the arts on Miami Beach, another underdeveloped area.
“Classic Concessions” will be available during the film screenings, such as fresh popcorn, Cinematheque Sodas made from Italian syrups, juices, and seltzer spritzers (instead of modernized carbonation machines), and Tropical Sorbetto in frozen lemons, limes, and coconuts. Included will be favorite packaged candies from all over the world reminding people of home.
The second presentation space, also with an intimate seating capacity, will be the outdoor hotel courtyard that is next to the main gallery. Therefore the customers of the Cinematheque have two options for viewing “under the stars, indoors or out”.
The Florida Room is a production entity that will be servicing the Cinematheque on an on-going basis. The office/production room will be located within the Cinematheque and the placement creates synergy and mutual benefits for in-house productions and for the film industry that will be able to utilize the facilities. Besides offering services and facilities for film makers such as editing and sound development, there will be in-house introduction clips made for the Cinematheque and MBIFF, and “Miami Beach Newsreels” which will mix nostalgic Miami Beach history with modern coverage of Miami Beach events. film makers will make the “On-Screen Ads” for Cinematheque sponsors and Cinematheque products and services. This will allow the Cinematheque to form a standard of quality and creativity for images and promotions on its screen.
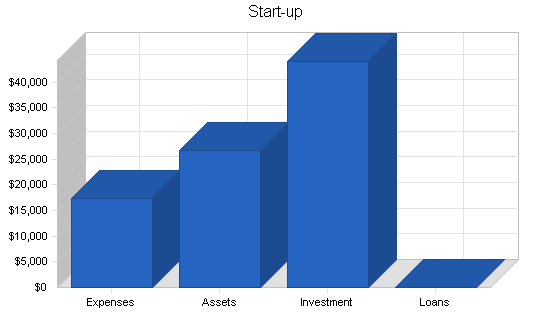
2.3 Start-up Summary
Our Start-up expenses are based on the costs involved with the build-out improvements of the planned space (an historic structure that needs upgrading), and for the marketing and operational expenses needed to get up and running for the first couple months until we get on our feet financially through programming, retail, and services income.
Construction Phase Strategic Alliances:
The City of Miami Beach itself is an important ally, as a supporter of the Cinematheque and co-presenter of MBIFF. Director of Tourism Michael Aller and Mayor David Dermer, as well as other city officials have been supportive and helpful in recognizing the value of this important project.
Espanola Way, Inc. owns the Matzanas Hotel which houses the proposed Cinematheque location. Linda Polansky, the main owner of the company, has been very helpful and understanding of our needs, and is very interested in helping to make the project a success for not only Espanola Way but for the cultural benefit of Miami Beach.
Architect Marty Hyman has been helping to strategize build-out, and has supplied the initial success and budget information. Interior Designer Patrick Kennedy has taken a personal interest in the community project, and will be offering his creative talents to make the design outstanding and unique.
Business Volunteers for the Arts has helped us incorporate and introduced us to Seth Finkel, Esq. who has remained our legal advisor pro bono for almost ten years. Seth is continuing to help on many levels. We plan to again utilize the BVA’s services to find help in other areas.
Construction services will be aided by a combination of local businesses in several areas such as cabinetry, ironwork, locksmith, plumbing, electrical, appliances, and fabrics. Committees are being formed to organize and fill the areas of need.
An example of areas of construction being sponsored is our agreement with Hotel Nash, as a major sponsor of the project. The Nash will be handling the air conditioning needs, among sponsoring later needs.
Design firms will be of great help, and have been, such as Suissa Design, who designed our logo and first brochure, and other design firms that have offered to help in the future.
Technical aspects are helped by CWS Productions, which has helped present the free 2nd Thursdays program, and which will help with Web design, technical presentation, and computer servicing.
The Espanola Way group marketing plan will be utilized, as well as our Greater Miami Convention and Visitor’s Bureau membership, to help network and create awareness.
An important alliance in development is with an internationally known electronics sponsor that will provide us with computers, projection equipment, and supplies.
Later alliances will develop in strategic categories for sponsorship of the Cinematheque and MBIFF.
| Start-up | |
| Requirements | |
| Start-up Expenses | |
| Legal | $0 |
| Start-up Office Costs (Software,etc) | $250 |
| Corporate Image (Stationery, Bcards, etc.) | $250 |
| Marketing Materials (Brochure/Packaging) | $250 |
| Website Start-up | $250 |
| Architectural Design | $1,325 |
| General Contractor | $1,350 |
| Electrical Connection | $1,000 |
| Plumbing/Electrical/AC Design | $1,300 |
| A/C including Hardware | $0 |
| Demolition | $0 |
| Construction Additions | $500 |
| Cabinetry, Finishing | $1,000 |
| Interiors (Fireplace, Frames, etc) | $500 |
| Drapery/Hardware | $500 |
| Flooring | $500 |
| Exteriors (Landscaping, Ironwork, Fountain, Stone) | $0 |
| Furniture (Theatre Chairs) | $500 |
| Locksmith | $0 |
| Appliances | $500 |
| Supply Set-up | $500 |
| Technical Installations | $0 |
| Computers/Phones | $0 |
| New Projection/Screen/Sound | $500 |
| Internet/Telephone Installation | $350 |
| Training | $0 |
| Telephone System | $0 |
| Insurance (Theft, Fire, Hurricane, Liability) | $0 |
| Rent (Last, Deposit) | $5,483 |
| Administration | $0 |
| Business Licence | $500 |
| Other | $0 |
| Total Start-up Expenses | $17,308 |
| Start-up Assets | |
| Cash Required | $16,692 |
| Start-up Inventory | $0 |
| Other Current Assets | $0 |
| Long-term Assets | $10,000 |
| Total Assets | $26,692 |
| Total Requirements | $44,000 |
| Start-up Funding | |
| Start-up Expenses to Fund | $17,308 |
| Start-up Assets to Fund | $26,692 |
| Total Funding Required | $44,000 |
| Assets | |
| Non-cash Assets from Start-up | $10,000 |
| Cash Requirements from Start-up | $16,692 |
| Additional Cash Raised | $0 |
| Cash Balance on Starting Date | $16,692 |
| Total Assets | $26,692 |
| Liabilities and Capital | |
| Liabilities | |
| Current Borrowing | $0 |
| Long-term Liabilities | $0 |
| Accounts Payable (Outstanding Bills) | $0 |
| Other Current Liabilities (interest-free) | $0 |
| Total Liabilities | $0 |
| Capital | |
| Planned Investment | |
| Account Balance for Buildout | $20,000 |
| Founding Donor | $1,000 |
| Founding Donor | $1,000 |
| Founding Donor | $1,000 |
| Founding Donor | $1,000 |
| Founding Donor | $5,000 |
| Founding Donor | $5,000 |
| Founding Donor | $2,500 |
| Premiere Memberships (50) ($100 each) | $5,000 |
| Memberships (50) ($50 each) | $2,500 |
| Grants | $0 |
| Additional Investment Requirement | $0 |
| Total Planned Investment | $44,000 |
| Loss at Start-up (Start-up Expenses) | ($17,308) |
| Total Capital | $26,692 |
| Total Capital and Liabilities | $26,692 |
| Total Funding | $44,000 |
2.4 Fundraising Strategy
MBFS has begun an extensive fundraising campaign to provide initial start-up costs for the Cinematheque. Each area of need will be strategically matched with a potential donor, starting with construction costs and ending with festival grants.
1. Start-up Donor Drive. Donor list development is the first step of the Start-Up Donor Drive and is already in motion, with development of a prospect list from our past and present supporters, and potential new ones, to match with the various levels of the Founding Circle and membership to assure a good match of donors with donor levels. Creation of special categories and targeted donations are being worked on for local businesses such as hotels, which will get a long term deal with tie-ins to participation in MBIFF. As members of the Founding Circle, they will be given special consideration when hotels are utilized for the larger festival. Specific In-Kind donation needs are being assembled as well, to match donors with needed items. Mailing of the Solicitation Letter will be done in stages as the lease is negotiated, because the letter for donations should be specific about location, and the revenue required for build-out is required to finalize the lease. The first letters will be limited to donors who will directly affect build-out commencement.
(see below text for Founding Circle Invitational letter)
You are invited to help make a new cultural institution on South Beach!
The Miami Beach Cinematheque
the new home of
The Miami Beach Film Society
and headquarters for the upcoming
Miami Beach International Film Festival
“THE FESTIVAL OF FILM FESTIVALS”
After years of presenting films on the beach in creative ways, the not-for-profit organization MBFS is finally building a new home where films will be presented lounge-and-café-style on a regular basis, along with exhibitions of photography, graphics from the Cinematheque Archive, and related arts and cutting edge projections. The Cinematheque will not only be a cultural institution for the community, but home to one of the most important new film festivals on the international circuit, as well as a supplementary venue for many of the existing ones. There will be two “screening rooms”, one intimate gallery space with a starred ceiling like the cinemas of the 1920’s and 30’s, and one beautiful Mediterranean courtyard, so movie-goers will “under the stars, indoors or out”.
Become a member of “The Founding Circle” of the Cinematheque.
There are several levels of participation, so please take the time to see how you can become part of the most exciting community project in a long time. The Founding Circle Members will appear on a permanent bronze plaque prominently displayed at the Cinematheque.
Donations can be either cash or non-cash (in-kind), and are tax deductible.
The benefits at each level include those benefits of levels below them. A sample of he benefits of each level are as follows:
Founding Premiere Sponsor $25,000 and over – A custom designed package of benefits
Founding Sponsor $10,000 – Customized On-Screen Ad, 160 tickets to regular screenings
Founding Premiere Patron $5,000 – Customized six month signage, 75 tickets to regular screenings
Founding Patron $2,500 – Customized animated logo, Customized one month signage, One day/night use of facilities, 35 tickets to regular screenings
Founding Donor $1,000 – Customized ad in programmes and newsletter, 20 tickets to regular screenings
Founding Friend $500 – Listings in programmes and newsletter, 10 tickets to regular screenings
Premiere Member $100 – Special offers from sponsors, MBFS T-shirt, membership benefits
Member $50 – 12.5% discount on tickets and subscription to MBCINEMA Newsletter (Students and Seniors receive 25% discount)
Membership commences when Cinematheque opens
Call 305 67-FILMS (673-4567) FOR MORE INFORMATION and details
We are looking forward to hearing from you soon.
###
Eventually a broader request for donations will be mailed to continue fundraising and open the Cinematheque. The Founding Circle Sponsors, Patrons, and Donors will achieve levels by either in-kind or cash donations. In-kind for build out, such as labor fee waivers and donated equipment will be as valuable because it will be for given for items we would otherwise need to purchase.
2. Grant development is already in motion also, with the hiring of a professional Grants Manager, Pola Reydburd, who is on board as one of the first MBFS paid positions. Ms. Reydburd is well known as one of the community’s best grants professionals, and we anticipate success with her services. She will interface with the Director and Grant Chair of the Board of Directors.
3. Fundraising events such as our annual Oscar Night®, the only officially licensed party in Miami of the Academy of Motion Picture Arts and Sciences, produced by TMG Productions, will continue to bring revenue for the Cinematheque. A variety of smaller events will also be developed to create revenue, such as movie premieres, and an upcoming fundraiser “Artists for the Art of Cinema”.
4. Fundraising professionals will be hired from many areas that will help with an international selection of sponsorship revenue and in-kind donations.
5. Sponsorship agreements will provide exclusive sponsorship in a specific industry (such as airline alliances or electronics or automotive industry). This will create on on-going relationship with sponsors and develop ties that create bonds and pride in sponsorship.
6. Research of other film festivals and cinematheque operations helps to form a fundraising target market, and provides valuable information. The Founder has attended the Cannes Film Festival for fifteen years, bringing back information and contacts for many activities.
Products and Services
The products and services provided by the Cinematheque will all complement the main mission of the organization, to provide a cultural alternative to the commercial film going experience. The standards of quality of the merchandise and services presented will be based on creativity and imagination, culminating in a unique experience unavailable even in other cinema venues. Where else can you find “Food & Film”, “Yoga & Film”, “Cafe Con Cinema” and other creative programming and products that combine the intriguing and sometimes provocative aspects of our diversified local culture, supplemented by high quality marketing materials that serve as educational souvenirs and reference material? Only at the Miami Beach Cinematheque.
Here are several categories of our services:
- Our programming will provide a wide variety of areas and specializes in catering to target markets.
- Our bookstore provides a research environment with new, used, and antiquarian books, as well as international newspapers.
- Our gallery is a showcase for international artists specializing in moving images, photography, graphics related to film, and related arts. Monthly changes in the installations will keep the look of the Cinematheque fresh and alive, and will attract repeat visitors.
- Our Main Room makes an unusual “boutique-style” meeting space for corporations, private parties, private film screenings, and films in progress dailies viewing.
- The Florida Room, the in-house production entity, makes images that fit into the fabric of the Cinematheque activities. Businesses will love to be involved when they see what our image makers can do for them, and see how their customized message relates to our audience.
Here are a few of our product categories:
- The programming will be supplemented by souvenirs such as postcards with images from the Cinematheque Archive which are tied into the themes of the Cinematheque. Many of these items will also be excellent examples of Miami Beach souvenirs.
- The Bookstore will have its own line of products such as bookmarks and agendas.
- The Gallery will feature high styled but practical design items such as yoga mats, candle and insense sets.
- The Cafe will have candies and baked goods from all over the world, and packaged items, worthy of a special trip, to take away. (The items are made off-site and delivered by a licensed provider.)
(See below example Cinematheque Concession Menu)
Cinematheque Concession Menu
The international specialties at the Cinematheque are from a wide range
of countries, and many are available for take-out or mail order.
“The Classic Concessions”
FRESH POPCORN out of The Cinematheque Box
CINEMATHEQUE SODAS made from natural Italian syrups, juices & spritzer
FROZEN SORBETTO in oranges, limes, lemons, and coconuts
INTERNATIONAL CANDIES & CHOCOLATES
Coffees, teas, and accompaniments from around the world to remind you of home
|
Beverages |
Country |
Accompaniments |
|
American Coffee |
USA |
Chocolate Chip Oatmeal Cookie |
|
Café au Lait |
FRANCE |
Marzipan Petit Fours |
|
Espresso |
ITALY |
Orange Pistachio Biscotti |
|
Kaffee Mocha |
GERMANY |
Currant Stollen |
|
Cafecito |
ARGENTINA |
Alfajor de Dulce de Leche |
|
White Russe Cappucino |
RUSSIA |
Pryanik |
|
Café Negro Colada |
BRAZIL |
Serenato de Amor |
|
Iced Kaffee |
GREECE |
Baklava |
|
Café Con Leche |
CUBA |
Pastelito de Guava |
|
Melange mit Schlag |
AUSTRIA |
Mohn Torte |
|
Café de Colombia |
COLOMBIA |
Turrones |
|
Almond Milk w/ Jordan Almonds |
JORDAN |
Medjool Date Kake |
|
Heisse Schocolade |
SWITZERLAND |
Toblerone |
|
Guarana de Venezuella |
VENEZUELLA |
Arepa de Fresas e Crema |
|
Fresh Lemonade |
HAITI |
Pineapple Tarte Tatin |
|
Chocolatada de Menta |
MEXICO |
Galletitas de Boda |
|
Colada de Pina |
PUERTO RICO |
Tembleque |
|
Ponche de Frutas |
SPAIN |
Tarta de Manzana |
|
Chai Tea |
THAILAND |
Lemon Grass Cookie |
|
Ryokutya (Green Tea) |
JAPAN |
Boyton in Rice Paper |
|
Te de Nana (mint) |
ISRAEL |
Ruggelah |
|
Earl Grey Tea |
ENGLAND |
Cranberry Walnut Scone |
|
Darjeeling Tea |
INDIA |
Rose Gulab Jamun |
|
Te Manzanailla (Cammoumille) |
PERU |
Mil Hojas |
|
Jasmine Tea |
CHINA |
Almond Fortune Cookie |
|
Iced Sun Tea |
MOROCCO |
Coconut Macaroon |
(See below example products available on-site or on-line)
Miami Beach Cinematheque On-Line and On-site Shopping in development.
The Bookstore/Gallery Line
- Postcards of the Cinematheque Archive
- Postcard Set
- MBFS Posters
- Bookmark Set
- Cinematheque Agenda
- The Beach Towel/Blanket
- The T-shirts
The “Yoga & Film” Line
- The “Yoga & Film” Mat
- The “Yoga & Film” Incense Set
- The “Yoga & Film” Candle Set
- The “Yoga & Film” CD
The Cinematheque Concessions
- The Cinematheque Boxes
- The “International Festival of Sweets” Box
- The “Classic Concessions” Box
- The Coffee & Tea Box
- The Customized “Boxed Social”
Market Analysis Summary
We have broken up our markets into four divisions to analyze the percentages of types of people who will come to the Cinematheque. The Miami Beach International Film Festival will have a different breakdown.
The four divisions are:
- Geographical
- South Beach Locals 27%
- South Florida Locals 27%
- Visiting Other Americans 12%
- Visiting South & Central American, & Caribbean 12%
- Visiting Europeans 12%
- Visiting Other Areas 10%
- Race, Religion, and Culture
- White Non-Jewish 27%
- Jewish 27%
- Hispanic 27%
- African American 7%
- Other 12%
- Psychographics (behavioral patterns or “types of people”, and people fitting into a certain market groups unrelated to the above categories)
- Students 18%
- Gay and Lesbian Community 15%
- Corporate Groups 13%
- Film Industry 12%
- Older Generation 15%
- other 27%
- Age
- under 10 5%
- 10-20 10%
- 21-35 33%
- 35-50 31%
- 50 and over 21%
Our core market for the Cinematheque is the type of person who appreciates the arts and cinema in particular, and is interested in an alternative to the typical commercial offerings in the film and arts experiences. This core market exists in all the categories above, and our target markets are based on the biggest percentages of the pie, but we would like to develop the smaller percentages of the pie also, so we are targeting certain markets to develop that support.
Below is a list of target market segments that the Cinematheque will appeal to:
South Beach Locals “into the arts scene”. This is possibly the main market for the Cinematheque. People who live here year-round and are yearning for just this type of venue. South Beach Locals tend to try to discover “local hangouts” that are trendy yet not overwhelmed by tourists, and are not on the beaten path. (When is the last time you saw a large gathering of locals on Ocean Drive?) This is mainly why the location on the west end of Espanola Way was chosen. The area is becoming an “in place” for locals, with the help of our institution.
Locals from other areas in Miami. The types of people who go to art films in other areas such as Coral Gables and Miami will go out of their way to come to see what’s going on here. This group will include students from FIT, UM and FIU, arts supporters, and young people attracted to South Beach who are looking for something to do “before or after dinner and before late night clubs”.
Older Generation Locals who have had few opportunities to participate in activities on South Beach that they can relate to. The nostalgia factor that will be a big part of the Cinematheque will attract many older people of many ethnic origins. This group will include “baby boomers” and senior citizens.
Hispanic People who are looking for an alternative to a typical South Beach experience. Wednesday nights, “Cafe Con Cinema” with Spanish language films, will be devoted to this market since it is an important major market in Miami, but of course this market will also enjoy any night or day at the Cinematheque.
Lesbian & Gay People looking for an alternative to the gay club scene on South Beach. Sunday nights will be devoted to this important South Beach market.
Corporate Groups utilizing services such as film editing facilities and meeting facilities.
The Local Jewish Community who will find many of our programs to be of interest as the Cinematheque will specialize in nitch programming to serve the needs of our audience constituency.
Upscale Tourists who are attracted to South Beach for its boutique-style architecture and Art Deco history, and would appreciate a cultural “boutique-style” alternative to a commercial movie theatre or touristy Ocean Drive “art gallery”. This project helps to keep them coming to South Beach.
Young International Students and Hostel Guests. This group is here on vacation so will always find time for leisure activities. Many Clay Hotel guests are European, with a tradition of appreciating cinema and arts of a wide variety. It is a part of their culture to appreciate and understand the alternative offerings of a Cinematheque. They also need to use the Internet to check email, etc, and are interested in their newspapers from their countries.
Film Industry Members seeking an interesting space for dailies and presentations for their films, and film festival attendees. Another international market important for Miami Beach tourism. This market will grow tremendously with the inclusion of MBIFF into the programming.
4.1 Target Market Segment Strategy
Some examples of the strategy to bring in targeted markets is shown below:
Locals Into the Arts Scene. Placement of Cinematheque away from the typical “touristy” areas where locals rarely go. Programming of local Kaffee, video artists, photographers, and designers. Furniture design by local designer. Strong connections with local newspapers and magazines.
Locals From Other Areas. Outreach to universities and other arts and film enthusiasts, by marketing directly to them, advertising in their publications, and sponsoring their events. Newspaper listings.
Older Generation Locals. Programming certain nights with them in mind, such as the nostalgic oriented brunch programming. Also special programming can be organized for the Miami Beach Senior Center which is one block away.
Hispanic Community. “Cafe Con Cinema” Spanish speaking Wednesday nights. Targeting Miami Film Festival crowd, upscale events.
Lesbian & Gay Community. Sunday nights. Wire magazine ads, info in gay clubs and especially more sophisticated gay events. Participating in gay events as supporter.
Corporate Groups. Solicit targeted businesses for meeting space, contact hotel group sales personnel.
Local Jewish Community. Program consideration and Cafe inclusion of Jewish specialties. Support other Jewish film events and provide additional venue for supplemental activities.
Upscale Tourists. Contact hotel concierge on a regular basis to keep flow of this market. Offer concierge incentive program. Chamber of Commerce, museums, upscale hotels brochure placement.
International Students and Hostel Guests. Make available Internet and long distance telephone services, as well as international books, and newspapers. Open door to hotel lobby for more direct access to Cinematheque.
Kaffee. Keep in constant touch with this market to provide a space they relate to. Provide written information at other festivals, websites, and production guide mailings, calls, follow-ups.
International film enthusiasts and film festival supporters. Website and Press Releases to direct them. Promotional materials at other film festivals and events and film industry locations.
4.1.1 Service Providers Analysis
There is no organization in South Beach that currently provides the services and emphasis that MBFS will provide for Miami Beach. In 2001 The Alliance Cinema on Lincoln Road closed, so the Cinematheque is filling an important gap in alternative programming. Serious film enthusiasts make up a minority of South Beach locals and even visitors, but our programming is aimed at making the experience of being at the Cinematheque as interesting as the films, so the project has a wider appeal, with a wider outreach program, and a wider variety of supporters. Our hard core film audience will be pleased to know that programming will be aimed in their direction, but with a different package. Squeezing seven nights out of an audience that supports one or two on a regular basis is why we will have “Those Avant-Garde Mondays” and “Cafe Con Cinema” in our programming line-up for niche markets as well as “Sunday Brunch at the Cinematheque” featuring live entertainment and a lighter fare appealing to a wider audience.
The current alternative film presenting venues on South Beach are supplementary to museums that emphasize another aspect of their programming (exhibitions of their permanent and visiting collections). The Wolfsonian and the Bass Museum both have small auditoriums for film viewing, but emphasize other aspects.
The current alternative theatres in other neighborhoods include the Soyka Cinema on Biscayne Boulevard in Miami, The Bill Cosford Cinema at the University of Miami campus in Miami, and The Abisenthe in Coral Gables.
We intend to form cooperative relationships with these venues, especially the South Beach venues that we already have formed a working relationship with in the past. MBIFF will utilize many South Beach venues, and the intention is to form a synergy in the neighborhood so the festival’s home is South Beach venues of several types.
Instead of seeing these venues as competition, we see them as venues that help form an audience, and we see the Cinematheque as a venue that will also help them in the same way.
Strategy and Implementation Summary
With our singular focus on film and related arts, we have a solid direction in focus and we are positioned as the premiere source for cinema and photographic arts presentation and education on Miami Beach. The Cinematheque will be the main venue for film appreciation, enrichment, and enjoyment of all the related arts and activities tied to the art of film. Therefore a marketing focus will be on these benefits of visiting and participating in the Cinematheque. Through our diverse range of programs, a fresh experience for frequent visitors will provide an ongoing development in the appreciation, enjoyment, and education that the Cinematheque offers.
Key areas of our marketing strategy include the following:
Membership development and growth as a means to provide recurring revenue. Participation in the Cinematheque will have many benefits, and by extending an impressive value proposition at all levels, we expect to quickly expand our membership to include a wide variety of people, and our retention and renewal level should remain high as a result of updating and perpetually adding new and exciting benefits.
The first stage of membership in the Cinematheque will be the development of the Founding Circle. This will be the group of corporations and individuals who participated in the ground floor construction phase of the Cinematheque, and will be acknowledged on a bronze plaque placed prominently on premise. Through either in-kind or cash donations or a combination of both, membership in the Founding Circle of the Cinematheque will be achieved on several levels:
Founding Premiere Sponsor ($25,000 and above). This level will receive a customized benefit package that individually suits the provider, with the most prominent presentation credit.
Founding Sponsor ($10,000 and above). This level will also receive a customized benefit package that individually suits the provider, with second most prominent presentation credit, customized On-Screen Ad, and 160 complimentary tickets to regular attractions.
Founding Premiere Patron ($5,000 and above). Customized signage for six months and 75 tickets to regular screenings.
Founding Patron ($2,500). Customized animated logo for one month, customized signage for one month, 35 tickets to regular screenings.
Founding Donor ($1,000). Customized ad in programmes and newsletter. 20 tickets to regular screenings.
Founding Friend ($500). Listing in programmes and newsletter, 10 tickets to regular screenings.
The levels of MBFS membership in the Cinematheque are:
Charter Premiere Member ($100). Special offers from corporate sponsors, MBFS T-shirt, plus membership benefits.
Charter Member ($50). A discount of 12.5% for regular screenings, subscription to the newsletter, invitations to special events and parties. Student and Senior Annual Members receive 25% off.
Annual membership starts the day the Cinematheque opens, but Charter and Founding Members pay in advance, allowing those doors to open!
Regular ticket prices will be $8 for “One Night Members”, $7 for Annual Members, and $6.5 for Students and Senior Annual Members. Special events are priced separately, and don’t apply to discounts unless stated.
MBCINEMA, the Cinematheque Email Newsletter and direct mailings will be our regular marketing platform for products, services, and events. It will also be a way to document the history of the Cinematheque and show new visitors what they will receive as a member.
Telemarketing will be the follow-up to direct mailings to make the sale if the mailings haven’t yet. Telephone calls will be a way to keep in touch individually with members, and get feedback and requests.
On-site Marketing of Cinematheque products and services will be one of our most important ways to convey messages and direct people to revenue generating centers. There will be constant awareness of what one can see, do, and buy through a variety of imaginative graphic placements and “On-Screen Advertisements” and “teasers”. With a captive audience of those who already made the effort to participate, we will be successful in spreading the word of all we have to offer, enjoying a word-of-mouth push that keeps people coming.
Targeted Advertisements will form a diversity of support for the Cinematheque. Instead of concentrating on daily promotions of specific films (which will also be included in the marketing budget but only when appropriate and sponsored), there will be marketing efforts for specific “areas” of programming, such as “Cafe Con Cinema” aimed at the Spanish speaking market for Wednesday Nights, “Views From the uNderground” marketed to the hard core film buffs, and “GaySunDayNite” to the gay market. The advertisements will heavily promote the telephone number as a way to know the details, by calling 67-FILMS. The info will change weekly.
General Listings will also be broad in scope, giving information on types of nights and the number you can call for more information. Details will be provided in listings when needed and appropriate.
The Website will always be mentioned in advertisements as a place to buy advance tickets and other products. By selling advance tickets, we will know our capacities in advance and be able to judge when extra marketing is neccessary. Once at the site, there will be constant direction to revenue generating centers, such as the merchandise page full of interesting things to purchase. The website will also be a base for our mission of education with the tour of the Cinematheque Archive “The History of Cinema Illustrated by Souvenir Programs”. There will be a strategic placement of links to and from other websites.
Radio and PSAs will form a support group from a wider area, and we will participate in creative giveaways for awareness in targeted radio stations. The Cinematheque will specialize in Alternative music (lounge, classical, jazz, and retro) and the markets that appreciate these under-available music styles will be contacted by radio with custom sound mixes made by volunteers.
Flyers, programs, and brochures will be an important source of information and education to convey the mission of the film society. The Cinematheque Archive will be a wealth of visual material for a rich tradition of graphic use.
The Database will be an ever changing animal, and like the website, it will require constant updating. There will be an expansion of our present database to the categories of Present Members (in all categories), Nonmembers but on the mailing list, Potential Donors, Alliances, Vendors, Distributors and Producers, and Volunteers. By keeping good track of our customers, we will be better suited to market to them in certain ways. When they arrive with an advance purchase or a membership card that can be swiped for identification, we will always know who comes to what and how often they come.
Press Contacts will be expanded to include an international array of publications and journalists that are interested in the Cinematheque and what is has to offer. Organized and well timed press releases will be able to inform a variety of target markets what is happening.
5.1 Fundraising Strategy
Start-up Donor Drive. The Start-up Donor Drive effort depends on the commitment of key volunteers to raise funds through corporate and individual contributors throughout the area. This includes leveraging the resources of corporate sponsors and initiating the Founding Circle program where businesses are partnered with specific areas of need. Sponsors and Donors are recognized in numerous ways for the valuable role they play in the organization. We anticipate the drive to cover the opening expenses.
Monthly revenues. Revenues for the 2002-2003 opening will be supported by programming and memberships at first, and development of products and services. The forecasted revenue ranges fluctuate from a beginning low of just a few thousand dollars in our first month as we get open to a high in March, at the peak of season, when we have our annual Oscar Night fundraiser. Typically, July and August will be low season months, but we anticipate that this institution will have much less summer dips than other South Businesses that depend almost entirely on tourism.
Grants. MBFS is currently identifying grants on a national and local basis that complement the goals and efforts of the program. Grant sources have included the Miami Beach Cultural Affairs Council, The Visiter and Convention Bureau for projects that bring hotel room nights, Miami-Dade County, and State of Florida grants, Hannibal Cox grants for development of underserved audiences, and Miami Beach Community Development grants for building improvements. We anticipate that grants will be an important part of our yearly funding, and that is why a professional grants consultant has been hired.
Oscar Night®. This annual March event is always one of South Beach’s biggest and most anticipated parties of the year. Now an official licensee of the Academy of Motion Picture Arts and Sciences, the film society is the beneficiary of the party produced by TMG Productions. Since its inception in 1993, MBFS has had a tradition of Oscar Night benefits, and this highly publicized event has become an annual highlight and a financial success. This is due to continued public appeal, corporate sponsorships, and experienced volunteer leadership. This fundraiser should give a financial push after our first few months, just as the previous ones have given a base for our start-up funding.
Fundraising Professionals. These people will be added to the team to help develop bigger projects such as MBIFF. We anticipate their work will help underwrite the festival, with grants being the important matching factor. The Sponsorship agreements, aided by this team of professionals, will help create a base of on-going support for MBIFF.

| Funding Forecast | |||
| Year 1 | Year 2 | Year 3 | |
| Funding | |||
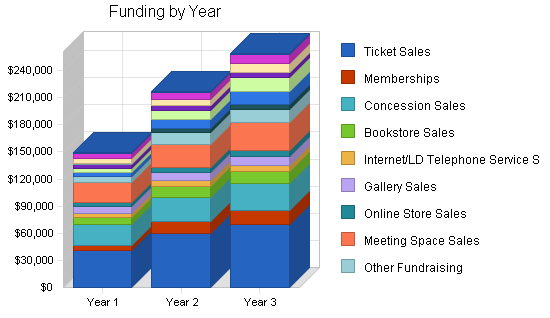
| Ticket Sales | $41,000 | $60,000 | $70,000 |
| Memberships | $5,100 | $13,000 | $15,000 |
| Concession Sales | $23,400 | $27,000 | $30,000 |
| Bookstore Sales | $8,000 | $12,000 | $13,000 |
| Internet/LD Telephone Service Sales | $4,900 | $6,000 | $7,000 |
| Gallery Sales | $7,300 | $9,000 | $10,000 |
| Online Store Sales | $4,500 | $6,000 | $7,000 |
| Meeting Space Sales | $22,000 | $25,000 | $30,000 |
| Other Fundraising | $7,000 | $13,000 | $15,000 |
| Miami Beach Grants | $0 | $5,000 | $5,000 |
| Miami-Dade Grants | $4,500 | $10,000 | $15,000 |
| State of Florida Grants | $4,500 | $10,000 | $15,000 |
| Merchandise Sales | $4,400 | $5,000 | $6,000 |
| Sponsorships | $1,000 | $0 | $0 |
| On-screen Advertising | $5,500 | $7,500 | $10,000 |
| MB Newsreels Product Placement | $5,500 | $7,500 | $10,000 |
| Donated Items (Books, etc.) | $710 | $800 | $900 |
| Total Funding | $149,310 | $216,800 | $258,900 |
| Direct Cost of Funding | Year 1 | Year 2 | Year 3 |
| Ticket Sales | $20,500 | $25,000 | $30,000 |
| Memberships | $120 | $150 | $200 |
| Concession Sales | $11,700 | $13,000 | $14,500 |
| Bookstore Sales | $2,200 | $3,500 | $4,000 |
| Internet/LD Telephone Service Sales | $1,200 | $2,000 | $3,000 |
| Gallery Sales | $1,650 | $1,800 | $2,100 |
| Online Store Sales | $2,000 | $3,000 | $4,000 |
| Meeting Space Sales | $0 | $0 | $0 |
| Other Fundraising | $0 | $0 | $0 |
| Miami Beach Grants | $600 | $600 | $600 |
| Miami-Dade Grants | $600 | $600 | $600 |
| State of Florida Grants | $500 | $600 | $600 |
| Merchandise Sales | $1,200 | $1,500 | $2,000 |
| Sponsorships | $0 | $0 | $0 |
| On-screen Advertising | $1,200 | $2,000 | $3,000 |
| MB Newsreels Product Placement | $1,200 | $2,000 | $3,000 |
| Donated Items (Books, etc.) | $0 | $0 | $0 |
| Subtotal Cost of Funding | $44,670 | $55,750 | $67,600 |
5.2 Milestones
The following table lists important program milestones, with dates and managers in charge, and budgets for each.

| Milestones | |||||
| Milestone | Start Date | End Date | Budget | Manager | Department |
| Conceptual Development | 1/1/2002 | 7/31/2002 | $0 | DK | Development |
| Funding | 1/1/2002 | 11/1/2002 | $0 | DK/BP | Development |
| Website | 3/1/2002 | 10/1/2002 | $500 | DK/AS | Web |
| Marketing | 5/1/2002 | 12/31/2002 | $1,000 | DK/JR | Marketing |
| Construction | 8/1/2002 | 11/30/2002 | $20,000 | DK/FF/CR | Construction |
| Interiors (Cabinetry, Appliances) | 8/1/2002 | 11/30/2002 | $2,000 | DK/CR | Interiors |
| Furniture | 7/15/2002 | 11/1/2002 | (showroom) | DK/RD | Furniture |
| Exteriors (Landscaping, Fountain, etc.) | 9/1/2002 | 11/1/2002 | (showroom) | DK/SM | Exteriors |
| Technical Installations | 9/1/2002 | 11/15/2002 | $1,000 | DK/AS | Technical |
| Programming | 6/15/2002 | 12/31/2002 | $1,000 | DK/JCZ | Programming |
| MBIFF Development | 4/1/2002 | 12/31/2002 | $1,000 | DK/RM/JCZ/CCZ | Production |
| Special Events | 8/1/2002 | 12/31/2002 | $1,000 | DK/RM/JCZ/CCZ | Production |
| Totals | $27,500 | ||||
Web Plan Summary
The Miami Beach Cinematheque website (www.mbcinema.com) will be the virtual business card and portfolio for the company, as well as its online “home”. The website will have strategic directional links at all pages to lead to sales, whether online or later on-site. The initial page is currently on the Web, with the other pages in development.
The concept and design of the website will be representative of the quality of design seen at the Cinematheque.
The website will have links to other sites, such as the MBIFF site, www.miamibeachfilmfestival.com. This site will be pointed to initiate at www.mbcinema.com first so visitors are introduced to the “home” of MBFS first, and then to programming and special events.
Email will be available as info@mbcinema.com for correspondence related to the Cinematheque, and info@miamibeachfilmfestival.com for correspondence related to MBIFF.
Online ticket sales and special program schedules will be available through the website, with software set up for that purpose.
Each page will have an option to link to a page that sells merchandise and services.
The design aspects of the websites are currently in development with the help of Creative Web Services, with design by Arturo Diaz Olmos for JR International Media . The website basic pages are being revealed soon as a preview of things to come.
(see below examples of text information for the www.mbcinema.com website pages. Design is in development. Coming soon…the www.miamibeachfilmfestival.com web design!)
MIAMI BEACH CINEMATHEQUE
Internet Bookstore Gallery/Archive Café Kino Production/Meeting Facilities
- Home of the MIAMI BEACH FILM SOCIETY
- Schedule/Showtimes/Tickets
- Headquarters for THE MIAMI BEACH INTERNATIONAL FILM FESTIVAL “the festival of film festivals”
- 510-580 Espanola Way Miami Beach, Florida 33139 305 673-4567
- www.mbcinema.com
The Miami Beach Cinematheque Bookstore specializes in film, arts, photography, and entertainment.
- By day, the Cinematheque is a warm and cozy bookstore and gallery, based in the main room, “The Florida Room”.
- Hours of operation 10am-5pm
- New, Used & Antiquarian Books and Periodicals, Postcards, Posters, Stationery, Internet and Business Services
- SCHEDULE of Book-signings and Readings
- The Bookstore line of products to order online or on-site
The Cinematheque Gallery has curated showings of photography, international video artists, and film related exhibitions.
- The Gallery is also host to the Cinematheque Archive of film related images. The Archive has one of the most complete collections of original souvenir program booklets in the world, spanning the entire history of cinema, from 1895 to today.
- SCHEDULE of Exhibitions
- TOUR the Miami Beach Cinematheque Archive
- The Gallery line of products to order online or on-site
The Café Kino specializes in international gourmet packaged foods for your enjoyment while at the Cinematheque, or to take away.
- The “Classic Concessions” – Think 1940’s…
- Popcorn out of the cool Cinematheque Box
- Cinematheque Sodas made from natural Italian syrups, juices, and spritzer
- Candies and chocolates from all over the world
- Frozen Tropical Sorbetto in lemons, limes, oranges and coconuts
- “The International Festival of Goodies”
- Coffees, teas, and accompaniments to remind you of home
- Available individually or in the Cinematheque Box
- “Boxed Socials” – Customized packages (In the Cinematheque Box) in theme with our “Boxed Social” nights
- The Café Kino line of products to order on-line or on-site
Post Production Facilities
- Editing and other facilities
- Concierge Services for Kaffee (including hotel accommodations, transportation, and more)
- Miami Beach Newsreels and On-Screen-Advertising (in-house productions)
Meeting Facility
- Private screenings and dailies
- Conference Room with Internet and Business Services
The Miami Beach Cinematheque is home to…
THE MIAMI BEACH FILM SOCIETY
- The Cinematheque has two auditoriums for MBFS screenings…”Under the stars, indoors and out” in “The Florida Room” or the “Moon Over Miami Outdoor Cinema”.
- About The Miami Beach Film Society
- Membership
- SCHEDULE & Showtimes/Online Tickets
The Cinematheque is also headquarters for…
THE MIAMI BEACH INTERNATIONAL FILM FESTIVAL: “The festival of film festivals”
- Debuting December 10-14, 2003
- About MBIFF
- Submissions
- MBFS Line of products to order online or on-site
Management Summary
MBFS has been run successfully since 1993 by a Founder/Director and Board of Directors. With the opening of the Cinematheque there will be an expansion of this team to include an Operations Manager. The Director will continue to assume the duties until the need arises to hire for this paid position. As always, there will be volunteers in several capacities, and the volunteer Board will play a big part in organizing this area. They each will have a role in managing an area of volunteer duties. As the time of the Miami Beach International Film Festival (MBIFF) approaches, the team will be in place, ready for the project development, with potential managers in line for paid positions as they are needed. The Board of Trustees (Trustees), also volunteer, will be expanded and developed by the Director and Board to make available expert advise, donations of in-kind and products and services.
The Founder/Director, the first full-time position of MBFS, has the following duties:
- Advise Board and receive guidance and approval from Board on general areas and major decisions.
- Develop and oversee daily operations, planning, and special events of MBFS in its home, the Cinematheque, and wherever else MBFS presents, including MBIFF working closely with the Operations Manager, Board of Directors, Programming and Production Team, and other volunteers.
- Develop the overall concept of programming structure and priorities, and oversee all creative aspects of programming and area development, including supplements to programming, product and services departments, merchandising, and film production at the Cinematheque and other venues, including MBIFF, working closely with Programming Manager and Production Manager.
- Develop the marketing plans of the various areas of the Cinematheque and MBIFF, and continue to manage all aspects, with volunteer assistants. Establish a marketing budget, develop marketing materials, advertising placement, website development and maintenance, newsletter maintenance, measure effectiveness of marketing activities (program tracking).
- Develop a network of support and outreach programs for the Cinematheque, working with the Membership/Fundraising Chairman (volunteer Board position). Direct mail plan, development of target sponsors, solicitation of sponsorship and membership.
- Personnel management (recruiting, hiring, training, supervision, evaluating, and terminating).
- Develop annual budget with Operations Manager for Board approval including necessary revisions.
The Operations Manager is hired by the Director. The part-time position duties will be as follows:
- Advise Board and receive guidance from and approval from the Board on areas concerning financial matters.
- Assist in personnel management in the areas concerning financial matters.
- Coordinate fiscal management of the association, with the Director, and with approval from the Board.
- Oversee preparation of the monthly and annual reports of activities and fiscal reports.
- Coordinate, develop, manage, and report to Director and Board of Directors the management of the annual budget, including necessary revisions.
- Coordinate work on annual audits and tax filing.
- Define priorities for supervised financial staff.
- Coordinate inventory management of products, supplies, and services.
The Programming/Production Directors are hired by the Director. The duties are as follows:
- Assist the Director with programming and supplements to programming such as symposiums and seminars, and question and answer periods.
- Assist the Director with the logistical aspects of programming such as contacts with directors and distributors, programming outreach and research, and preparation of symposiums, panels, and seminars.
- Promote and develop outreach programs for programming development, with the Director.
- Oversee, with approval from the Director, the program development of in-house productions such as Cinematheque On-Screen Ads and Miami Beach Newsreels with product placement.
- Assist with sponsorship ideas for the direct tie-ins with programming and in-house productions.
- Production of the on-screen film productions of the Cinematheque, with the Director’s approval, such as promotional clips to introduce the presentation, On-Screen Advertisements for both in-house products and services and local business sponsors that fit together in concept and style, and Miami Beach Newsreels with creative product placement.
- Cover the productions with sponsorship, with the Director’s approval from the target list of potential sponsors, to underwrite the productions and complete them.
- Assist the Director is gaining new and potential sponsors for On-Screen Ads and Miami Beach Newsreels, expanding the target list, and following through with “the account” to continue the relationship.
The Technical Coordinator is hired by the Director. The duties are as follows:
- To supervise and manage the technical aspects of the Cinematheque and MBIFF, such as the computer functioning, and logistical presentation of film screenings, working closely with the Director and potential sponsor of the technical area.
- To supervise the technical team at special events and manage the potential troubleshooting.
The Grants Consultant is hired by the Director. The duties are as follows:
- To develop the grant aspect of the film society as an important division in itself.
- To manage, with the Director, all aspects of researching, applying for, and keeping track of appropriateness and deadlines for grants, and follow-up of presentations.
- Advising on directions and ideas in developing the related fundraising activities with the Board of Trustees.
The Producer of Special Events is hired by the Director. The duties will be as follows:
- To produce the logistical aspects of the supplemental parties of MBIFF as designed by the Director.
- To cover the expenses of the parties by direct sponsor underwriting as approved by the Director from the target list of potential sponsors.
- Assist the society with potential growth of the target list of sponsors, for potential direct sponsorship of the parties.
- To follow up by organizing the aftermath and clean-up of the parties, making sure everyone is happy with the results.
The Sponsorship and Development Team is hired by the Director and come from several strategic areas of the world, all contributing from different points of view to bring different elements to the table:
- The International Film Festival Circuit Liaison will cover the connections between the world’s film festivals, bringing aspects of those festivals to MBIFF and the Cinematheque.
- The European Correspondent will cover Europe to bring those aspects to festival.
- The North American Correspondent will cover the same areas from the United States areas.
- The South American Correspondent will cover South America, Central America, and the Caribbean.
The Volunteer Positions are as follows:
The Board of Directors. As stated in our articles of incorporation, we have a minimum of five Board members. They represent various areas of business and the arts. The duties of the Board are:
- To meet at least quarterly to discuss the organizational activities of the society and advise and approve the general direction.
- To make decisions on the fiscal annual budget for the best benefit of the organization, and hold annual meeting.
- Maintain the organization’s corporate books and meeting minutes.
- To each be a Chair of a certain area with relevance to the health of the organization.
- The Membership/Fundraising Chair. Direct mail and email plan, existing and potential database development and management, renewal notices, special member mailings, solicitation of sponsorship and membership.
- The Volunteer Coordination Chair. Recruiting, organizing, developing a form for volunteer information, placing volunteers in appropriate areas, managing need for volunteers, managing volunteer benefits and reward system.
- The Fiscal Chair (Treasurer). Documenting for minutes the financial situation, Board point of view of finances, working with Operations Manager.
- The Grants Chair. Advising on and developing Grant possibilities, working with Grant Consultant to meet deadlines, solicit for needs for success in grants, help with steps obtain grants.
- The Outreach and Development Chair. Develop new markets and connections for film society.
There are also Volunteers in many areas such as:
Ticket Sales – At the box office and at special events.
Products and Services Sales – Waitstaff, deliveries, pick-ups, concessions in-house and at special events.
Marketing/Printing – Website, newsletter maintenance, production of printed supplements.
Public Relations – Pro bono services, assistance for pro bono providers.
Production – Film production assistance.
7.1 Personnel Plan
Founder and Director
Dana Keith
Director of the Miami Beach Film Society since 1993 when he founded the nonprofit organization. He has two bachelor’s degrees, one in Cinema (emphasizing film history, aesthetics, and criticism), and one in Fine Arts (emphasizing graphic arts with photography/photolithography), from the University of California, Santa Barbara. He developed and prepared the Summer Film Institute at UCSB, was editor and designer of the film department’s magazine Focus, and became apprentice at Paramount for the Art Director Robert Boyle (Production Designer for many Hitchcock films).
His film exhibition background includes management of the Arlington Center for the Performing Arts in Santa Barbara, and The Red Rock 11 Theatres in Las Vegas, at the time the world’s largest theatre complex.
He has also been Hospitality Manager for the Academy Awards at the Dorothy Chandler Pavilion in Los Angeles. His hospitality industry background includes being part of the opening team on two leading boutique-style hotels in South Beach, the Hotel Astor, in 1995, and the Hotel Nash, in 1999, where he continued as Guest Relations Manager and won “concierge of the year” in the Miami market, and also designed many marketing aspects of the hotel experience, especially aspects related to film.
Researching for Cinematheques and Museums for ten years in Europe while working as a model and photographer has influenced his interests and has been invaluable in developing the conceptual ideas of the film society and Cinematheque. He is a member of the Art Director’s Union, and The Screen Actor’s Guild.
Mr. Keith, with the help of the Board of Directors, will also assume the responsibilities of Operations Manager until the position is filled.
Board of Directors
Barbara Pergament, Chairman – Actress. 1980 S. Ocean Park 8K, Hallandale, FL 33009 (954) 456-0877
Lucille Acocella, Secretary/Treasurer – North West Airlines. 1228 West Ave., Miami Beach, FL 33139 (305) 532-3274
George Neary – Director of Cultural Tourism Greater Miami Visitors & Convention Bureau. 701 Brickell Ave. 2700, Miami FL 33131 (305) 539-3000
Marybeth Sheehan – DeNiro Realty. 9592 Majestic Way, Boynton Beach, FL 33137 (561) 734-6698
Cristiane Roget – West Coast Correspondent AP+Films International. P.O.Box 17715, Beverly Hills CA 90209 (310) 858-7062
Seth Finkel, Esq., Legal Consultant – Finkel and Associates. 28 West Flagler St., Miami, FL 33130 (305) 379-7538
Founding Circle and Board of Trustees
(in development for the Cinematheque and MBIFF)
Programming/Production Directors
Juan Carlos Zaldivar
Director/producer Juan Carlos Zaldivar completed both his BFA and MFA in film studies at NYU Film School. In 1990 his second short, Palingenesis, was nominated for a Student Academy Award. His award winning thesis film, The Story of The Red Rose, premiered at Sundance in 1997, winning a grant from the Warner Bros. Film Production Fund and a Silver Plaque at the Chicago Intl. Film Festival, and will air on Showtime this fall. In 1998 Juan served as a juror for the Sundance Film Festival short film category, and wrote/directed the Sundance trailers that year, How To Make A Bird, How To Make A Tree, and How To Make A River. He was elected a Sundance Film Institute Fellow that summer. Juan produces for the PBS show In The Life. He teaches at the Undergraduate Film Program at NYU, and is a member of the National Association of Latino Independent Producers.
Rhonda L. Mitrani
Director/producer/editor Rhonda Mitrani is graduate of the University of Michigan, BFA, where she directed her first short film Skin and Bones. She began her film career at Miramax Films in New York as Post Coordinator on such films as Marvin’s Room, and assisted on Modulations which played at Sundance and Berlin Film Festivals. As editor, she was principal on such films as Hit and Run (best screenplay LAIFF, 1999), and edited for the Internet company Pseudo Programs and recently for the film The Suitor. She is a regular editor for ABC news. Cuba Mia is her first feature documentary, which has already won Best Documentary at the Wolfson Florida Moving Image Archive Awards.
Technical Coordinator Aleksandar Stojanovic – CWS Productions
Grants Consultant Pola Reydburd
Special Events Producer Paulo Sadri – TMG Productions, Miami Beach, FL/Beverly Hills, CA
International Film Festival Liaison Sandy Mandelberger – International Media Resources, New York, NY
North and South American Correspondent Jesse Rodriguiz, Chicago, IL
| Personnel Plan | |||
| Year 1 | Year 2 | Year 3 | |
| Payroll | $16,500 | $30,000 | $35,000 |
| Other | $0 | $0 | $0 |
| Total People | 1 | 1 | 1 |
| Total Payroll | $16,500 | $30,000 | $35,000 |
Financial Plan
The basis for planning has been to look forward with conservative estimates for revenue and expenses. We are committed to the steady growth of revenues through tight control of all inventory, services, and managing sponsorship funds. Our financial plan focus will be to remain profitable while building adequate cash reserves for further stages of development.
We anticipate carrying one month worth of inventory, with the concession turning over more often, and the majority of items in the sales areas will be sold on cash basis, while the website sales will be mostly by credit card (unless customers request a hold at the box office for cash payment). The majority of items in the gallery will be sold on consignment and therefore do not affect inventory turnover.
Our personnel burden will be relatively low at 15% based on assumption that the only benefits paid will be minimal vacation for full time positions, employment fees, and healthcare plan.
The estimate of 8% funding on credit refers to the delay between commitment of funding and actual receipt of funds.
8.1 Important Assumptions
The financial plan depends on important assumptions, most of which are shown in the following table. The key underlying assumptions are:
- We assume a slow-growth economy, with slow recovery after a national catastrophe, and have therefore set income levels substantially lower than capacity allows.
- We assume of that there will be no major changes in federal grant funding availability.
- We assume that our summer months will be slower than others, but not as slow as some businesses depending completely on tourism to survive. Our local business will help in our low months.
- We assume that a major weather catastrophe could affect business, and we hope it does not happen at all, especially in our first year.
- We assume a growing interest in the arts and alternative arts appreciation on South Beach.
- We anticipate a very popular success!
| General Assumptions | |||
| Year 1 | Year 2 | Year 3 | |
| Plan Month | 1 | 2 | 3 |
| Current Interest Rate | 6.00% | 6.00% | 6.00% |
| Long-term Interest Rate | 10.00% | 10.00% | 10.00% |
| Tax Rate | 0.00% | 0.00% | 0.00% |
| Other | 0 | 0 | 0 |
8.2 Break-even Analysis
Based on our forecasted monthly fixed costs and aniticipated average monthly revenues our monthy break-even forecast is displayed in the table and chart below.

| Break-even Analysis | |
| Monthly Revenue Break-even | $8,872 |
| Assumptions: | |
| Average Percent Variable Cost | 30% |
| Estimated Monthly Fixed Cost | $6,218 |
8.3 Projected Surplus or Deficit
Our projected annual surplus is shown in the table. March surplus is due to the annual Oscar Night fundraiser, and we anticipate adding another major fundraiser to our lowest income month (perhaps August), to help with surplus that may dip at that time. A “Summer Soiree” at the Cinematheque may help to make August a high surplus month instead of a low one. Assumption of a modest first year August fundraiser is included in the table results.
Note that the surplus shown in the second and third years will not actually be a surplus. The profits will be utilized to help update facilities (after a modest phase one opening build-out to get open in the first year), expand personnel, and develop the Miami Beach International Film Festival.


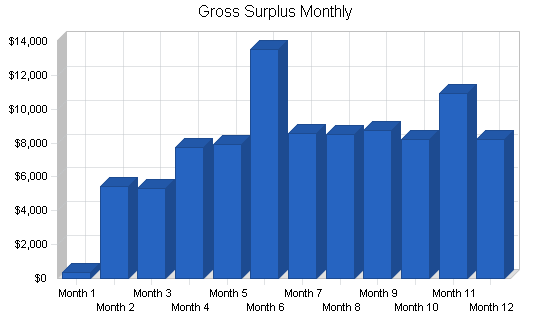
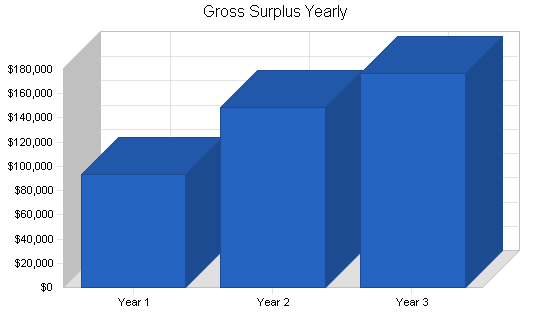
| Surplus and Deficit | |||
| Year 1 | Year 2 | Year 3 | |
| Funding | $149,310 | $216,800 | $258,900 |
| Direct Cost | $44,670 | $55,750 | $67,600 |
| Other Ticket Sales > Accompaniment | $8,250 | $9,000 | $10,000 |
| Other Ticket Sales > Shipment | $1,100 | $1,500 | $2,000 |
| Other Ticket Sales > Ticket Printing | $600 | $800 | $1,000 |
| Other Production Expenses | $1,200 | $1,500 | $2,000 |
| Total Direct Cost | $55,820 | $68,550 | $82,600 |
| Gross Surplus | $93,490 | $148,250 | $176,300 |
| Gross Surplus % | 62.61% | 68.38% | 68.10% |
| Expenses | |||
| Payroll | $16,500 | $30,000 | $35,000 |
| Sales and Marketing and Other Expenses | $19,000 | $29,700 | $34,800 |
| Depreciation | $0 | $120 | $120 |
| Operations Expenses 1 | $1,800 | $1,900 | $2,000 |
| Operations Expenses 2 | $600 | $1,000 | $1,300 |
| Operations Expenses 3 | $1,575 | $1,500 | $1,700 |
| Flood/Wind Insurance | $100 | $250 | $250 |
| Fire/Theft Alarm | $1,200 | $1,200 | $1,200 |
| Liability/Theft/Fire Insurance | $1,200 | $1,300 | $1,400 |
| Rent | $30,160 | $36,000 | $36,500 |
| Payroll Taxes | $2,475 | $4,500 | $5,250 |
| Other | $0 | $0 | $0 |
| Total Operating Expenses | $74,610 | $107,470 | $119,520 |
| Surplus Before Interest and Taxes | $18,880 | $40,780 | $56,780 |
| EBITDA | $18,880 | $40,900 | $56,900 |
| Interest Expense | $0 | $0 | $0 |
| Taxes Incurred | $0 | $0 | $0 |
| Net Surplus | $18,880 | $40,780 | $56,780 |
| Net Surplus/Funding | 12.64% | 18.81% | 21.93% |
8.4 Projected Cash Flow
Cash flow projections are critical to Cinematheque’s success. The monthly cash flow is shown in the illustration, with one bar representing the Cash Flow per month, and the other the monthly Cash Balance. The annual cash flow figures are included here and the more important detailed monthly numbers are included in the appendix.
Notice the levels of Cash Balance grows to allow development of future projects.
Notice that the Net Cash Flow, is of course, typically low of non-profit organizations in the first year of such an expansion.
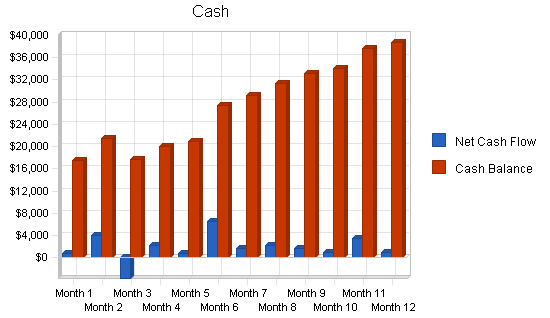
| Pro Forma Cash Flow | |||
| Year 1 | Year 2 | Year 3 | |
| Cash Received | |||
| Cash from Operations | |||
| Cash Funding | $137,365 | $199,456 | $238,188 |
| Cash from Receivables | $9,596 | $16,282 | $20,050 |
| Subtotal Cash from Operations | $146,961 | $215,738 | $258,238 |
| Additional Cash Received | |||
| Sales Tax, VAT, HST/GST Received | $0 | $0 | $0 |
| New Current Borrowing | $0 | $0 | $0 |
| New Other Liabilities (interest-free) | $0 | $0 | $0 |
| New Long-term Liabilities | $0 | $0 | $0 |
| Sales of Other Current Assets | $0 | $0 | $0 |
| Sales of Long-term Assets | $0 | $0 | $0 |
| New Investment Received | $0 | $0 | $0 |
| Subtotal Cash Received | $146,961 | $215,738 | $258,238 |
| Expenditures | Year 1 | Year 2 | Year 3 |
| Expenditures from Operations | |||
| Cash Spending | $16,500 | $30,000 | $35,000 |
| Bill Payments | $108,502 | $145,224 | $166,531 |
| Subtotal Spent on Operations | $125,002 | $175,224 | $201,531 |
| Additional Cash Spent | |||
| Sales Tax, VAT, HST/GST Paid Out | $0 | $0 | $0 |
| Principal Repayment of Current Borrowing | $0 | $0 | $0 |
| Other Liabilities Principal Repayment | $0 | $0 | $0 |
| Long-term Liabilities Principal Repayment | $0 | $0 | $0 |
| Purchase Other Current Assets | $0 | $0 | $0 |
| Purchase Long-term Assets | $0 | $0 | $0 |
| Dividends | $0 | $0 | $0 |
| Subtotal Cash Spent | $125,002 | $175,224 | $201,531 |
| Net Cash Flow | $21,960 | $40,514 | $56,707 |
| Cash Balance | $38,652 | $79,165 | $135,872 |
8.5 Projected Balance Sheet
The balance sheet in the following table shows managed but sufficient growth of net worth, and a sufficiently healthy financial position. The monthly estimates are included in the appendix.
| Pro Forma Balance Sheet | |||
| Year 1 | Year 2 | Year 3 | |
| Assets | |||
| Current Assets | |||
| Cash | $38,652 | $79,165 | $135,872 |
| Accounts Receivable | $2,349 | $3,410 | $4,072 |
| Inventory | $4,796 | $5,986 | $7,258 |
| Other Current Assets | $0 | $0 | $0 |
| Total Current Assets | $45,796 | $88,561 | $147,202 |
| Long-term Assets | |||
| Long-term Assets | $10,000 | $10,000 | $10,000 |
| Accumulated Depreciation | $0 | $120 | $240 |
| Total Long-term Assets | $10,000 | $9,880 | $9,760 |
| Total Assets | $55,796 | $98,441 | $156,962 |
| Liabilities and Capital | Year 1 | Year 2 | Year 3 |
| Current Liabilities | |||
| Accounts Payable | $10,224 | $12,090 | $13,831 |
| Current Borrowing | $0 | $0 | $0 |
| Other Current Liabilities | $0 | $0 | $0 |
| Subtotal Current Liabilities | $10,224 | $12,090 | $13,831 |
| Long-term Liabilities | $0 | $0 | $0 |
| Total Liabilities | $10,224 | $12,090 | $13,831 |
| Paid-in Capital | $44,000 | $44,000 | $44,000 |
| Accumulated Surplus/Deficit | ($17,308) | $1,572 | $42,352 |
| Surplus/Deficit | $18,880 | $40,780 | $56,780 |
| Total Capital | $45,572 | $86,352 | $143,132 |
| Total Liabilities and Capital | $55,796 | $98,441 | $156,962 |
| Net Worth | $45,572 | $86,352 | $143,132 |
Appendix
| Funding Forecast | |||||||||||||
| Month 1 | Month 2 | Month 3 | Month 4 | Month 5 | Month 6 | Month 7 | Month 8 | Month 9 | Month 10 | Month 11 | Month 12 | ||
| Funding | |||||||||||||
| Ticket Sales | 0% | $0 | $3,000 | $3,000 | $3,500 | $3,500 | $4,000 | $4,000 | $4,000 | $4,000 | $4,000 | $4,000 | $4,000 |
| Memberships | 0% | $1,000 | $800 | $400 | $400 | $400 | $400 | $400 | $400 | $400 | $200 | $100 | $200 |
| Concession Sales | 0% | $0 | $1,000 | $1,000 | $2,000 | $2,300 | $2,300 | $2,400 | $2,400 | $2,500 | $2,500 | $2,500 | $2,500 |
| Bookstore Sales | 0% | $0 | $500 | $500 | $800 | $800 | $800 | $800 | $800 | $800 | $700 | $800 | $700 |
| Internet/LD Telephone Service Sales | 0% | $0 | $300 | $300 | $400 | $400 | $500 | $500 | $500 | $500 | $500 | $500 | $500 |
| Gallery Sales | 0% | $0 | $500 | $500 | $600 | $600 | $800 | $800 | $800 | $800 | $700 | $600 | $600 |
| Online Store Sales | 0% | $0 | $0 | $0 | $500 | $500 | $500 | $500 | $500 | $500 | $500 | $500 | $500 |
| Meeting Space Sales | 0% | $0 | $2,000 | $2,000 | $2,000 | $2,000 | $2,000 | $2,000 | $2,000 | $2,000 | $2,000 | $2,000 | $2,000 |
| Other Fundraising | 0% | $0 | $0 | $0 | $0 | $0 | $5,000 | $0 | $0 | $0 | $0 | $2,000 | $0 |
| Miami Beach Grants | 0% | $0 | $0 | $0 | $0 | $0 | $0 | $0 | $0 | $0 | $0 | $0 | $0 |
| Miami-Dade Grants | 0% | $0 | $0 | $0 | $500 | $500 | $500 | $500 | $500 | $500 | $500 | $500 | $500 |
| State of Florida Grants | 0% | $0 | $0 | $0 | $500 | $500 | $500 | $500 | $500 | $500 | $500 | $500 | $500 |
| Merchandise Sales | 0% | $0 | $300 | $400 | $400 | $400 | $400 | $400 | $400 | $500 | $400 | $300 | $500 |
| Sponsorships | 0% | $0 | $0 | $0 | $0 | $0 | $0 | $0 | $0 | $0 | $0 | $1,000 | $0 |
| On-screen Advertising | 0% | $0 | $500 | $500 | $500 | $500 | $500 | $500 | $500 | $500 | $500 | $500 | $500 |
| MB Newsreels Product Placement | 0% | $0 | $500 | $500 | $500 | $500 | $500 | $500 | $500 | $500 | $500 | $500 | $500 |
| Donated Items (Books, etc.) | 0% | $0 | $0 | $200 | $0 | $0 | $100 | $100 | $0 | $110 | $100 | $0 | $100 |
| Total Funding | $1,000 | $9,400 | $9,300 | $12,600 | $12,900 | $18,800 | $13,900 | $13,800 | $14,110 | $13,600 | $16,300 | $13,600 | |
| Direct Cost of Funding | Month 1 | Month 2 | Month 3 | Month 4 | Month 5 | Month 6 | Month 7 | Month 8 | Month 9 | Month 10 | Month 11 | Month 12 | |
| Ticket Sales | $0 | $1,500 | $1,500 | $1,750 | $1,750 | $2,000 | $2,000 | $2,000 | $2,000 | $2,000 | $2,000 | $2,000 | |
| Memberships | $10 | $10 | $10 | $10 | $10 | $10 | $10 | $10 | $10 | $10 | $10 | $10 | |
| Concession Sales | $0 | $500 | $500 | $1,000 | $1,150 | $1,150 | $1,200 | $1,200 | $1,250 | $1,250 | $1,250 | $1,250 | |
| Bookstore Sales | $0 | $200 | $200 | $200 | $200 | $200 | $200 | $200 | $200 | $200 | $200 | $200 | |
| Internet/LD Telephone Service Sales | $100 | $100 | $100 | $100 | $100 | $100 | $100 | $100 | $100 | $100 | $100 | $100 | |
| Gallery Sales | $0 | $150 | $150 | $150 | $150 | $150 | $150 | $150 | $150 | $150 | $150 | $150 | |
| Online Store Sales | $0 | $100 | $100 | $200 | $200 | $200 | $200 | $200 | $200 | $200 | $200 | $200 | |
| Meeting Space Sales | $0 | $0 | $0 | $0 | $0 | $0 | $0 | $0 | $0 | $0 | $0 | $0 | |
| Other Fundraising | $0 | $0 | $0 | $0 | $0 | $0 | $0 | $0 | $0 | $0 | $0 | $0 | |
| Miami Beach Grants | $50 | $50 | $50 | $50 | $50 | $50 | $50 | $50 | $50 | $50 | $50 | $50 | |
| Miami-Dade Grants | $50 | $50 | $50 | $50 | $50 | $50 | $50 | $50 | $50 | $50 | $50 | $50 | |
| State of Florida Grants | $0 | $0 | $50 | $50 | $50 | $50 | $50 | $50 | $50 | $50 | $50 | $50 | |
| Merchandise Sales | $100 | $100 | $100 | $100 | $100 | $100 | $100 | $100 | $100 | $100 | $100 | $100 | |
| Sponsorships | $0 | $0 | $0 | $0 | $0 | $0 | $0 | $0 | $0 | $0 | $0 | $0 | |
| On-screen Advertising | $100 | $100 | $100 | $100 | $100 | $100 | $100 | $100 | $100 | $100 | $100 | $100 | |
| MB Newsreels Product Placement | $100 | $100 | $100 | $100 | $100 | $100 | $100 | $100 | $100 | $100 | $100 | $100 | |
| Donated Items (Books, etc.) | $0 | $0 | $0 | $0 | $0 | $0 | $0 | $0 | $0 | $0 | $0 | $0 | |
| Subtotal Cost of Funding | $510 | $2,960 | $3,010 | $3,860 | $4,010 | $4,260 | $4,310 | $4,310 | $4,360 | $4,360 | $4,360 | $4,360 | |
| Personnel Plan | |||||||||||||
| Month 1 | Month 2 | Month 3 | Month 4 | Month 5 | Month 6 | Month 7 | Month 8 | Month 9 | Month 10 | Month 11 | Month 12 | ||
| Payroll | 0% | $0 | $1,000 | $1,000 | $1,000 | $1,000 | $1,500 | $1,500 | $1,500 | $2,000 | $2,000 | $2,000 | $2,000 |
| Other | 0% | $0 | $0 | $0 | $0 | $0 | $0 | $0 | $0 | $0 | $0 | $0 | $0 |
| Total People | 1 | 1 | 1 | 1 | 1 | 1 | 1 | 1 | 1 | 1 | 1 | 1 | |
| Total Payroll | $0 | $1,000 | $1,000 | $1,000 | $1,000 | $1,500 | $1,500 | $1,500 | $2,000 | $2,000 | $2,000 | $2,000 | |
| General Assumptions | |||||||||||||
| Month 1 | Month 2 | Month 3 | Month 4 | Month 5 | Month 6 | Month 7 | Month 8 | Month 9 | Month 10 | Month 11 | Month 12 | ||
| Plan Month | 1 | 2 | 3 | 4 | 5 | 6 | 7 | 8 | 9 | 10 | 11 | 12 | |
| Current Interest Rate | 6.00% | 6.00% | 6.00% | 6.00% | 6.00% | 6.00% | 6.00% | 6.00% | 6.00% | 6.00% | 6.00% | 6.00% | |
| Long-term Interest Rate | 10.00% | 10.00% | 10.00% | 10.00% | 10.00% | 10.00% | 10.00% | 10.00% | 10.00% | 10.00% | 10.00% | 10.00% | |
| Tax Rate | 0.00% | 0.00% | 0.00% | 0.00% | 0.00% | 0.00% | 0.00% | 0.00% | 0.00% | 0.00% | 0.00% | 0.00% | |
| Other | 0 | 0 | 0 | 0 | 0 | 0 | 0 | 0 | 0 | 0 | 0 | 0 | |
| Surplus and Deficit | |||||||||||||
| Month 1 | Month 2 | Month 3 | Month 4 | Month 5 | Month 6 | Month 7 | Month 8 | Month 9 | Month 10 | Month 11 | Month 12 | ||
| Funding | $1,000 | $9,400 | $9,300 | $12,600 | $12,900 | $18,800 | $13,900 | $13,800 | $14,110 | $13,600 | $16,300 | $13,600 | |
| Direct Cost | $510 | $2,960 | $3,010 | $3,860 | $4,010 | $4,260 | $4,310 | $4,310 | $4,360 | $4,360 | $4,360 | $4,360 | |
| Other Ticket Sales > Accompaniment | $0 | $750 | $750 | $750 | $750 | $750 | $750 | $750 | $750 | $750 | $750 | $750 | |
| Other Ticket Sales > Shipment | $0 | $100 | $100 | $100 | $100 | $100 | $100 | $100 | $100 | $100 | $100 | $100 | |
| Other Ticket Sales > Ticket Printing | $50 | $50 | $50 | $50 | $50 | $50 | $50 | $50 | $50 | $50 | $50 | $50 | |
| Other Production Expenses | $100 | $100 | $100 | $100 | $100 | $100 | $100 | $100 | $100 | $100 | $100 | $100 | |
| Total Direct Cost | $660 | $3,960 | $4,010 | $4,860 | $5,010 | $5,260 | $5,310 | $5,310 | $5,360 | $5,360 | $5,360 | $5,360 | |
| Gross Surplus | $340 | $5,440 | $5,290 | $7,740 | $7,890 | $13,540 | $8,590 | $8,490 | $8,750 | $8,240 | $10,940 | $8,240 | |
| Gross Surplus % | 34.00% | 57.87% | 56.88% | 61.43% | 61.16% | 72.02% | 61.80% | 61.52% | 62.01% | 60.59% | 67.12% | 60.59% | |
| Expenses | |||||||||||||
| Payroll | $0 | $1,000 | $1,000 | $1,000 | $1,000 | $1,500 | $1,500 | $1,500 | $2,000 | $2,000 | $2,000 | $2,000 | |
| Sales and Marketing and Other Expenses | $1,675 | $1,375 | $1,575 | $1,575 | $1,600 | $1,600 | $1,600 | $1,600 | $1,600 | $1,600 | $1,600 | $1,600 | |
| Depreciation | $0 | $0 | $0 | $0 | $0 | $0 | $0 | $0 | $0 | $0 | $0 | $0 | |
| Operations Expenses 1 | $150 | $150 | $150 | $150 | $150 | $150 | $150 | $150 | $150 | $150 | $150 | $150 | |
| Operations Expenses 2 | $50 | $50 | $50 | $50 | $50 | $50 | $50 | $50 | $50 | $50 | $50 | $50 | |
| Operations Expenses 3 | $100 | $125 | $125 | $125 | $125 | $125 | $125 | $125 | $150 | $150 | $150 | $150 | |
| Flood/Wind Insurance | $0 | $0 | $0 | $0 | $0 | $0 | $0 | $0 | $25 | $25 | $25 | $25 | |
| Fire/Theft Alarm | $100 | $100 | $100 | $100 | $100 | $100 | $100 | $100 | $100 | $100 | $100 | $100 | |
| Liability/Theft/Fire Insurance | $100 | $100 | $100 | $100 | $100 | $100 | $100 | $100 | $100 | $100 | $100 | $100 | |
| Rent | $0 | $2,742 | $2,742 | $2,742 | $2,742 | $2,742 | $2,742 | $2,742 | $2,742 | $2,742 | $2,742 | $2,742 | |
| Payroll Taxes | 15% | $0 | $150 | $150 | $150 | $150 | $225 | $225 | $225 | $300 | $300 | $300 | $300 |
| Other | $0 | $0 | $0 | $0 | $0 | $0 | $0 | $0 | $0 | $0 | $0 | $0 | |
| Total Operating Expenses | $2,175 | $5,792 | $5,992 | $5,992 | $6,017 | $6,592 | $6,592 | $6,592 | $7,217 | $7,217 | $7,217 | $7,217 | |
| Surplus Before Interest and Taxes | ($1,835) | ($352) | ($702) | $1,748 | $1,873 | $6,948 | $1,998 | $1,898 | $1,533 | $1,023 | $3,723 | $1,023 | |
| EBITDA | ($1,835) | ($352) | ($702) | $1,748 | $1,873 | $6,948 | $1,998 | $1,898 | $1,533 | $1,023 | $3,723 | $1,023 | |
| Interest Expense | $0 | $0 | $0 | $0 | $0 | $0 | $0 | $0 | $0 | $0 | $0 | $0 | |
| Taxes Incurred | $0 | $0 | $0 | $0 | $0 | $0 | $0 | $0 | $0 | $0 | $0 | $0 | |
| Net Surplus | ($1,835) | ($352) | ($702) | $1,748 | $1,873 | $6,948 | $1,998 | $1,898 | $1,533 | $1,023 | $3,723 | $1,023 | |
| Net Surplus/Funding | -183.50% | -3.74% | -7.54% | 13.88% | 14.52% | 36.96% | 14.38% | 13.75% | 10.86% | 7.52% | 22.84% | 7.52% | |
| Pro Forma Cash Flow | |||||||||||||
| Month 1 | Month 2 | Month 3 | Month 4 | Month 5 | Month 6 | Month 7 | Month 8 | Month 9 | Month 10 | Month 11 | Month 12 | ||
| Cash Received | |||||||||||||
| Cash from Operations | |||||||||||||
| Cash Funding | $920 | $8,648 | $8,556 | $11,592 | $11,868 | $17,296 | $12,788 | $12,696 | $12,981 | $12,512 | $14,996 | $12,512 | |
| Cash from Receivables | $0 | $3 | $102 | $752 | $753 | $1,009 | $1,048 | $1,491 | $1,112 | $1,105 | $1,127 | $1,095 | |
| Subtotal Cash from Operations | $920 | $8,651 | $8,658 | $12,344 | $12,621 | $18,305 | $13,836 | $14,187 | $14,093 | $13,617 | $16,123 | $13,607 | |
| Additional Cash Received | |||||||||||||
| Sales Tax, VAT, HST/GST Received | 0.00% | $0 | $0 | $0 | $0 | $0 | $0 | $0 | $0 | $0 | $0 | $0 | $0 |
| New Current Borrowing | $0 | $0 | $0 | $0 | $0 | $0 | $0 | $0 | $0 | $0 | $0 | $0 | |
| New Other Liabilities (interest-free) | $0 | $0 | $0 | $0 | $0 | $0 | $0 | $0 | $0 | $0 | $0 | $0 | |
| New Long-term Liabilities | $0 | $0 | $0 | $0 | $0 | $0 | $0 | $0 | $0 | $0 | $0 | $0 | |
| Sales of Other Current Assets | $0 | $0 | $0 | $0 | $0 | $0 | $0 | $0 | $0 | $0 | $0 | $0 | |
| Sales of Long-term Assets | $0 | $0 | $0 | $0 | $0 | $0 | $0 | $0 | $0 | $0 | $0 | $0 | |
| New Investment Received | $0 | $0 | $0 | $0 | $0 | $0 | $0 | $0 | $0 | $0 | $0 | $0 | |
| Subtotal Cash Received | $920 | $8,651 | $8,658 | $12,344 | $12,621 | $18,305 | $13,836 | $14,187 | $14,093 | $13,617 | $16,123 | $13,607 | |
| Expenditures | Month 1 | Month 2 | Month 3 | Month 4 | Month 5 | Month 6 | Month 7 | Month 8 | Month 9 | Month 10 | Month 11 | Month 12 | |
| Expenditures from Operations | |||||||||||||
| Cash Spending | $0 | $1,000 | $1,000 | $1,000 | $1,000 | $1,500 | $1,500 | $1,500 | $2,000 | $2,000 | $2,000 | $2,000 | |
| Bill Payments | $113 | $3,664 | $11,367 | $9,114 | $10,767 | $10,206 | $10,621 | $10,455 | $10,410 | $10,630 | $10,577 | $10,577 | |
| Subtotal Spent on Operations | $113 | $4,664 | $12,367 | $10,114 | $11,767 | $11,706 | $12,121 | $11,955 | $12,410 | $12,630 | $12,577 | $12,577 | |
| Additional Cash Spent | |||||||||||||
| Sales Tax, VAT, HST/GST Paid Out | $0 | $0 | $0 | $0 | $0 | $0 | $0 | $0 | $0 | $0 | $0 | $0 | |
| Principal Repayment of Current Borrowing | $0 | $0 | $0 | $0 | $0 | $0 | $0 | $0 | $0 | $0 | $0 | $0 | |
| Other Liabilities Principal Repayment | $0 | $0 | $0 | $0 | $0 | $0 | $0 | $0 | $0 | $0 | $0 | $0 | |
| Long-term Liabilities Principal Repayment | $0 | $0 | $0 | $0 | $0 | $0 | $0 | $0 | $0 | $0 | $0 | $0 | |
| Purchase Other Current Assets | $0 | $0 | $0 | $0 | $0 | $0 | $0 | $0 | $0 | $0 | $0 | $0 | |
| Purchase Long-term Assets | $0 | $0 | $0 | $0 | $0 | $0 | $0 | $0 | $0 | $0 | $0 | $0 | |
| Dividends | $0 | $0 | $0 | $0 | $0 | $0 | $0 | $0 | $0 | $0 | $0 | $0 | |
| Subtotal Cash Spent | $113 | $4,664 | $12,367 | $10,114 | $11,767 | $11,706 | $12,121 | $11,955 | $12,410 | $12,630 | $12,577 | $12,577 | |
| Net Cash Flow | $807 | $3,986 | ($3,709) | $2,229 | $854 | $6,599 | $1,715 | $2,232 | $1,683 | $987 | $3,546 | $1,030 | |
| Cash Balance | $17,498 | $21,485 | $17,776 | $20,006 | $20,860 | $27,458 | $29,173 | $31,405 | $33,088 | $34,075 | $37,621 | $38,652 | |
| Pro Forma Balance Sheet | |||||||||||||
| Month 1 | Month 2 | Month 3 | Month 4 | Month 5 | Month 6 | Month 7 | Month 8 | Month 9 | Month 10 | Month 11 | Month 12 | ||
| Assets | Starting Balances | ||||||||||||
| Current Assets | |||||||||||||
| Cash | $16,692 | $17,498 | $21,485 | $17,776 | $20,006 | $20,860 | $27,458 | $29,173 | $31,405 | $33,088 | $34,075 | $37,621 | $38,652 |
| Accounts Receivable | $0 | $80 | $829 | $1,471 | $1,727 | $2,006 | $2,502 | $2,566 | $2,179 | $2,196 | $2,179 | $2,356 | $2,349 |
| Inventory | $0 | $561 | $3,256 | $3,311 | $4,246 | $4,411 | $4,686 | $4,741 | $4,741 | $4,796 | $4,796 | $4,796 | $4,796 |
| Other Current Assets | $0 | $0 | $0 | $0 | $0 | $0 | $0 | $0 | $0 | $0 | $0 | $0 | $0 |
| Total Current Assets | $16,692 | $18,139 | $25,570 | $22,558 | $25,979 | $27,277 | $34,646 | $36,480 | $38,325 | $40,080 | $41,050 | $44,773 | $45,796 |
| Long-term Assets | |||||||||||||
| Long-term Assets | $10,000 | $10,000 | $10,000 | $10,000 | $10,000 | $10,000 | $10,000 | $10,000 | $10,000 | $10,000 | $10,000 | $10,000 | $10,000 |
| Accumulated Depreciation | $0 | $0 | $0 | $0 | $0 | $0 | $0 | $0 | $0 | $0 | $0 | $0 | $0 |
| Total Long-term Assets | $10,000 | $10,000 | $10,000 | $10,000 | $10,000 | $10,000 | $10,000 | $10,000 | $10,000 | $10,000 | $10,000 | $10,000 | $10,000 |
| Total Assets | $26,692 | $28,139 | $35,570 | $32,558 | $35,979 | $37,277 | $44,646 | $46,480 | $48,325 | $50,080 | $51,050 | $54,773 | $55,796 |
| Liabilities and Capital | Month 1 | Month 2 | Month 3 | Month 4 | Month 5 | Month 6 | Month 7 | Month 8 | Month 9 | Month 10 | Month 11 | Month 12 | |
| Current Liabilities | |||||||||||||
| Accounts Payable | $0 | $3,283 | $11,065 | $8,755 | $10,427 | $9,852 | $10,272 | $10,108 | $10,055 | $10,278 | $10,224 | $10,224 | $10,224 |
| Current Borrowing | $0 | $0 | $0 | $0 | $0 | $0 | $0 | $0 | $0 | $0 | $0 | $0 | $0 |
| Other Current Liabilities | $0 | $0 | $0 | $0 | $0 | $0 | $0 | $0 | $0 | $0 | $0 | $0 | $0 |
| Subtotal Current Liabilities | $0 | $3,283 | $11,065 | $8,755 | $10,427 | $9,852 | $10,272 | $10,108 | $10,055 | $10,278 | $10,224 | $10,224 | $10,224 |
| Long-term Liabilities | $0 | $0 | $0 | $0 | $0 | $0 | $0 | $0 | $0 | $0 | $0 | $0 | $0 |
| Total Liabilities | $0 | $3,283 | $11,065 | $8,755 | $10,427 | $9,852 | $10,272 | $10,108 | $10,055 | $10,278 | $10,224 | $10,224 | $10,224 |
| Paid-in Capital | $44,000 | $44,000 | $44,000 | $44,000 | $44,000 | $44,000 | $44,000 | $44,000 | $44,000 | $44,000 | $44,000 | $44,000 | $44,000 |
| Accumulated Surplus/Deficit | ($17,308) | ($17,308) | ($17,308) | ($17,308) | ($17,308) | ($17,308) | ($17,308) | ($17,308) | ($17,308) | ($17,308) | ($17,308) | ($17,308) | ($17,308) |
| Surplus/Deficit | $0 | ($1,835) | ($2,187) | ($2,888) | ($1,140) | $733 | $7,682 | $9,680 | $11,578 | $13,111 | $14,134 | $17,857 | $18,880 |
| Total Capital | $26,692 | $24,857 | $24,505 | $23,803 | $25,552 | $27,425 | $34,373 | $36,372 | $38,270 | $39,803 | $40,826 | $44,549 | $45,572 |
| Total Liabilities and Capital | $26,692 | $28,139 | $35,570 | $32,558 | $35,979 | $37,277 | $44,646 | $46,480 | $48,325 | $50,080 | $51,050 | $54,773 | $55,796 |
| Net Worth | $26,692 | $24,857 | $24,505 | $23,803 | $25,552 | $27,425 | $34,373 | $36,372 | $38,270 | $39,803 | $40,826 | $44,549 | $45,572 |


