
Pyramid Engineering
Executive Summary
Pyramid Engineering is a firm specializing in mechanical, electrical, plumbing and fire protection. We provide engineering, design and consulting services on government, educational, health care and commercial facilities, and through subcontracting with architects working on such facilities. The firm provides engineering services using technologically superior processes, providing greater value for clients and enhanced design and construction.
The target clients are architectural firms. The targeted work is segmented into five categories: educational, health care, commercial and government facilities, and contractors. Pyramid’s competitive edge will be our knowledge of digital-based design resources. Superior customer service will also be a point of firm differentiation. Implementation of a quality control and assurance program will also provide a focus for production.
Pyramid Engineering, P.C. was created as a professional corporation chartered in Pennsylvania. The company is privately owned by the four founding partners: John Lavoie, Tom Heasley, John Solarczyk and Eric Haugh, all licensed engineers, with a combined 90 years of experience in their fields.
Year 1 sales are expected to exceed $350,000 and increase to in excess of $400,000 by the end of Year 2. The current year will mark the first year of profitability with expected profits rising significantly by the end of Year 3.
The most significant challenges ahead include expanding the client base, and ultimately positioning the firm to have a presence in a larger global market.
This business plan outlines the objective, focus, and implementation of this firm. We are seeking an additional $26,000 of short-term borrowing to maintain our cash flow over the next year as we become profitable.

1.1 Mission
Our mission is to provide top quality professional engineering service for construction and related activities to a balanced mix of public and private clients. We are committed to high standards of client service, staff development, ethical practice and reasonable profit.
Our clients will seek us out for our reputation as a truly integrated engineering firm whose ability to collaborate extends beyond our own walls to embrace our clients, the entire project team and the surrounding community.
We will be recognized for our design excellence, systems integration and commitment to sustainability. Our designs will advance the concept of the unity of people, materials and environment which function as a greater whole.
We seek to add value through innovation and creativity, aligning ourselves with our clients’ goals, delivering services that meet their quality, schedules and cost objectives.
1.2 Objectives
Pyramid has identified the following objectives:
- Revenues of $350,000 in Year 1, approaching $400,000 at the end of 5 years.
- Achieve 10% of market at the end of the fifth year of operation.
- Reach profitability within three years.
- Become a premier engineering firm in western and central Pennsylvania within five years.
1.3 Keys to Success
Pyramid has identified several keys to success that will be instrumental in creating a sustainable business. If these keys are followed, the likelihood of success will significantly increase.
- Excellence in providing professional quality services on time and on budget.
- Developing visibility to generate new business leads.
- Developing a follow-up strategy to gauge performance with clients.
- Implementing and maintaining a quality control and assurance policy.
- Leveraging expertise from our combined experience into multiple revenue generation opportunities: mechanical, electrical, plumbing, fire protection, and project consulting.
Company Summary
Pyramid Engineering was incorporated four years ago and is located in Altoona, Pennsylvania. Comprised of highly qualified registered professional engineers, Pyramid provides services in the fields of Electrical, Mechanical, Plumbing and Fire Protection Engineering. Market segments serviced by the firm include local and state governments, educational institutions, health care facilities, and commercial groups with facilities needed design, updates, or repair.
Pyramid’s engineers are registered in a total of 22 states and the District of Columbia, and together have over 90+ years of combined work experience. As a result of talent, dedication and hard work, Pyramid is able to provide expertise and leadership throughout an interactive design process. By maintaining communication and integrated design concepts, Pyramid creates a design unique to its clients’ needs.
Our services include consulting, engineering and design services, from conceptional design through building start-up, on a wide variety of facilities, including new and upgraded commercial, institutional, governmental, and health care complexes. Our focus will be public and private sector architectural markets in the Northeast, and direct consulting to government and health care groups with multiple facilities.
2.1 Company History
Pyramid Engineering was founded by the four partners. In 2000 it was incorporated as a professional corporation. The company was operated as a part time enterprise, building its initial client base. In October 2002, full time operation was started on a progressive schedule, until all of the partners were full time in May 2003.
In keeping with the company philosophy of avoiding the use of large start-up debt, the goal was to start-up as inexpensively as possible. This is in line with industry figures that show that engineering and consulting start-ups are ideal entrepreneurial opportunities with low start-up costs.
Total start-up expense was financed from accounts received from the 1999 through 2002 revenues. No salaries or payments to the partners were made during this initial start-up period.
Full time operation was started with existing revenues and accounts receivable of over $60,000. This was coupled with an initial SBA line of credit loan of $50,000 to cover the day to day operation and salary expense. Accounts receivable are billed monthly and usually paid net 60 days.
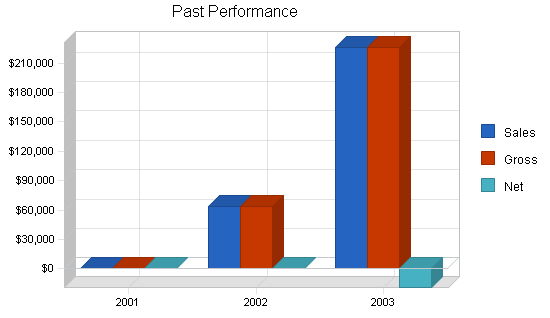
| Past Performance | |||
| 2001 | 2002 | 2003 | |
| Sales | $0 | $63,261 | $225,907 |
| Gross Margin | $0 | $63,261 | $225,907 |
| Gross Margin % | 0.00% | 100.00% | 100.00% |
| Operating Expenses | $0 | $25,341 | $249,828 |
| Collection Period (days) | 0 | 72 | 74 |
| Balance Sheet | |||
| 2001 | 2002 | 2003 | |
| Current Assets | |||
| Cash | $0 | $35,119 | $2,599 |
| Accounts Receivable | $0 | $25,040 | $67,130 |
| Other Current Assets | $0 | $0 | $0 |
| Total Current Assets | $0 | $60,159 | $69,729 |
| Long-term Assets | |||
| Long-term Assets | $0 | $5,345 | $9,628 |
| Accumulated Depreciation | $0 | $5,345 | $5,345 |
| Total Long-term Assets | $0 | $0 | $4,283 |
| Total Assets | $0 | $60,159 | $74,012 |
| Current Liabilities | |||
| Accounts Payable | $0 | $0 | $7,666 |
| Current Borrowing | $0 | $0 | $29,609 |
| Other Current Liabilities (interest free) | $0 | $0 | $0 |
| Total Current Liabilities | $0 | $0 | $37,275 |
| Long-term Liabilities | $0 | $0 | $0 |
| Total Liabilities | $0 | $0 | $37,275 |
| Paid-in Capital | $0 | $0 | $0 |
| Retained Earnings | $0 | $60,159 | $55,858 |
| Earnings | $0 | $0 | ($19,121) |
| Total Capital | $0 | $60,159 | $36,737 |
| Total Capital and Liabilities | $0 | $60,159 | $74,012 |
| Other Inputs | |||
| Payment Days | 30 | 30 | 30 |
| Sales on Credit | $0 | $63,261 | $225,907 |
| Receivables Turnover | 0.00 | 2.53 | 3.37 |
2.2 Company Ownership
Pyramid Engineering, P.C. was created as a professional corporation chartered in Pennsylvania. The company is privately owned by the four founding partners.
- John M. Lavoie, P.E. Mr Lavoie has over 50 years of diverse experience in electrical engineering, project management, and management for both large consulting firms and industry. He has designed power distribution, lighting, communication, security and fire protection systems for both newly constructed and renovated industrial, commercial, and institutional buildings. He is equally familiar and experienced in primary power distribution, variable speed drives systems, PLC, process control and instrumentation.
- Thomas C. Heasley, Jr., P.E. Mr Heasley has over 17 years of experience in electrical engineering and project management. His experience includes the design of medium and low voltage distribution systems, interior and exterior lighting, HVAC power and control, fire protection and alarm systems, telecommunications, security and CCTV systems, computer power, UPS and PLC control systems.
- John J. Solarczyk, P.E. Mr Solarczyk has over 14 years experience in mechanical engineering and project management. His experience includes the design of chilled water, hot water, steam and heat pump systems, performing energy efficiency surveys, and utilizing measuring and testing equipment. He is also very familiar with the latest building control systems, in particular, direct digital control systems.
- Eric C. Haugh, P.E. Mr Haugh has over 11 years experience in mechanical engineering. His experience includes the design of sanitary, storm, domestic water, gas and medical gas systems. He is NICET certified in sprinkler system layout, which includes the design of wet, dry, FM200 and standpipe systems.
Services
Pyramid Engineering offers complete building engineering services for mechanical, electrical, plumbing, and fire protection systems. We will focus on the following use and occupancies:

- Educational Facilities
- Health/Senior Facilities
- Commercial Buildings
- Government Facilities
- Program Management
- Contractor Design/Build Engineering Assistance
- Subcontracting services to other Architectural/Engineering Firms.
The company is project oriented, where each project involves:
- Renovations
- Rehabilitation
- Additions
- New construction
We offer innovative and economical design services, maintaining state-of-art design technology. We meet client needs on projects of all sizes.
Services include defining client needs, preparing bid documents, tendering bid analysis, construction review, payment certification, contract administration, warranty inspections. Projects include new facilities, renovations, repairs, and remodeling.
3.1 Sales Literature
We have developed a brochure system which covers a broad spectrum of target market segments. This system is modular in nature and includes many ‘boiler plate’ sections which may be edited to suite specific needs. Brochure inserts are maintained as individual sheets to facilitate their assembly in any custom situation.
Our website includes a description of services, the areas which we plan to serve, contact information, a list of representative projects, and brief resumes. The website address is http:\\www.pyramidmep.com.
We will continue to develop a series of templates for project proposals. The format for all proposals will include:
- Cover letter
- Scope of services for project
- Fee (if requested)
- Firms qualifications to provide services (overview)
- Project team (describes each persons tasks and qualifications)
- Philosophy of design approach
- Relevant experience
- Schedule to provide services
3.2 Technology
Pyramid Engineering utilizes modern technology at all phases of a project. All work is carried out using CAD software, including preliminary design and presentation work. It is more cost effective, quicker and more accurate than traditional methods. We also use specialty design software as well as internet transfer of information between ourselves, other consultants and our clients.
Pyramid maintains comprehensive, Windows based analysis tools for design.
Pyramid maintains an Internet website complete with file transfer and e-mail capabilities.
3.3 Future Services
Project Consulting: Proposed and billed on a per-project and per-milestone basis, project consulting offers a client company a way to harness our specific qualities and use our expertise to develop and / or implement plans, from conceptual planning to turnover. Proposal costs will be associated with each project.
Dispute Resolution: We will draw upon our broad range of construction and contract administration experience to provide dispute resolution services, including arbitration, mediation and expert reports for litigation.
Restoration Engineering: We would provide condition survey, design, and construction review services for repair of buildings.
Fabrication and Detailing Drawings: To serve the special needs of mechanical contractors, Pyramid will be offering these services to contractors in the future.
Market Analysis Summary
A very broad and extensive market base exists which, if properly pursed, can easily allow us to achieve our stated revenue / growth goals. Our targeted client base is taken from the following sectors:
- Governments – State, County, Local.
- Private Sector/Commercial – Developers, Realtors, Banks, Building Owners.
- Health Care/Senior Facilities
- Educational Institutions – Private and Public universities, Private Schools.
- Engineering/Architectural Firms – Subcontracting.
4.1 Market Segmentation
- Government: After years of government downsizing, the need for local and state government work will continue to be steady, as state agencies and local governments begin to renovate existing facilities to handle their restructured programs. This means the addition of new facilities and renovated spaces. Government construction spending should be on the increase.
- Educational: New school construction reached a high in the 1990’s, due to the ‘Baby-Boomer’ generation. In spite of voter demand for reduced taxes, education appears to still be receiving a strong vote of confidence. Education construction projects show continued growth for the early 2000’s.
- Private and Commercial Sectors: The emphasis is predominately on renovation of existing facilities, not new construction. Companies will continue to extract more efficient use of existing space, as they re-engineer existing operations through new work patterns. The retail industry is benefiting from an effort by many cities to rejuvenate core business districts. Renovation of existing centers to attract or retain shoppers is the key theme. Many retail chains are investing to give face lifts to older stores to remain competitive. The growth of mega retailers continues, with smaller stores on line for less populated areas.
- Health Care / Senior Facilities: Nationwide, managed care is in a state of flux. This new direction is fueling the potential growth and modification of health care delivery and health care facilities. Today, care giving and health maintenance have become natural extensions of existing businesses that include primary care, long term care, therapies, home care, hospice and respite care. Many other companies who have been on the sidelines over the years are now benefiting from expansion, including ancillary services, such as pharmacies, laboratories, medical equipment and drug research facilities. Investors and financial merger potentials are being attracted to larger scale ventures in the area of health care / senior facilities.
- Architectural and Engineering Firms: As a group, we have good working relationships with a number of architectural and engineering firms throughout the Northeast. We have consulted on several major projects over the last two years, and will continue to expand this segment of our services.

| Market Analysis | |||||||
| 2004 | 2005 | 2006 | 2007 | 2008 | |||
| Potential Customers | Growth | CAGR | |||||
| Educational | 3% | 200,000 | 250,000 | 300,000 | 262,656 | 269,222 | 7.71% |
| Health Care / Senior Facilities | 0% | 75,000 | 75,000 | 75,000 | 50,000 | 50,000 | -9.64% |
| Commercial | 0% | 30,000 | 30,000 | 30,000 | 30,000 | 30,000 | 0.00% |
| Government | 0% | 30,000 | 30,000 | 30,000 | 30,000 | 30,000 | 0.00% |
| Program Management | 0% | 5,000 | 5,000 | 5,000 | 5,000 | 5,000 | 0.00% |
| Contractor / Design Build | 0% | 5,000 | 5,000 | 5,000 | 5,000 | 5,000 | 0.00% |
| Sub Contracting | 0% | 5,000 | 5,000 | 5,000 | 5,000 | 5,000 | 0.00% |
| Total | 3.02% | 350,000 | 400,000 | 450,000 | 387,656 | 394,222 | 3.02% |
4.2 Target Market Segment Strategy
All of our target market segments have buildings or facility needs which require skilled engineering work to design and implement. They need engineers who understand their needs, their budget constraints, and the legal and code requirements for their facilities’ purposes and locations.
Our engineers are certified, with many years of experience in their fields, and ongoing relationships with government developers and planners, commercial developers, and local school districts throughout the Northeast. We will use these contacts to learn of new projects, develop competitive bids, and provide high-quality services to these market segments.
In addition, architectural and engineering firms often have need additional engineering consulting. Architects will always need skilled engineers to make their designs a reality, and large engineering firms sometimes have more work than they can handle.
In targeting work established architectural firms, our strategy is to offer them a viable resource from which to draw upon. We can undertake the entire mechanical, electrical, plumbing, and fire protection engineering process for their architectural projects.
4.3 Service Business Analysis
The engineering, design and consulting business consists of many smaller consulting organizations and individual consultants for every one of the few dozen well-known architectural / engineering companies.
Consulting participants range from major international name-brand consultants to hundreds of individuals. One of Pyramid’s challenges will be establishing itself as a “real” engineering, design and consulting company, positioned as a relatively risk-free corporate purchase.
4.3.1 Competition and Buying Patterns
The key element in purchase decisions made at the Pyramid client level is trust in the professional reputation and reliability of the engineering firm.
Pricing of projects and billing rates are surprisingly variable. In engineering at this level, it is easier to be priced too low than too high. Clients and potential clients expect to pay substantial fees for the best quality professional advice. The nature of the billing, however, is sensitive. Clients are much more likely to be offended when a job starts at $20K and ends up at $30K because of overruns, than if the same job started at $30K or even $35K.
Clients rarely compare consultants directly, looking for two, or more, possible providers for a proposed project or job. Usually, they follow word-of-mouth recommendations and past reputation, rather than selecting from a menu of possible providers.
The most important element of general competition, by far, is what it takes to keep clients for repeat business. It is worth making huge concessions in any single project to maintain a client relationship that brings the client back for the future projects.
Strategy and Implementation Summary
Pyramid will utilize its existing contacts with architects, governmental agencies, commercial developers and local school districts to increase word-of-mouth about our business. We have a standard brochure on our expertise and specialties which will be sent to architectural firms recommended to us by our current contacts.
Our marketing to architects and developers focuses on our thorough engineering expertise across the full range of skills necessary for any project. Examples of previous work and recommendations from former employers are available for the asking. Our individual reputations as reliable, skilled, knowledgeable resources, combined with our range of expertise as a team, will appeal strongly to those looking for subcontractors.
Pyramid has focused on the western and central Pennsylvania area initially. We are licensed to practice in most states in the eastern United States, and will continue to expand into these areas.
5.1 Competitive Edge
Pyramid Engineering, P.C. has the following competitive edges:
- State-of-the-art modeling, design, engineering, analysis and drafting capabilities.
- Quality control and assurance program.
- Experienced, knowledgeable owners/engineers, with a thorough understanding of building codes and the target market.
For established engineering and architectural firms who require mechanical, electrical, plumbing, and fire protection engineering and consulting services, Pyramid offers a competitive and economical option. Projects may be delegated to Pyramid directly or arrangements can be made to supplement and assist their own in-house staff.
Most engineering work is billed on an hourly basis to predetermined levels dictated by project schedule milestones. We have assigned a rate of $75/hour for basic engineering/consulting services and $40/hour for drafting services. These are conservative values for the engineering market. We have used conservative unit rates to remain more competitive.
5.2 Marketing Strategy
We will be using the internet and personal contacts in our sales promotion. These, together with a well targeted direct mail and e-mail campaign, will make all the major players in the marketplace aware of our presence.
We will focus our limited advertising budgets to promote community sponsored events. We will also offer technical services at discount rates to non-profit organizations.
5.3 Sales Strategy
Sales in our business is client service. It is repeat business. One doesn’t sell an engineering project, one develops a proposal that works for the client.
We must always be aware of the big-company consulting phenomenon of the split between selling the job and fulfilling the job, which leads to client dissatisfaction. The job should be developed, scoped, sold, and fulfilled by the same people. Our clients should never buy a job from one partner and have it delivered by anybody other than that same partner.
We need to avoid the temptation to drop fees to gain jobs. When a potential client questions the cost of a project, we explain the benefits. If the budget is for less money, then we must offer less service. Billing rates are not negotiated.
5.3.1 Sales Forecast
The following table and chart give a run-down on forecasted sales. In the last four months we have achieved sales of roughly $29,000 per month. We expect sales to remain at a relatively constant level for the next year.
Direct unit costs for the year consist solely of labor; these can be found in the Personnel Plan. Labor rates have been set at 70% of unit revenues, which yields a 30% gross margin. In the next year, we plan to increase gross margin to 35% as a result of providing a more efficient service to our clients.
Our unit rate for basic engineering/consulting service has been set at $75/hour. This is a conservative assumption based on published salary guideline levels for engineering professionals. Our unit rate for CAD services is $40/hour


| Sales Forecast | |||
| 2004 | 2005 | 2006 | |
| Sales | |||
| Educational | $199,992 | $250,000 | $238,304 |
| Health Care / Senior Facilities | $75,000 | $75,000 | $99,188 |
| Commercial | $30,000 | $30,000 | $39,675 |
| Government | $30,000 | $30,000 | $39,675 |
| Program Management | $4,980 | $5,727 | $6,586 |
| Contractor / design Build | $4,980 | $5,229 | $5,490 |
| Consulting Income | $4,800 | $4,800 | $4,800 |
| Total Sales | $349,752 | $400,756 | $433,718 |
| Direct Cost of Sales | 2004 | 2005 | 2006 |
| See Personnel Table | $0 | $0 | $0 |
| Other | $0 | $0 | $0 |
| Subtotal Direct Cost of Sales | $0 | $0 | $0 |
5.4 Milestones
The accompanying table lists important milestones, with dates and managers in charge, and budgets for each. The milestone schedule indicates our emphasis on planning for implementation. Early milestones concern planning for the next three years, followed by further development of marketing and sales literature. We have also included ongoing meetings and reviews to confirm that our planned sales and expenses are matching our actual results.

| Milestones | |||||
| Milestone | Start Date | End Date | Budget | Manager | Department |
| Business Plan | 10/15/2003 | 1/15/2004 | $0 | Lavoie | Administration |
| Secure line of credit | 10/15/2003 | 1/15/2004 | $0 | Haugh | Administration |
| Accounting Plan | 10/1/2003 | 2/1/2004 | $0 | Haugh/Lavoie | Administration |
| Professional Licensing Plan | 1/1/2004 | 2/1/2004 | $0 | Solaeczyk | Engineering |
| Press Release | 10/1/2003 | 2/1/2004 | $0 | Haugh | Marketing |
| Networking Plan | 10/1/2003 | 2/1/2004 | $0 | All | Marketing |
| Engineering proposal guides | 10/1/2003 | 3/1/2004 | $0 | Heasley | Marketing |
| Client Presentations Plan | 10/1/2003 | 3/1/2004 | $0 | Solarczyk | Marketing |
| Write / Update Mailer | 1/1/2004 | 3/15/2004 | $0 | Lavoie | Marketing |
| Review / Revise Brochure | 10/1/2003 | 3/15/2004 | $0 | Lavoie | Marketing |
| Client Contact Plan | 10/1/2003 | 3/15/2004 | $0 | Heasley | Marketing |
| Advertising Campagn Plan | 10/1/2003 | 3/15/2004 | $0 | Heasley | Marketing |
| Contract Guideline / Samples | 1/1/2004 | 3/15/2004 | $0 | Solarczyk | Department |
| Initiate Direct Mailer Plan | 1/1/2004 | 3/31/2004 | $0 | Lavoie | Marketing |
| Weekly Sales meetings | 1/1/2004 | 12/31/2004 | $0 | All | Marketing |
| Internet up and running | 10/1/2003 | 12/31/2004 | $0 | Haugh | Marketing |
| Regular check DGS & other sites | 1/1/2004 | 12/31/2004 | $0 | Solarczyk | Marketing |
| Weekly check PitCon Listings | 1/1/2004 | 12/31/2004 | $0 | Haugh | Marketing |
| Totals | $0 | ||||
Web Plan Summary
The website will be used as a marketing tool. It will offer a description of the services offered as well as listing of different clients served. Also included is a history of the firm, resumes of key members of the management team, and completed project descriptions and photographs.
6.1 Website Marketing Strategy
The plan for marketing the site is fairly simple: we will submit it to search engines such as Google, and list the website on all the company’s correspondence and printed marketing/sales media.
6.2 Development Requirements
Pyramid will develop and build the site. The initial website, www.pyramidmep.com, was up and running May 2003.
Management Summary
The company will be led by the four principals: John Lavoie, Tom Heasley, John Solarczyk and Eric Haugh.
John Lavoie has over 50 years of experience in electrical engineering, project management, and consulting management for both large consulting firms and industry.He has designed power distribution, lighting, communication, security and fire protection systems for both newly constructed and renovated industrial, commercial, and institutional buildings. He is equally familiar and experienced in primary power, distribution, variable speed drives systems, PLC, process control and instrumentation. His consulting firm management experience will provide the firm with direction and guidance needed in development of a new firm.
Tom Heasley has over 17 years of experience in electrical engineering and project management. His experience includes the design of medium and low voltage distribution systems, interior and exterior lighting, HVAC power and control, fire protection and alarm systems, security and CCTV systems, computer power, UPS and PLC control systems. Tom will be in charge of all electrical design.
John Solarczyk has over 14 years experience in mechanical engineering and project management. His experience includes the design of chilled water, hot water steam and heat pump systems, performing energy efficient surveys, and utilizing measuring and testing equipment. He is also very familiar with the latest building control systems, in particular, direct digital control systems. John will be in charge of all HVAC and mechanical design.
Eric Haugh has over 11 years experience in mechanical engineering. His experience includes the design of sanitary, storm, domestic water, gas and medical gas systems. He is also NICET certified in sprinkler system layout, which includes the design of wet, dry, FM200 and standpipe fire protection systems. Eric will be in charge of all plumbing and fire protection designs.
All four principals have professional engineering licenses in multiple states.
7.1 Personnel Plan
The Personnel table summarizes payroll for the next three years. John Lavoie will work on a part-time basis, while the other three partners will work full-time. We have no plans to hire any other employees at this time.
Our labor costs represent the direct cost of sales, but payments are made monthly, regardless of hours billed to clients.
| Personnel Plan | |||
| 2004 | 2005 | 2006 | |
| John J. Solarczyk | $73,452 | $76,144 | $78,069 |
| Thomas C. Heasley | $78,696 | $84,159 | $86,744 |
| Eric C. Haugh | $73,452 | $76,144 | $78,069 |
| John M. Lavoie | $22,728 | $22,843 | $24,722 |
| Other | $0 | $0 | $0 |
| Total People | 4 | 4 | 4 |
| Total Payroll | $248,328 | $259,290 | $267,604 |
Financial Plan
We want to finance growth mainly through cash flow and equity, but will need a second short-term loan, in the amount of $26,391, in the next year to cover our cash flow.
The most important factor in our case is collection days. We can’t push our clients hard on collection days, because they are larger companies and will normally have marketing authority, not financial authority. Therefore we need to develop a permanent systems of receivables financing, using one of the established accounting systems. In turn, we must intend to ensure that our investment is compatible with our growth plan, management style, and vision.
Compatibility in this regard means:
- A fundamental respect for giving our customers value, and for maintaining a healthy and congenial workplace.
- Respect for realistic forecasts, conservative cash flow, and financial management.
- Cash flow as first priority, growth second, profits third.
- Willingness to follow the plans objectives and contribute valuable input to strategy and implementation decisions.
The financial plan which follows summarizes information regarding the following items:
- Important Assumptions
- Key Financial Indicators
- Break-Even Analysis
- Projected Profit and Loss
- Projected Cash flow
- Projected Balance Sheet
- Business Ratios
8.1 Important Assumptions
The financial plan depends on important assumptions. From the beginning, we recognize that collection days are critical, but not a factor we can influence easily. Interest rates, tax rates, and personnel burden are based on conservative assumptions.
Some of the more important underlying assumptions are:
- We assume strong economy, without major recession.
- We assume that there are no unforeseen changes in economic policy to make our services immediately obsolete.
Others include 60-day average collection days, sales entirely on invoice basis, including a favorable deposit policy, expenses on a net 39-day basis, 30 days on the average for payment of invoices, and present-day interest rates.
| General Assumptions | |||
| 2004 | 2005 | 2006 | |
| Plan Month | 1 | 2 | 3 |
| Current Interest Rate | 6.00% | 6.00% | 6.00% |
| Long-term Interest Rate | 10.00% | 10.00% | 10.00% |
| Tax Rate | 30.00% | 30.00% | 30.00% |
| Other | 0 | 0 | 0 |
8.2 Projected Profit and Loss
The gross margin for a service-based business is a reflection of the efficiency at which those services are offered. labor is our primary expense, and the only cost directly associated with sales. Given our sales rate over the last 6 months, we expect both to remain fairly constant. Gross margin, because we use no inventory, looks to be 100% for all year. After taking labor into account, a more realistic gross margin for Year 1 is 26%. We expect that our increased efficiency in Years 2 and 3 will produce a higher annual gross margin of 34% and 38%, respectively.
Net Profit /Sales will increase steadily through 2005.


| Pro Forma Profit and Loss | |||
| 2004 | 2005 | 2006 | |
| Sales | $349,752 | $400,756 | $433,718 |
| Direct Cost of Sales | $0 | $0 | $0 |
| Hidden Row | $0 | $0 | $0 |
| Total Cost of Sales | $0 | $0 | $0 |
| Gross Margin | $349,752 | $400,756 | $433,718 |
| Gross Margin % | 100.00% | 100.00% | 100.00% |
| Expenses | |||
| Payroll | $248,328 | $259,290 | $267,604 |
| Sales and Marketing and Other Expenses | $7,200 | $7,200 | $7,200 |
| Depreciation | $612 | $612 | $612 |
| Rent | $7,200 | $7,200 | $7,200 |
| Utilities | $13,560 | $8,400 | $8,400 |
| Insurance | $12,000 | $12,000 | $12,000 |
| Payroll Taxes | $9,600 | $9,600 | $9,600 |
| 125 – Flexible Spending Account | $9,600 | $9,600 | $9,600 |
| Automobile Expense | $5,400 | $3,600 | $3,600 |
| Bank Service Charges | $600 | $600 | $600 |
| Charity / Contributions | $600 | $600 | $600 |
| Interest Expense | $1,800 | $360 | $360 |
| Licenses and Permits | $1,800 | $720 | $720 |
| Office Supplies | $6,000 | $6,000 | $6,000 |
| Payroll taxes & Expenses | $9,600 | $9,600 | $9,600 |
| Postage and Delivery | $840 | $850 | $860 |
| Printing and Reproduction | $2,400 | $2,400 | $2,400 |
| Professional Fees | $1,200 | $1,200 | $1,200 |
| Professional Improvement (CEUs) | $600 | $600 | $600 |
| Travel & Ent | $1,200 | $1,200 | $1,200 |
| Other | $0 | $0 | $0 |
| Total Operating Expenses | $340,140 | $341,632 | $349,956 |
| Profit Before Interest and Taxes | $9,612 | $59,124 | $83,762 |
| EBITDA | $10,224 | $59,736 | $84,374 |
| Interest Expense | $2,243 | $2,137 | $1,338 |
| Taxes Incurred | $2,211 | $17,096 | $24,727 |
| Net Profit | $5,158 | $39,891 | $57,697 |
| Net Profit/Sales | 1.47% | 9.95% | 13.30% |
8.3 Break-even Analysis
The following chart and table summarize our break-even analysis. We are currently averaging sales above our break-even point. Any decrease in sales lasting longer than 3 months will generate decreases in payroll across the board to maintain net profits and capital.

| Break-even Analysis | |
| Monthly Revenue Break-even | $28,345 |
| Assumptions: | |
| Average Percent Variable Cost | 0% |
| Estimated Monthly Fixed Cost | $28,345 |
8.4 Projected Cash Flow
Cash flow projections are critical to our success. The monthly cash flow is shown in the illustration, with one bar representing the cash flow per month, and the other the monthly balance. The first few months are critical. It may be necessary to inject additional capital in this time frame if the need arises. The annual cash flow figures are included here and more important detailed monthly numbers are included in the appendices.

| Pro Forma Cash Flow | |||
| 2004 | 2005 | 2006 | |
| Cash Received | |||
| Cash from Operations | |||
| Cash Sales | $0 | $0 | $0 |
| Cash from Receivables | $359,562 | $392,397 | $428,316 |
| Subtotal Cash from Operations | $359,562 | $392,397 | $428,316 |
| Additional Cash Received | |||
| Sales Tax, VAT, HST/GST Received | $0 | $0 | $0 |
| New Current Borrowing | $26,000 | $0 | $0 |
| New Other Liabilities (interest-free) | $0 | $0 | $0 |
| New Long-term Liabilities | $0 | $0 | $0 |
| Sales of Other Current Assets | $0 | $0 | $0 |
| Sales of Long-term Assets | $0 | $0 | $0 |
| New Investment Received | $0 | $0 | $0 |
| Subtotal Cash Received | $385,562 | $392,397 | $428,316 |
| Expenditures | 2004 | 2005 | 2006 |
| Expenditures from Operations | |||
| Cash Spending | $248,328 | $259,290 | $267,604 |
| Bill Payments | $95,598 | $100,387 | $107,243 |
| Subtotal Spent on Operations | $343,926 | $359,677 | $374,847 |
| Additional Cash Spent | |||
| Sales Tax, VAT, HST/GST Paid Out | $0 | $0 | $0 |
| Principal Repayment of Current Borrowing | $13,326 | $13,325 | $13,325 |
| Other Liabilities Principal Repayment | $0 | $0 | $0 |
| Long-term Liabilities Principal Repayment | $0 | $0 | $0 |
| Purchase Other Current Assets | $0 | $0 | $0 |
| Purchase Long-term Assets | $0 | $0 | $0 |
| Dividends | $0 | $0 | $0 |
| Subtotal Cash Spent | $357,252 | $373,002 | $388,172 |
| Net Cash Flow | $28,310 | $19,395 | $40,144 |
| Cash Balance | $30,909 | $50,304 | $90,448 |
8.5 Projected Balance Sheet
With the payment of our liabilities, relatively low payroll and operating expenses, and a conservative sales forecast, our Balance Sheet shows an increasing net worth in every month and year of our plan. As a consulting and design business, the majority of our “capital” is intangible – the skills, experience, and reputation of our team. However, the nature of our work also keeps our costs low, so careful debt management and billing will soon produce a good profit, and a valuable company.
| Pro Forma Balance Sheet | |||
| 2004 | 2005 | 2006 | |
| Assets | |||
| Current Assets | |||
| Cash | $30,909 | $50,304 | $90,448 |
| Accounts Receivable | $57,320 | $65,679 | $71,082 |
| Other Current Assets | $0 | $0 | $0 |
| Total Current Assets | $88,229 | $115,983 | $161,529 |
| Long-term Assets | |||
| Long-term Assets | $9,628 | $9,628 | $9,628 |
| Accumulated Depreciation | $5,957 | $6,569 | $7,181 |
| Total Long-term Assets | $3,671 | $3,059 | $2,447 |
| Total Assets | $91,900 | $119,042 | $163,976 |
| Liabilities and Capital | 2004 | 2005 | 2006 |
| Current Liabilities | |||
| Accounts Payable | $7,722 | $8,298 | $8,861 |
| Current Borrowing | $42,283 | $28,958 | $15,633 |
| Other Current Liabilities | $0 | $0 | $0 |
| Subtotal Current Liabilities | $50,005 | $37,256 | $24,494 |
| Long-term Liabilities | $0 | $0 | $0 |
| Total Liabilities | $50,005 | $37,256 | $24,494 |
| Paid-in Capital | $0 | $0 | $0 |
| Retained Earnings | $36,737 | $41,895 | $81,786 |
| Earnings | $5,158 | $39,891 | $57,697 |
| Total Capital | $41,895 | $81,786 | $139,483 |
| Total Liabilities and Capital | $91,900 | $119,042 | $163,976 |
| Net Worth | $41,895 | $81,786 | $139,483 |
8.6 Business Ratios
Business ratios for the years of this plan are shown below. Industry profile ratios based on the Standard Industrial Classification (SIC) code 8712.01, Architectural Engineering, are shown for comparison.
Our business ratios look different from the industry standards in part because we are counting our only direct cost of sales, our engineering labor, as an operating expense. The company is structured so that employees receive a monthly salary regardless of hours billed, so our expenses are all, essentially, operating expenses.
| Ratio Analysis | ||||
| 2004 | 2005 | 2006 | Industry Profile | |
| Sales Growth | 54.82% | 14.58% | 8.22% | 6.40% |
| Percent of Total Assets | ||||
| Accounts Receivable | 62.37% | 55.17% | 43.35% | 33.49% |
| Other Current Assets | 0.00% | 0.00% | 0.00% | 37.48% |
| Total Current Assets | 96.01% | 97.43% | 98.51% | 75.03% |
| Long-term Assets | 3.99% | 2.57% | 1.49% | 24.97% |
| Total Assets | 100.00% | 100.00% | 100.00% | 100.00% |
| Current Liabilities | 54.41% | 31.30% | 14.94% | 34.27% |
| Long-term Liabilities | 0.00% | 0.00% | 0.00% | 13.64% |
| Total Liabilities | 54.41% | 31.30% | 14.94% | 47.91% |
| Net Worth | 45.59% | 68.70% | 85.06% | 52.09% |
| Percent of Sales | ||||
| Sales | 100.00% | 100.00% | 100.00% | 100.00% |
| Gross Margin | 100.00% | 100.00% | 100.00% | 100.00% |
| Selling, General & Administrative Expenses | 34.29% | 21.45% | 19.18% | 83.39% |
| Advertising Expenses | 0.00% | 0.00% | 0.00% | 0.24% |
| Profit Before Interest and Taxes | 2.75% | 14.75% | 19.31% | 2.49% |
| Main Ratios | ||||
| Current | 1.76 | 3.11 | 6.59 | 1.84 |
| Quick | 1.76 | 3.11 | 6.59 | 1.49 |
| Total Debt to Total Assets | 54.41% | 31.30% | 14.94% | 56.44% |
| Pre-tax Return on Net Worth | 17.59% | 69.68% | 59.09% | 6.92% |
| Pre-tax Return on Assets | 8.02% | 47.87% | 50.27% | 15.90% |
| Additional Ratios | 2004 | 2005 | 2006 | |
| Net Profit Margin | 1.47% | 9.95% | 13.30% | n.a |
| Return on Equity | 12.31% | 48.77% | 41.36% | n.a |
| Activity Ratios | ||||
| Accounts Receivable Turnover | 6.10 | 6.10 | 6.10 | n.a |
| Collection Days | 60 | 56 | 58 | n.a |
| Accounts Payable Turnover | 12.39 | 12.17 | 12.17 | n.a |
| Payment Days | 29 | 29 | 29 | n.a |
| Total Asset Turnover | 3.81 | 3.37 | 2.65 | n.a |
| Debt Ratios | ||||
| Debt to Net Worth | 1.19 | 0.46 | 0.18 | n.a |
| Current Liab. to Liab. | 1.00 | 1.00 | 1.00 | n.a |
| Liquidity Ratios | ||||
| Net Working Capital | $38,224 | $78,727 | $137,036 | n.a |
| Interest Coverage | 4.28 | 27.66 | 62.61 | n.a |
| Additional Ratios | ||||
| Assets to Sales | 0.26 | 0.30 | 0.38 | n.a |
| Current Debt/Total Assets | 54% | 31% | 15% | n.a |
| Acid Test | 0.62 | 1.35 | 3.69 | n.a |
| Sales/Net Worth | 8.35 | 4.90 | 3.11 | n.a |
| Dividend Payout | 0.00 | 0.00 | 0.00 | n.a |
Appendix
| Sales Forecast | |||||||||||||
| Jan | Feb | Mar | Apr | May | Jun | Jul | Aug | Sep | Oct | Nov | Dec | ||
| Sales | |||||||||||||
| Educational | 0% | $16,666 | $16,666 | $16,666 | $16,666 | $16,666 | $16,666 | $16,666 | $16,666 | $16,666 | $16,666 | $16,666 | $16,666 |
| Health Care / Senior Facilities | 0% | $6,250 | $6,250 | $6,250 | $6,250 | $6,250 | $6,250 | $6,250 | $6,250 | $6,250 | $6,250 | $6,250 | $6,250 |
| Commercial | 0% | $2,500 | $2,500 | $2,500 | $2,500 | $2,500 | $2,500 | $2,500 | $2,500 | $2,500 | $2,500 | $2,500 | $2,500 |
| Government | 0% | $2,500 | $2,500 | $2,500 | $2,500 | $2,500 | $2,500 | $2,500 | $2,500 | $2,500 | $2,500 | $2,500 | $2,500 |
| Program Management | 0% | $415 | $415 | $415 | $415 | $415 | $415 | $415 | $415 | $415 | $415 | $415 | $415 |
| Contractor / design Build | 0% | $415 | $415 | $415 | $415 | $415 | $415 | $415 | $415 | $415 | $415 | $415 | $415 |
| Consulting Income | 0% | $400 | $400 | $400 | $400 | $400 | $400 | $400 | $400 | $400 | $400 | $400 | $400 |
| Total Sales | $29,146 | $29,146 | $29,146 | $29,146 | $29,146 | $29,146 | $29,146 | $29,146 | $29,146 | $29,146 | $29,146 | $29,146 | |
| Direct Cost of Sales | Jan | Feb | Mar | Apr | May | Jun | Jul | Aug | Sep | Oct | Nov | Dec | |
| See Personnel Table | $0 | $0 | $0 | $0 | $0 | $0 | $0 | $0 | $0 | $0 | $0 | $0 | |
| Other | $0 | $0 | $0 | $0 | $0 | $0 | $0 | $0 | $0 | $0 | $0 | $0 | |
| Subtotal Direct Cost of Sales | $0 | $0 | $0 | $0 | $0 | $0 | $0 | $0 | $0 | $0 | $0 | $0 | |
| Personnel Plan | |||||||||||||
| Jan | Feb | Mar | Apr | May | Jun | Jul | Aug | Sep | Oct | Nov | Dec | ||
| John J. Solarczyk | 0% | $6,121 | $6,121 | $6,121 | $6,121 | $6,121 | $6,121 | $6,121 | $6,121 | $6,121 | $6,121 | $6,121 | $6,121 |
| Thomas C. Heasley | 0% | $6,558 | $6,558 | $6,558 | $6,558 | $6,558 | $6,558 | $6,558 | $6,558 | $6,558 | $6,558 | $6,558 | $6,558 |
| Eric C. Haugh | 0% | $6,121 | $6,121 | $6,121 | $6,121 | $6,121 | $6,121 | $6,121 | $6,121 | $6,121 | $6,121 | $6,121 | $6,121 |
| John M. Lavoie | 0% | $1,894 | $1,894 | $1,894 | $1,894 | $1,894 | $1,894 | $1,894 | $1,894 | $1,894 | $1,894 | $1,894 | $1,894 |
| Other | 0% | $0 | $0 | $0 | $0 | $0 | $0 | $0 | $0 | $0 | $0 | $0 | $0 |
| Total People | 4 | 4 | 4 | 4 | 4 | 4 | 4 | 4 | 4 | 4 | 4 | 4 | |
| Total Payroll | $20,694 | $20,694 | $20,694 | $20,694 | $20,694 | $20,694 | $20,694 | $20,694 | $20,694 | $20,694 | $20,694 | $20,694 | |
| General Assumptions | |||||||||||||
| Jan | Feb | Mar | Apr | May | Jun | Jul | Aug | Sep | Oct | Nov | Dec | ||
| Plan Month | 1 | 2 | 3 | 4 | 5 | 6 | 7 | 8 | 9 | 10 | 11 | 12 | |
| Current Interest Rate | 6.00% | 6.00% | 6.00% | 6.00% | 6.00% | 6.00% | 6.00% | 6.00% | 6.00% | 6.00% | 6.00% | 6.00% | |
| Long-term Interest Rate | 10.00% | 10.00% | 10.00% | 10.00% | 10.00% | 10.00% | 10.00% | 10.00% | 10.00% | 10.00% | 10.00% | 10.00% | |
| Tax Rate | 30.00% | 30.00% | 30.00% | 30.00% | 30.00% | 30.00% | 30.00% | 30.00% | 30.00% | 30.00% | 30.00% | 30.00% | |
| Other | 0 | 0 | 0 | 0 | 0 | 0 | 0 | 0 | 0 | 0 | 0 | 0 | |
| Pro Forma Profit and Loss | |||||||||||||
| Jan | Feb | Mar | Apr | May | Jun | Jul | Aug | Sep | Oct | Nov | Dec | ||
| Sales | $29,146 | $29,146 | $29,146 | $29,146 | $29,146 | $29,146 | $29,146 | $29,146 | $29,146 | $29,146 | $29,146 | $29,146 | |
| Direct Cost of Sales | $0 | $0 | $0 | $0 | $0 | $0 | $0 | $0 | $0 | $0 | $0 | $0 | |
| Hidden Row | $0 | $0 | $0 | $0 | $0 | $0 | $0 | $0 | $0 | $0 | $0 | $0 | |
| Total Cost of Sales | $0 | $0 | $0 | $0 | $0 | $0 | $0 | $0 | $0 | $0 | $0 | $0 | |
| Gross Margin | $29,146 | $29,146 | $29,146 | $29,146 | $29,146 | $29,146 | $29,146 | $29,146 | $29,146 | $29,146 | $29,146 | $29,146 | |
| Gross Margin % | 100.00% | 100.00% | 100.00% | 100.00% | 100.00% | 100.00% | 100.00% | 100.00% | 100.00% | 100.00% | 100.00% | 100.00% | |
| Expenses | |||||||||||||
| Payroll | $20,694 | $20,694 | $20,694 | $20,694 | $20,694 | $20,694 | $20,694 | $20,694 | $20,694 | $20,694 | $20,694 | $20,694 | |
| Sales and Marketing and Other Expenses | $600 | $600 | $600 | $600 | $600 | $600 | $600 | $600 | $600 | $600 | $600 | $600 | |
| Depreciation | 0% | $51 | $51 | $51 | $51 | $51 | $51 | $51 | $51 | $51 | $51 | $51 | $51 |
| Rent | 0% | $600 | $600 | $600 | $600 | $600 | $600 | $600 | $600 | $600 | $600 | $600 | $600 |
| Utilities | 0% | $1,130 | $1,130 | $1,130 | $1,130 | $1,130 | $1,130 | $1,130 | $1,130 | $1,130 | $1,130 | $1,130 | $1,130 |
| Insurance | 0% | $1,000 | $1,000 | $1,000 | $1,000 | $1,000 | $1,000 | $1,000 | $1,000 | $1,000 | $1,000 | $1,000 | $1,000 |
| Payroll Taxes | $800 | $800 | $800 | $800 | $800 | $800 | $800 | $800 | $800 | $800 | $800 | $800 | |
| 125 – Flexible Spending Account | 0% | $800 | $800 | $800 | $800 | $800 | $800 | $800 | $800 | $800 | $800 | $800 | $800 |
| Automobile Expense | 0% | $450 | $450 | $450 | $450 | $450 | $450 | $450 | $450 | $450 | $450 | $450 | $450 |
| Bank Service Charges | 0% | $50 | $50 | $50 | $50 | $50 | $50 | $50 | $50 | $50 | $50 | $50 | $50 |
| Charity / Contributions | 0% | $50 | $50 | $50 | $50 | $50 | $50 | $50 | $50 | $50 | $50 | $50 | $50 |
| Interest Expense | 0% | $150 | $150 | $150 | $150 | $150 | $150 | $150 | $150 | $150 | $150 | $150 | $150 |
| Licenses and Permits | 0% | $150 | $150 | $150 | $150 | $150 | $150 | $150 | $150 | $150 | $150 | $150 | $150 |
| Office Supplies | 0% | $500 | $500 | $500 | $500 | $500 | $500 | $500 | $500 | $500 | $500 | $500 | $500 |
| Payroll taxes & Expenses | 0% | $800 | $800 | $800 | $800 | $800 | $800 | $800 | $800 | $800 | $800 | $800 | $800 |
| Postage and Delivery | 0% | $70 | $70 | $70 | $70 | $70 | $70 | $70 | $70 | $70 | $70 | $70 | $70 |
| Printing and Reproduction | 0% | $200 | $200 | $200 | $200 | $200 | $200 | $200 | $200 | $200 | $200 | $200 | $200 |
| Professional Fees | 0% | $100 | $100 | $100 | $100 | $100 | $100 | $100 | $100 | $100 | $100 | $100 | $100 |
| Professional Improvement (CEUs) | 0% | $50 | $50 | $50 | $50 | $50 | $50 | $50 | $50 | $50 | $50 | $50 | $50 |
| Travel & Ent | 0% | $100 | $100 | $100 | $100 | $100 | $100 | $100 | $100 | $100 | $100 | $100 | $100 |
| Other | $0 | $0 | $0 | $0 | $0 | $0 | $0 | $0 | $0 | $0 | $0 | $0 | |
| Total Operating Expenses | $28,345 | $28,345 | $28,345 | $28,345 | $28,345 | $28,345 | $28,345 | $28,345 | $28,345 | $28,345 | $28,345 | $28,345 | |
| Profit Before Interest and Taxes | $801 | $801 | $801 | $801 | $801 | $801 | $801 | $801 | $801 | $801 | $801 | $801 | |
| EBITDA | $852 | $852 | $852 | $852 | $852 | $852 | $852 | $852 | $852 | $852 | $852 | $852 | |
| Interest Expense | $162 | $167 | $171 | $176 | $180 | $185 | $189 | $194 | $198 | $203 | $207 | $211 | |
| Taxes Incurred | $192 | $190 | $189 | $188 | $186 | $185 | $184 | $182 | $181 | $180 | $178 | $177 | |
| Net Profit | $447 | $444 | $441 | $438 | $435 | $431 | $428 | $425 | $422 | $419 | $416 | $413 | |
| Net Profit/Sales | 1.53% | 1.52% | 1.51% | 1.50% | 1.49% | 1.48% | 1.47% | 1.46% | 1.45% | 1.44% | 1.43% | 1.42% | |
| Pro Forma Cash Flow | |||||||||||||
| Jan | Feb | Mar | Apr | May | Jun | Jul | Aug | Sep | Oct | Nov | Dec | ||
| Cash Received | |||||||||||||
| Cash from Operations | |||||||||||||
| Cash Sales | $0 | $0 | $0 | $0 | $0 | $0 | $0 | $0 | $0 | $0 | $0 | $0 | |
| Cash from Receivables | $33,565 | $34,537 | $29,146 | $29,146 | $29,146 | $29,146 | $29,146 | $29,146 | $29,146 | $29,146 | $29,146 | $29,146 | |
| Subtotal Cash from Operations | $33,565 | $34,537 | $29,146 | $29,146 | $29,146 | $29,146 | $29,146 | $29,146 | $29,146 | $29,146 | $29,146 | $29,146 | |
| Additional Cash Received | |||||||||||||
| Sales Tax, VAT, HST/GST Received | 0.00% | $0 | $0 | $0 | $0 | $0 | $0 | $0 | $0 | $0 | $0 | $0 | $0 |
| New Current Borrowing | $4,000 | $2,000 | $2,000 | $2,000 | $2,000 | $2,000 | $2,000 | $2,000 | $2,000 | $2,000 | $2,000 | $2,000 | |
| New Other Liabilities (interest-free) | $0 | $0 | $0 | $0 | $0 | $0 | $0 | $0 | $0 | $0 | $0 | $0 | |
| New Long-term Liabilities | $0 | $0 | $0 | $0 | $0 | $0 | $0 | $0 | $0 | $0 | $0 | $0 | |
| Sales of Other Current Assets | $0 | $0 | $0 | $0 | $0 | $0 | $0 | $0 | $0 | $0 | $0 | $0 | |
| Sales of Long-term Assets | $0 | $0 | $0 | $0 | $0 | $0 | $0 | $0 | $0 | $0 | $0 | $0 | |
| New Investment Received | $0 | $0 | $0 | $0 | $0 | $0 | $0 | $0 | $0 | $0 | $0 | $0 | |
| Subtotal Cash Received | $37,565 | $36,537 | $31,146 | $31,146 | $31,146 | $31,146 | $31,146 | $31,146 | $31,146 | $31,146 | $31,146 | $31,146 | |
| Expenditures | Jan | Feb | Mar | Apr | May | Jun | Jul | Aug | Sep | Oct | Nov | Dec | |
| Expenditures from Operations | |||||||||||||
| Cash Spending | $20,694 | $20,694 | $20,694 | $20,694 | $20,694 | $20,694 | $20,694 | $20,694 | $20,694 | $20,694 | $20,694 | $20,694 | |
| Bill Payments | $7,931 | $7,954 | $7,957 | $7,960 | $7,963 | $7,967 | $7,970 | $7,973 | $7,976 | $7,979 | $7,982 | $7,985 | |
| Subtotal Spent on Operations | $28,625 | $28,648 | $28,651 | $28,654 | $28,657 | $28,661 | $28,664 | $28,667 | $28,670 | $28,673 | $28,676 | $28,679 | |
| Additional Cash Spent | |||||||||||||
| Sales Tax, VAT, HST/GST Paid Out | $0 | $0 | $0 | $0 | $0 | $0 | $0 | $0 | $0 | $0 | $0 | $0 | |
| Principal Repayment of Current Borrowing | $1,111 | $1,111 | $1,111 | $1,111 | $1,111 | $1,111 | $1,111 | $1,111 | $1,111 | $1,111 | $1,111 | $1,111 | |
| Other Liabilities Principal Repayment | $0 | $0 | $0 | $0 | $0 | $0 | $0 | $0 | $0 | $0 | $0 | $0 | |
| Long-term Liabilities Principal Repayment | $0 | $0 | $0 | $0 | $0 | $0 | $0 | $0 | $0 | $0 | $0 | $0 | |
| Purchase Other Current Assets | $0 | $0 | $0 | $0 | $0 | $0 | $0 | $0 | $0 | $0 | $0 | $0 | |
| Purchase Long-term Assets | $0 | $0 | $0 | $0 | $0 | $0 | $0 | $0 | $0 | $0 | $0 | $0 | |
| Dividends | $0 | $0 | $0 | $0 | $0 | $0 | $0 | $0 | $0 | $0 | $0 | $0 | |
| Subtotal Cash Spent | $29,736 | $29,759 | $29,762 | $29,765 | $29,768 | $29,771 | $29,774 | $29,777 | $29,780 | $29,784 | $29,787 | $29,790 | |
| Net Cash Flow | $7,829 | $6,778 | $1,384 | $1,381 | $1,378 | $1,375 | $1,372 | $1,369 | $1,366 | $1,362 | $1,359 | $1,356 | |
| Cash Balance | $10,428 | $17,206 | $18,590 | $19,972 | $21,350 | $22,725 | $24,096 | $25,465 | $26,831 | $28,193 | $29,552 | $30,909 | |
| Pro Forma Balance Sheet | |||||||||||||
| Jan | Feb | Mar | Apr | May | Jun | Jul | Aug | Sep | Oct | Nov | Dec | ||
| Assets | Starting Balances | ||||||||||||
| Current Assets | |||||||||||||
| Cash | $2,599 | $10,428 | $17,206 | $18,590 | $19,972 | $21,350 | $22,725 | $24,096 | $25,465 | $26,831 | $28,193 | $29,552 | $30,909 |
| Accounts Receivable | $67,130 | $62,711 | $57,320 | $57,320 | $57,320 | $57,320 | $57,320 | $57,320 | $57,320 | $57,320 | $57,320 | $57,320 | $57,320 |
| Other Current Assets | $0 | $0 | $0 | $0 | $0 | $0 | $0 | $0 | $0 | $0 | $0 | $0 | $0 |
| Total Current Assets | $69,729 | $73,139 | $74,527 | $75,911 | $77,292 | $78,670 | $80,045 | $81,417 | $82,785 | $84,151 | $85,513 | $86,873 | $88,229 |
| Long-term Assets | |||||||||||||
| Long-term Assets | $9,628 | $9,628 | $9,628 | $9,628 | $9,628 | $9,628 | $9,628 | $9,628 | $9,628 | $9,628 | $9,628 | $9,628 | $9,628 |
| Accumulated Depreciation | $5,345 | $5,396 | $5,447 | $5,498 | $5,549 | $5,600 | $5,651 | $5,702 | $5,753 | $5,804 | $5,855 | $5,906 | $5,957 |
| Total Long-term Assets | $4,283 | $4,232 | $4,181 | $4,130 | $4,079 | $4,028 | $3,977 | $3,926 | $3,875 | $3,824 | $3,773 | $3,722 | $3,671 |
| Total Assets | $74,012 | $77,371 | $78,708 | $80,041 | $81,371 | $82,698 | $84,022 | $85,343 | $86,660 | $87,975 | $89,286 | $90,595 | $91,900 |
| Liabilities and Capital | Jan | Feb | Mar | Apr | May | Jun | Jul | Aug | Sep | Oct | Nov | Dec | |
| Current Liabilities | |||||||||||||
| Accounts Payable | $7,666 | $7,689 | $7,692 | $7,695 | $7,698 | $7,701 | $7,704 | $7,707 | $7,710 | $7,713 | $7,716 | $7,719 | $7,722 |
| Current Borrowing | $29,609 | $32,499 | $33,388 | $34,278 | $35,167 | $36,057 | $36,946 | $37,836 | $38,725 | $39,615 | $40,504 | $41,394 | $42,283 |
| Other Current Liabilities | $0 | $0 | $0 | $0 | $0 | $0 | $0 | $0 | $0 | $0 | $0 | $0 | $0 |
| Subtotal Current Liabilities | $37,275 | $40,187 | $41,080 | $41,972 | $42,865 | $43,757 | $44,650 | $45,542 | $46,435 | $47,327 | $48,220 | $49,113 | $50,005 |
| Long-term Liabilities | $0 | $0 | $0 | $0 | $0 | $0 | $0 | $0 | $0 | $0 | $0 | $0 | $0 |
| Total Liabilities | $37,275 | $40,187 | $41,080 | $41,972 | $42,865 | $43,757 | $44,650 | $45,542 | $46,435 | $47,327 | $48,220 | $49,113 | $50,005 |
| Paid-in Capital | $0 | $0 | $0 | $0 | $0 | $0 | $0 | $0 | $0 | $0 | $0 | $0 | $0 |
| Retained Earnings | $55,858 | $36,737 | $36,737 | $36,737 | $36,737 | $36,737 | $36,737 | $36,737 | $36,737 | $36,737 | $36,737 | $36,737 | $36,737 |
| Earnings | ($19,121) | $447 | $891 | $1,332 | $1,769 | $2,204 | $2,635 | $3,063 | $3,488 | $3,911 | $4,329 | $4,745 | $5,158 |
| Total Capital | $36,737 | $37,184 | $37,628 | $38,069 | $38,506 | $38,941 | $39,372 | $39,800 | $40,225 | $40,648 | $41,066 | $41,482 | $41,895 |
| Total Liabilities and Capital | $74,012 | $77,371 | $78,708 | $80,041 | $81,371 | $82,698 | $84,022 | $85,343 | $86,660 | $87,975 | $89,286 | $90,595 | $91,900 |
| Net Worth | $36,737 | $37,184 | $37,628 | $38,069 | $38,506 | $38,941 | $39,372 | $39,800 | $40,225 | $40,648 | $41,066 | $41,482 | $41,895 |


