
Doggie Pause
Executive Summary
Doggie Pause is a canine daycare facility catering to professionals who have disposable income and the desire to provide quality care for their pets while they are work. It is a response to a real market need in a high-end high-income market.
1.1 Objectives
- To launch the business and develop sales approaching $25K per month by the end of the first year.
- To break even in the second year, and be profitable by the third year.
- To increase sales by 20% per year in the second and third year while also becoming profitable.
1.2 Mission
We will be the leaders in the market of canine care for the upscale community by providing a positive environment for the animals that we house. Our operations will instill in owners confidence in our ability to care for their pets in appropriate ways. We will control significant market share and increase profit as we grow and expand. We will develop our business conservatively, financing our growth through operational revenue.
1.3 Keys to Success
- The initial location will be in an upscale community on the outskirts of the metropolitan area.
- We will cater to the needs of our canine owners as much as possible.
- We will uphold the statement ‘the customer is always right’ because when it comes to canines, owners know best.
- The business finances will be run in an organized and timely manner.
Company Summary
Doggie Pause will be established as a Subchapter S corporation owned in equal shares by two founders, Barque Oldeyeller and Rufe Rintintin. We are working with the local legal firm Akita, Shar-Pei, Pug & Kesshond, to establish the legal entity.
2.1 Start-up Summary
The start up for Doggie Pause will be simple and cost efficient. Rent and utilities will be the main expense, which will consist of a large building space and office. There will be many advertising expenses in the beginning that will promote the service, and this expense will lessen as months go on and people become aware of our service. Start-up inventory will be mainly shampoo and grooming supplies, food for the dogs, and other supplies like bedding. Assets will be the kennels and play structures for the dogs, and the bathing facilities.
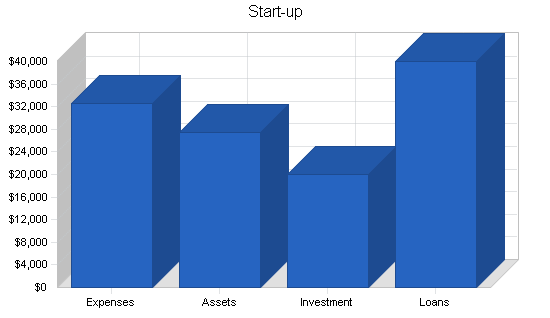
Loans will be needed to start up the company, and we will also be investing some of our own funds. At this point we’re planning to invest $10,000 each as founders, and to take a small business loan of $42K. The loan will be paid off over three years as shown in the cash flow.
| Start-up Funding | |
| Start-up Expenses to Fund | $32,500 |
| Start-up Assets to Fund | $27,500 |
| Total Funding Required | $60,000 |
| Assets | |
| Non-cash Assets from Start-up | $10,140 |
| Cash Requirements from Start-up | $20,000 |
| Additional Cash Raised | $0 |
| Cash Balance on Starting Date | $20,000 |
| Total Assets | $30,140 |
| Liabilities and Capital | |
| Liabilities | |
| Current Borrowing | $40,000 |
| Long-term Liabilities | $0 |
| Accounts Payable (Outstanding Bills) | $0 |
| Other Current Liabilities (interest-free) | $0 |
| Total Liabilities | $40,000 |
| Capital | |
| Planned Investment | |
| Barque Oldeyeller | $10,000 |
| Rufe Rintintin | $10,000 |
| Other | $0 |
| Additional Investment Requirement | $0 |
| Total Planned Investment | $20,000 |
| Loss at Start-up (Start-up Expenses) | ($32,500) |
| Total Capital | ($12,500) |
| Total Capital and Liabilities | $27,500 |
| Total Funding | $60,000 |
| Start-up | |
| Requirements | |
| Start-up Expenses | |
| Legal | $1,500 |
| Brochures | $1,500 |
| Insurance | $5,000 |
| Rent | $2,500 |
| Expensed equipment | $20,000 |
| Other | $2,000 |
| Total Start-up Expenses | $32,500 |
| Start-up Assets | |
| Cash Required | $20,000 |
| Other Current Assets | $0 |
| Long-term Assets | $7,500 |
| Total Assets | $27,500 |
| Total Requirements | $60,000 |
Services
Doggie Pause offers upscale dog owners a place where they can leave their pets while at work, and away for weekend trips or on vacation. It also offers feeding and exercising, as well as washing, grooming and low-level veterinary services. The location will be a large lot on the outskirts of a high-income residential area. Our projections include a heavy rent because of the location requirements. Customers pay by the day, by the hour, or by the month. Our assumption is that the average customer generates about $250 per month.
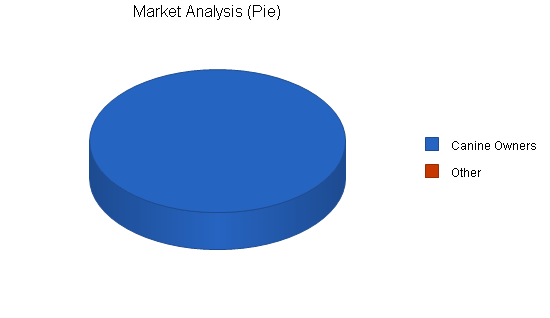
Market Analysis Summary
The market for Doggie Pause is all of the dog owners in the metropolitan area and surrounding areas of the city. We believe that this is going to be 2/3 of the population, and we have a goal of gaining a 50% market share. We have a target of a 20% yearly profit increase as the business continues.
4.1 Target Market Segment Strategy
We have chosen our target market because they own canines and have the ability to afford a service such as Doggie Pause. We are aware that our service is an extra in life, not a necessity. We anticipate and expect to cater to the upper-class citizens within our geographical area.
4.2 Service Business Analysis
Our familiarity with this business indicates that the service we offer is not currently available anywhere within the metropolitan area. We think our marketing problem will be more a matter of making dog owners aware of the Doggie Pause, than it will be related to the competition.
4.3 Market Segmentation
Our target market consists of canine owners that have the financial capabilities to care for their dogs in an elaborate manner. Most will be from double income homes with high profile jobs that require an extensive amount of time away from the home. Our target market consists of men and women primarily between the ages of 35 and 65. They live in the upscale suburbs surrounding the metropolitan area. Our market segment customers will lead a lifestyle in which their canines play a large part, and these pets are often seen as “children” by their owners.
| Market Analysis | |||||||
| Year 1 | Year 2 | Year 3 | Year 4 | Year 5 | |||
| Potential Customers | Growth | CAGR | |||||
| Canine Owners | 20% | 15,000 | 18,000 | 21,600 | 25,920 | 31,104 | 20.00% |
| Other | 0% | 0 | 0 | 0 | 0 | 0 | 0.00% |
| Total | 20.00% | 15,000 | 18,000 | 21,600 | 25,920 | 31,104 | 20.00% |
4.4 Competition and Buying Patterns
Our real competition is owners choosing to leave their dogs at home unattended. We recognize that only relatively wealthy people will be interested in spending an average of $250 monthly to provide daycare for their dogs. Still, there should be sufficient market.
Strategy and Implementation Summary
Doggie Pause will focus on the geographical market of upper-class suburbs surrounding the metropolitan area. Our initial site will be in West Linn, a suburb of Portland. Our target market consists mainly of men and women ages 35-65.
5.1 Competitive Edge
Doggie Pause is the first canine daycare facility of its kind. Never before has there been a place where a canine owner could take their dog to be cared for, for the day. The owner feels no guilt in leaving the dog because it is a secure, safe and fun environment.
5.2 Sales Forecast
Sales are based on an hourly fee for each dog. There will be a $15.00/hour charge for the “day care.” This includes the care of the dogs, and grooming services. Forecasted sales are based on the estimated number of dogs that will be cared for daily, and an average of how many hours each dog will be housed per day. There is an assumption that we will initially be offering services Monday through Friday, 7 AM to 6 PM, with time for owners to drop off and pick up their pets before and after work. Sales will increase as months go on, due to an increase in number of dogs per day that we are caring for.

Services will expand to include weekends and long-term “vacation” boarding as the need and demand arises.

| Sales Forecast | |||
| Year 1 | Year 2 | Year 3 | |
| Sales | |||
| Doggie care hours (all inclusive) | $135,479 | $163,000 | $196,000 |
| Other | $14,250 | $17,000 | $20,000 |
| Total Sales | $149,729 | $180,000 | $216,000 |
| Direct Cost of Sales | Year 1 | Year 2 | Year 3 |
| Doggie care hours (all inclusive) | $13,548 | $16,300 | $19,600 |
| Other | $4,988 | $5,950 | $7,000 |
| Subtotal Direct Cost of Sales | $18,535 | $22,250 | $26,600 |
Management Summary
The management team will consist of the two co-founders, Barque Oldeyeller and Rufe Rintintin. We do not anticipate taking on other managers until locations are opened in other metropolitan areas. As we grow we expect to need outside guidance in the areas of accounting and financial advising.
| Personnel Plan | |||
| Year 1 | Year 2 | Year 3 | |
| Dog care assistants/groomers | $56,000 | $76,800 | $76,800 |
| Admin/etc. | $8,800 | $15,000 | $25,000 |
| Total People | 6 | 6 | 7 |
| Total Payroll | $64,800 | $91,800 | $101,800 |
Financial Plan
We want to finance the start-up of our company mainly through personal investment and a short-term business loan. We think this is a good risk/return situation and we will provide the necessary personal guarantees to secure the business loan. We will finance growth through the collection of the fees for our services. We understand that without these payments we will not be able to be a profitable business.
7.1 Important Assumptions
Our important financial assumptions are shown below.
| General Assumptions | |||
| Year 1 | Year 2 | Year 3 | |
| Plan Month | 1 | 2 | 3 |
| Current Interest Rate | 10.00% | 10.00% | 10.00% |
| Long-term Interest Rate | 10.00% | 10.00% | 10.00% |
| Tax Rate | 25.42% | 25.00% | 25.42% |
| Other | 0 | 0 | 0 |
7.2 Break-even Analysis
According to our break-even projections, we need more than $12,000 in monthly sales to break even. We think this is a manageable sales amount. Furthermore, a significant portion of our fixed cost is our own salaries, so that reduces risk as well.

| Break-even Analysis | |
| Monthly Revenue Break-even | $12,197 |
| Assumptions: | |
| Average Percent Variable Cost | 12% |
| Estimated Monthly Fixed Cost | $10,687 |
7.3 Projected Profit and Loss
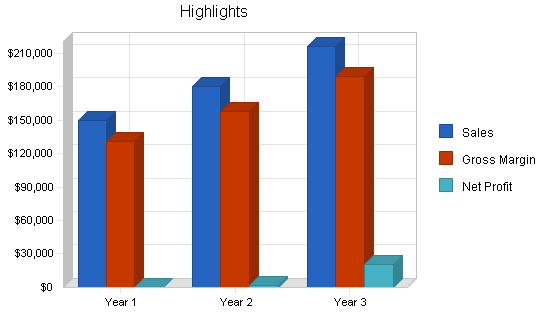
The projections show how we intend to almost break even in the first year (a loss of less than $1,000), make a small profit in the second year and show profit of 9% on sales in the third year. We are confident that even though we have a loss in the first months after opening, we will be profitable in the future as years go on and business increases.
| Pro Forma Profit and Loss | |||
| Year 1 | Year 2 | Year 3 | |
| Sales | $149,729 | $180,000 | $216,000 |
| Direct Cost of Sales | $18,535 | $22,250 | $26,600 |
| Other | $0 | $0 | $0 |
| Total Cost of Sales | $18,535 | $22,250 | $26,600 |
| Gross Margin | $131,194 | $157,750 | $189,400 |
| Gross Margin % | 87.62% | 87.64% | 87.69% |
| Expenses | |||
| Payroll | $64,800 | $91,800 | $101,800 |
| Sales and Marketing and Other Expenses | $15,000 | $9,000 | $6,000 |
| Depreciation | $0 | $0 | $0 |
| Leased Equipment | $0 | $0 | $0 |
| Utilities | $2,725 | $3,000 | $3,000 |
| Insurance | $6,000 | $6,000 | $6,000 |
| Rent | $30,000 | $30,000 | $30,000 |
| Payroll Taxes | $9,720 | $13,770 | $15,270 |
| Other | $0 | $0 | $0 |
| Total Operating Expenses | $128,245 | $153,570 | $162,070 |
| Profit Before Interest and Taxes | $2,949 | $4,180 | $27,330 |
| EBITDA | $2,949 | $4,180 | $27,330 |
| Interest Expense | $3,324 | $2,032 | $666 |
| Taxes Incurred | $0 | $537 | $6,777 |
| Net Profit | ($375) | $1,611 | $19,887 |
| Net Profit/Sales | -0.25% | 0.89% | 9.21% |
7.4 Projected Cash Flow
For Doggie Pause to be successful we need a steady growth in clientele. Without customers bringing in their canines we have no cash flow, no profit, and no business. The cash flow depends on a bridge loan in mid-year from the founders, to be repaid at the end of the year.

| Pro Forma Cash Flow | |||
| Year 1 | Year 2 | Year 3 | |
| Cash Received | |||
| Cash from Operations | |||
| Cash Sales | $149,729 | $180,000 | $216,000 |
| Subtotal Cash from Operations | $149,729 | $180,000 | $216,000 |
| Additional Cash Received | |||
| Sales Tax, VAT, HST/GST Received | $0 | $0 | $0 |
| New Current Borrowing | $0 | $0 | $0 |
| New Other Liabilities (interest-free) | $10,000 | $0 | $0 |
| New Long-term Liabilities | $0 | $0 | $0 |
| Sales of Other Current Assets | $0 | $0 | $0 |
| Sales of Long-term Assets | $0 | $0 | $0 |
| New Investment Received | $0 | $0 | $0 |
| Subtotal Cash Received | $159,729 | $180,000 | $216,000 |
| Expenditures | Year 1 | Year 2 | Year 3 |
| Expenditures from Operations | |||
| Cash Spending | $64,800 | $91,800 | $101,800 |
| Bill Payments | $77,005 | $87,772 | $93,678 |
| Subtotal Spent on Operations | $141,805 | $179,572 | $195,478 |
| Additional Cash Spent | |||
| Sales Tax, VAT, HST/GST Paid Out | $0 | $0 | $0 |
| Principal Repayment of Current Borrowing | $12,673 | $14,004 | $13,322 |
| Other Liabilities Principal Repayment | $10,000 | $0 | $0 |
| Long-term Liabilities Principal Repayment | $0 | $0 | $0 |
| Purchase Other Current Assets | $0 | $0 | $0 |
| Purchase Long-term Assets | $0 | $0 | $0 |
| Dividends | $0 | $0 | $0 |
| Subtotal Cash Spent | $164,478 | $193,576 | $208,800 |
| Net Cash Flow | ($4,749) | ($13,576) | $7,200 |
| Cash Balance | $15,251 | $1,675 | $8,874 |
7.5 Projected Balance Sheet
The projected balance sheet shows stability and a gradual increase of net worth.
| Pro Forma Balance Sheet | |||
| Year 1 | Year 2 | Year 3 | |
| Assets | |||
| Current Assets | |||
| Cash | $15,251 | $1,675 | $8,874 |
| Other Current Assets | $0 | $0 | $0 |
| Total Current Assets | $15,251 | $1,675 | $8,874 |
| Long-term Assets | |||
| Long-term Assets | $7,500 | $7,500 | $7,500 |
| Accumulated Depreciation | $0 | $0 | $0 |
| Total Long-term Assets | $7,500 | $7,500 | $7,500 |
| Total Assets | $22,751 | $9,175 | $16,374 |
| Liabilities and Capital | Year 1 | Year 2 | Year 3 |
| Current Liabilities | |||
| Accounts Payable | $8,299 | $7,117 | $7,752 |
| Current Borrowing | $27,327 | $13,322 | $0 |
| Other Current Liabilities | $0 | $0 | $0 |
| Subtotal Current Liabilities | $35,626 | $20,439 | $7,752 |
| Long-term Liabilities | $0 | $0 | $0 |
| Total Liabilities | $35,626 | $20,439 | $7,752 |
| Paid-in Capital | $20,000 | $20,000 | $20,000 |
| Retained Earnings | ($32,500) | ($32,875) | ($31,265) |
| Earnings | ($375) | $1,611 | $19,887 |
| Total Capital | ($12,875) | ($11,265) | $8,622 |
| Total Liabilities and Capital | $22,751 | $9,175 | $16,374 |
| Net Worth | ($12,875) | ($11,265) | $8,622 |
7.6 Business Ratios
| Ratio Analysis | ||||
| Year 1 | Year 2 | Year 3 | Industry Profile | |
| Sales Growth | 0.00% | 20.22% | 20.00% | -2.90% |
| Percent of Total Assets | ||||
| Other Current Assets | 0.00% | 0.00% | 0.00% | 31.90% |
| Total Current Assets | 67.03% | 18.25% | 54.20% | 55.90% |
| Long-term Assets | 32.97% | 81.75% | 45.80% | 44.10% |
| Total Assets | 100.00% | 100.00% | 100.00% | 100.00% |
| Current Liabilities | 156.59% | 222.78% | 47.34% | 32.70% |
| Long-term Liabilities | 0.00% | 0.00% | 0.00% | 19.90% |
| Total Liabilities | 156.59% | 222.78% | 47.34% | 52.60% |
| Net Worth | -56.59% | -122.78% | 52.66% | 47.40% |
| Percent of Sales | ||||
| Sales | 100.00% | 100.00% | 100.00% | 100.00% |
| Gross Margin | 87.62% | 87.64% | 87.69% | 42.50% |
| Selling, General & Administrative Expenses | 88.01% | 86.83% | 78.47% | 26.40% |
| Advertising Expenses | 10.02% | 5.00% | 2.78% | 0.50% |
| Profit Before Interest and Taxes | 1.97% | 2.32% | 12.65% | 2.40% |
| Main Ratios | ||||
| Current | 0.43 | 0.08 | 1.14 | 2.19 |
| Quick | 0.43 | 0.08 | 1.14 | 1.48 |
| Total Debt to Total Assets | 156.59% | 222.78% | 47.34% | 52.60% |
| Pre-tax Return on Net Worth | 2.92% | -19.06% | 309.25% | 4.50% |
| Pre-tax Return on Assets | -1.65% | 23.41% | 162.84% | 9.40% |
| Additional Ratios | Year 1 | Year 2 | Year 3 | |
| Net Profit Margin | -0.25% | 0.89% | 9.21% | n.a |
| Return on Equity | 0.00% | 0.00% | 230.65% | n.a |
| Activity Ratios | ||||
| Accounts Payable Turnover | 10.28 | 12.17 | 12.17 | n.a |
| Payment Days | 27 | 32 | 29 | n.a |
| Total Asset Turnover | 6.58 | 19.62 | 13.19 | n.a |
| Debt Ratios | ||||
| Debt to Net Worth | 0.00 | 0.00 | 0.90 | n.a |
| Current Liab. to Liab. | 1.00 | 1.00 | 1.00 | n.a |
| Liquidity Ratios | ||||
| Net Working Capital | ($20,375) | ($18,765) | $1,122 | n.a |
| Interest Coverage | 0.89 | 2.06 | 41.03 | n.a |
| Additional Ratios | ||||
| Assets to Sales | 0.15 | 0.05 | 0.08 | n.a |
| Current Debt/Total Assets | 157% | 223% | 47% | n.a |
| Acid Test | 0.43 | 0.08 | 1.14 | n.a |
| Sales/Net Worth | 0.00 | 0.00 | 25.05 | n.a |
| Dividend Payout | 0.00 | 0.00 | 0.00 | n.a |
Appendix
| Sales Forecast | |||||||||||||
| Month 1 | Month 2 | Month 3 | Month 4 | Month 5 | Month 6 | Month 7 | Month 8 | Month 9 | Month 10 | Month 11 | Month 12 | ||
| Sales | |||||||||||||
| Doggie care hours (all inclusive) | 20% | $5,125 | $5,395 | $6,835 | $12,595 | $9,265 | $7,825 | $8,095 | $8,635 | $11,245 | $15,714 | $20,395 | $24,355 |
| Other | 20% | $765 | $585 | $705 | $1,215 | $585 | $705 | $1,215 | $1,095 | $1,305 | $1,785 | $2,055 | $2,235 |
| Total Sales | $5,890 | $5,980 | $7,540 | $13,810 | $9,850 | $8,530 | $9,310 | $9,730 | $12,550 | $17,499 | $22,450 | $26,590 | |
| Direct Cost of Sales | Month 1 | Month 2 | Month 3 | Month 4 | Month 5 | Month 6 | Month 7 | Month 8 | Month 9 | Month 10 | Month 11 | Month 12 | |
| Doggie care hours (all inclusive) | 10% | $513 | $540 | $684 | $1,260 | $927 | $783 | $810 | $864 | $1,125 | $1,571 | $2,040 | $2,436 |
| Other | 35% | $268 | $205 | $247 | $425 | $205 | $247 | $425 | $383 | $457 | $625 | $719 | $782 |
| Subtotal Direct Cost of Sales | $780 | $744 | $930 | $1,685 | $1,131 | $1,029 | $1,235 | $1,247 | $1,581 | $2,196 | $2,759 | $3,218 | |
| Personnel Plan | |||||||||||||
| Month 1 | Month 2 | Month 3 | Month 4 | Month 5 | Month 6 | Month 7 | Month 8 | Month 9 | Month 10 | Month 11 | Month 12 | ||
| Dog care assistants/groomers | 0% | $3,200 | $3,200 | $3,200 | $4,800 | $4,800 | $4,800 | $4,800 | $4,800 | $4,800 | $4,800 | $6,400 | $6,400 |
| Admin/etc. | 0% | $500 | $500 | $500 | $500 | $500 | $500 | $500 | $500 | $1,200 | $1,200 | $1,200 | $1,200 |
| Total People | 3 | 3 | 3 | 4 | 4 | 4 | 4 | 4 | 5 | 5 | 6 | 6 | |
| Total Payroll | $3,700 | $3,700 | $3,700 | $5,300 | $5,300 | $5,300 | $5,300 | $5,300 | $6,000 | $6,000 | $7,600 | $7,600 | |
| General Assumptions | |||||||||||||
| Month 1 | Month 2 | Month 3 | Month 4 | Month 5 | Month 6 | Month 7 | Month 8 | Month 9 | Month 10 | Month 11 | Month 12 | ||
| Plan Month | 1 | 2 | 3 | 4 | 5 | 6 | 7 | 8 | 9 | 10 | 11 | 12 | |
| Current Interest Rate | 10.00% | 10.00% | 10.00% | 10.00% | 10.00% | 10.00% | 10.00% | 10.00% | 10.00% | 10.00% | 10.00% | 10.00% | |
| Long-term Interest Rate | 10.00% | 10.00% | 10.00% | 10.00% | 10.00% | 10.00% | 10.00% | 10.00% | 10.00% | 10.00% | 10.00% | 10.00% | |
| Tax Rate | 30.00% | 25.00% | 25.00% | 25.00% | 25.00% | 25.00% | 25.00% | 25.00% | 25.00% | 25.00% | 25.00% | 25.00% | |
| Other | 0 | 0 | 0 | 0 | 0 | 0 | 0 | 0 | 0 | 0 | 0 | 0 | |
| Pro Forma Profit and Loss | |||||||||||||
| Month 1 | Month 2 | Month 3 | Month 4 | Month 5 | Month 6 | Month 7 | Month 8 | Month 9 | Month 10 | Month 11 | Month 12 | ||
| Sales | $5,890 | $5,980 | $7,540 | $13,810 | $9,850 | $8,530 | $9,310 | $9,730 | $12,550 | $17,499 | $22,450 | $26,590 | |
| Direct Cost of Sales | $780 | $744 | $930 | $1,685 | $1,131 | $1,029 | $1,235 | $1,247 | $1,581 | $2,196 | $2,759 | $3,218 | |
| Other | $0 | $0 | $0 | $0 | $0 | $0 | $0 | $0 | $0 | $0 | $0 | $0 | |
| Total Cost of Sales | $780 | $744 | $930 | $1,685 | $1,131 | $1,029 | $1,235 | $1,247 | $1,581 | $2,196 | $2,759 | $3,218 | |
| Gross Margin | $5,110 | $5,236 | $6,610 | $12,125 | $8,719 | $7,501 | $8,075 | $8,483 | $10,969 | $15,303 | $19,691 | $23,372 | |
| Gross Margin % | 86.75% | 87.55% | 87.66% | 87.80% | 88.52% | 87.93% | 86.74% | 87.19% | 87.40% | 87.45% | 87.71% | 87.90% | |
| Expenses | |||||||||||||
| Payroll | $3,700 | $3,700 | $3,700 | $5,300 | $5,300 | $5,300 | $5,300 | $5,300 | $6,000 | $6,000 | $7,600 | $7,600 | |
| Sales and Marketing and Other Expenses | $3,000 | $2,000 | $2,000 | $1,000 | $1,000 | $1,000 | $1,000 | $1,000 | $750 | $750 | $750 | $750 | |
| Depreciation | $0 | $0 | $0 | $0 | $0 | $0 | $0 | $0 | $0 | $0 | $0 | $0 | |
| Leased Equipment | $0 | $0 | $0 | $0 | $0 | $0 | $0 | $0 | $0 | $0 | $0 | $0 | |
| Utilities | $200 | $200 | $200 | $225 | $225 | $225 | $225 | $225 | $250 | $250 | $250 | $250 | |
| Insurance | $500 | $500 | $500 | $500 | $500 | $500 | $500 | $500 | $500 | $500 | $500 | $500 | |
| Rent | $2,500 | $2,500 | $2,500 | $2,500 | $2,500 | $2,500 | $2,500 | $2,500 | $2,500 | $2,500 | $2,500 | $2,500 | |
| Payroll Taxes | 15% | $555 | $555 | $555 | $795 | $795 | $795 | $795 | $795 | $900 | $900 | $1,140 | $1,140 |
| Other | $0 | $0 | $0 | $0 | $0 | $0 | $0 | $0 | $0 | $0 | $0 | $0 | |
| Total Operating Expenses | $10,455 | $9,455 | $9,455 | $10,320 | $10,320 | $10,320 | $10,320 | $10,320 | $10,900 | $10,900 | $12,740 | $12,740 | |
| Profit Before Interest and Taxes | ($5,345) | ($4,219) | ($2,845) | $1,805 | ($1,601) | ($2,819) | ($2,245) | ($1,837) | $69 | $4,403 | $6,951 | $10,632 | |
| EBITDA | ($5,345) | ($4,219) | ($2,845) | $1,805 | ($1,601) | ($2,819) | ($2,245) | ($1,837) | $69 | $4,403 | $6,951 | $10,632 | |
| Interest Expense | $325 | $316 | $308 | $299 | $291 | $282 | $273 | $264 | $255 | $246 | $237 | $228 | |
| Taxes Incurred | $0 | $0 | $0 | $0 | $0 | $0 | $0 | $0 | $0 | $0 | $0 | $0 | |
| Net Profit | ($5,670) | ($4,536) | ($3,153) | $1,506 | ($1,892) | ($3,101) | ($2,518) | ($2,101) | ($186) | $4,157 | $6,714 | $10,405 | |
| Net Profit/Sales | -96.27% | -75.85% | -41.82% | 10.90% | -19.21% | -36.36% | -27.04% | -21.59% | -1.49% | 23.75% | 29.91% | 39.13% | |
| Pro Forma Cash Flow | |||||||||||||
| Month 1 | Month 2 | Month 3 | Month 4 | Month 5 | Month 6 | Month 7 | Month 8 | Month 9 | Month 10 | Month 11 | Month 12 | ||
| Cash Received | |||||||||||||
| Cash from Operations | |||||||||||||
| Cash Sales | $5,890 | $5,980 | $7,540 | $13,810 | $9,850 | $8,530 | $9,310 | $9,730 | $12,550 | $17,499 | $22,450 | $26,590 | |
| Subtotal Cash from Operations | $5,890 | $5,980 | $7,540 | $13,810 | $9,850 | $8,530 | $9,310 | $9,730 | $12,550 | $17,499 | $22,450 | $26,590 | |
| Additional Cash Received | |||||||||||||
| Sales Tax, VAT, HST/GST Received | 0.00% | $0 | $0 | $0 | $0 | $0 | $0 | $0 | $0 | $0 | $0 | $0 | $0 |
| New Current Borrowing | $0 | $0 | $0 | $0 | $0 | $0 | $0 | $0 | $0 | $0 | $0 | $0 | |
| New Other Liabilities (interest-free) | $0 | $0 | $0 | $0 | $0 | $0 | $10,000 | $0 | $0 | $0 | $0 | $0 | |
| New Long-term Liabilities | $0 | $0 | $0 | $0 | $0 | $0 | $0 | $0 | $0 | $0 | $0 | $0 | |
| Sales of Other Current Assets | $0 | $0 | $0 | $0 | $0 | $0 | $0 | $0 | $0 | $0 | $0 | $0 | |
| Sales of Long-term Assets | $0 | $0 | $0 | $0 | $0 | $0 | $0 | $0 | $0 | $0 | $0 | $0 | |
| New Investment Received | $0 | $0 | $0 | $0 | $0 | $0 | $0 | $0 | $0 | $0 | $0 | $0 | |
| Subtotal Cash Received | $5,890 | $5,980 | $7,540 | $13,810 | $9,850 | $8,530 | $19,310 | $9,730 | $12,550 | $17,499 | $22,450 | $26,590 | |
| Expenditures | Month 1 | Month 2 | Month 3 | Month 4 | Month 5 | Month 6 | Month 7 | Month 8 | Month 9 | Month 10 | Month 11 | Month 12 | |
| Expenditures from Operations | |||||||||||||
| Cash Spending | $3,700 | $3,700 | $3,700 | $5,300 | $5,300 | $5,300 | $5,300 | $5,300 | $6,000 | $6,000 | $7,600 | $7,600 | |
| Bill Payments | $262 | $7,825 | $6,822 | $6,994 | $6,985 | $6,438 | $6,338 | $6,528 | $6,538 | $6,757 | $7,369 | $8,151 | |
| Subtotal Spent on Operations | $3,962 | $11,525 | $10,522 | $12,294 | $12,285 | $11,738 | $11,638 | $11,828 | $12,538 | $12,757 | $14,969 | $15,751 | |
| Additional Cash Spent | |||||||||||||
| Sales Tax, VAT, HST/GST Paid Out | $0 | $0 | $0 | $0 | $0 | $0 | $0 | $0 | $0 | $0 | $0 | $0 | |
| Principal Repayment of Current Borrowing | $1,009 | $1,017 | $1,025 | $1,034 | $1,043 | $1,051 | $1,060 | $1,069 | $1,078 | $1,087 | $1,096 | $1,105 | |
| Other Liabilities Principal Repayment | $0 | $0 | $0 | $0 | $0 | $0 | $0 | $0 | $0 | $0 | $0 | $10,000 | |
| Long-term Liabilities Principal Repayment | $0 | $0 | $0 | $0 | $0 | $0 | $0 | $0 | $0 | $0 | $0 | $0 | |
| Purchase Other Current Assets | $0 | $0 | $0 | $0 | $0 | $0 | $0 | $0 | $0 | $0 | $0 | $0 | |
| Purchase Long-term Assets | $0 | $0 | $0 | $0 | $0 | $0 | $0 | $0 | $0 | $0 | $0 | $0 | |
| Dividends | $0 | $0 | $0 | $0 | $0 | $0 | $0 | $0 | $0 | $0 | $0 | $0 | |
| Subtotal Cash Spent | $4,971 | $12,542 | $11,547 | $13,328 | $13,328 | $12,789 | $12,698 | $12,897 | $13,616 | $13,843 | $16,065 | $26,856 | |
| Net Cash Flow | $919 | ($6,562) | ($4,007) | $482 | ($3,478) | ($4,259) | $6,612 | ($3,167) | ($1,066) | $3,656 | $6,385 | ($266) | |
| Cash Balance | $20,919 | $14,357 | $10,350 | $10,832 | $7,355 | $3,095 | $9,707 | $6,541 | $5,475 | $9,131 | $15,516 | $15,251 | |
| Pro Forma Balance Sheet | |||||||||||||
| Month 1 | Month 2 | Month 3 | Month 4 | Month 5 | Month 6 | Month 7 | Month 8 | Month 9 | Month 10 | Month 11 | Month 12 | ||
| Assets | Starting Balances | ||||||||||||
| Current Assets | |||||||||||||
| Cash | $20,000 | $20,919 | $14,357 | $10,350 | $10,832 | $7,355 | $3,095 | $9,707 | $6,541 | $5,475 | $9,131 | $15,516 | $15,251 |
| Other Current Assets | $0 | $0 | $0 | $0 | $0 | $0 | $0 | $0 | $0 | $0 | $0 | $0 | $0 |
| Total Current Assets | $20,000 | $20,919 | $14,357 | $10,350 | $10,832 | $7,355 | $3,095 | $9,707 | $6,541 | $5,475 | $9,131 | $15,516 | $15,251 |
| Long-term Assets | |||||||||||||
| Long-term Assets | $7,500 | $7,500 | $7,500 | $7,500 | $7,500 | $7,500 | $7,500 | $7,500 | $7,500 | $7,500 | $7,500 | $7,500 | $7,500 |
| Accumulated Depreciation | $0 | $0 | $0 | $0 | $0 | $0 | $0 | $0 | $0 | $0 | $0 | $0 | $0 |
| Total Long-term Assets | $7,500 | $7,500 | $7,500 | $7,500 | $7,500 | $7,500 | $7,500 | $7,500 | $7,500 | $7,500 | $7,500 | $7,500 | $7,500 |
| Total Assets | $27,500 | $28,419 | $21,857 | $17,850 | $18,332 | $14,855 | $10,595 | $17,207 | $14,041 | $12,975 | $16,631 | $23,016 | $22,751 |
| Liabilities and Capital | Month 1 | Month 2 | Month 3 | Month 4 | Month 5 | Month 6 | Month 7 | Month 8 | Month 9 | Month 10 | Month 11 | Month 12 | |
| Current Liabilities | |||||||||||||
| Accounts Payable | $0 | $7,598 | $6,589 | $6,760 | $6,771 | $6,227 | $6,120 | $6,310 | $6,313 | $6,512 | $7,097 | $7,864 | $8,299 |
| Current Borrowing | $40,000 | $38,991 | $37,974 | $36,949 | $35,915 | $34,872 | $33,821 | $32,761 | $31,692 | $30,614 | $29,528 | $28,432 | $27,327 |
| Other Current Liabilities | $0 | $0 | $0 | $0 | $0 | $0 | $0 | $10,000 | $10,000 | $10,000 | $10,000 | $10,000 | $0 |
| Subtotal Current Liabilities | $40,000 | $46,590 | $44,563 | $43,709 | $42,686 | $41,100 | $39,941 | $49,071 | $48,005 | $47,126 | $46,625 | $46,296 | $35,626 |
| Long-term Liabilities | $0 | $0 | $0 | $0 | $0 | $0 | $0 | $0 | $0 | $0 | $0 | $0 | $0 |
| Total Liabilities | $40,000 | $46,590 | $44,563 | $43,709 | $42,686 | $41,100 | $39,941 | $49,071 | $48,005 | $47,126 | $46,625 | $46,296 | $35,626 |
| Paid-in Capital | $20,000 | $20,000 | $20,000 | $20,000 | $20,000 | $20,000 | $20,000 | $20,000 | $20,000 | $20,000 | $20,000 | $20,000 | $20,000 |
| Retained Earnings | ($32,500) | ($32,500) | ($32,500) | ($32,500) | ($32,500) | ($32,500) | ($32,500) | ($32,500) | ($32,500) | ($32,500) | ($32,500) | ($32,500) | ($32,500) |
| Earnings | $0 | ($5,670) | ($10,206) | ($13,359) | ($11,853) | ($13,745) | ($16,846) | ($19,364) | ($21,465) | ($21,651) | ($17,494) | ($10,780) | ($375) |
| Total Capital | ($12,500) | ($18,170) | ($22,706) | ($25,859) | ($24,353) | ($26,245) | ($29,346) | ($31,864) | ($33,965) | ($34,151) | ($29,994) | ($23,280) | ($12,875) |
| Total Liabilities and Capital | $27,500 | $28,419 | $21,857 | $17,850 | $18,332 | $14,855 | $10,595 | $17,207 | $14,041 | $12,975 | $16,631 | $23,016 | $22,751 |
| Net Worth | ($12,500) | ($18,170) | ($22,706) | ($25,859) | ($24,353) | ($26,245) | ($29,346) | ($31,864) | ($33,965) | ($34,151) | ($29,994) | ($23,280) | ($12,875) |

