
Premier Airport Transportation Service
Executive Summary
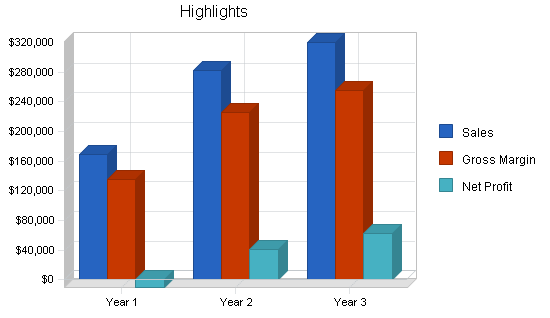
Premier Airport Transportation Service (PATS) is a Cleveland-based airport transportation service. PATS provides limousine like service without the typical high limousine price. Although PATS’ cars are not true stretch limousines, they are late model high-end luxury vehicles. Premier Airport Transportation is lead by Sam Brougham, a transportation industry veteran. PATS has forecasted healthy sales by year three.
The Market and Services Offered
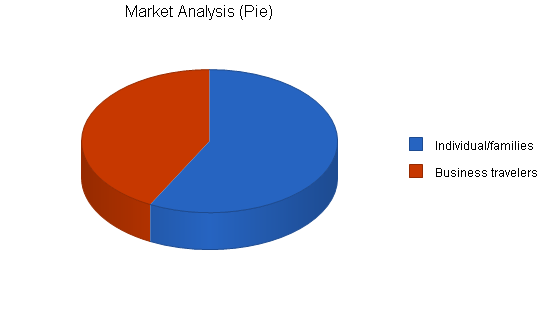
Cleveland currently has four limousine service providers and four taxi services. In addition to these transportation options, Cleveland also has short and long-term airport parking and a rapid transit public train system providing airport service. Premier Airport Transportation Service will span the gap between the mediocre taxi service and the high-priced limousine service. By having a middle price point, PATS will be especially attractive to both families and business travelers. The service will appeal to families as a reasonable and convenient alternative to them driving and parking at the airport. Business travelers who require a more deluxe solution relative to taxis but do not have such a debilitating effect on the company’s travel budget will embrace Premier Airport Transportation. These two market segments are growing on average at 8.5% per year and there are over a million potential customers.
The Competitive Edge
PATS recognizes that their key to success will be providing unmatched customer service. Premier has infused the importance of customer service into the drivers’ jobs by offering financial incentives to the drivers for superior service. This will ensure that the best customer service will be offered at every level and interaction with the company.
Management Team
Premier Airport Transportation Service was founded and is run by Sam Brougham. Sam began his transportation career as a taxi driver, a source of income to put Sam through school. After school, Sam worked at the Yellow Freight Company, initially in the logistics department. Sam then moved on to Yellow’s customer service department, ultimately having managerial responsibility over Yellow’s customer care call center. Sam’s logistics and customer service experience will be essential to the success of PATS. The logistics experience will provide Premier with hyper-efficient operations and the customer service experience will support their competitive edge.
Premier Airport Transportation will fulfill Cleveland’s unmet need for a reasonably priced, high service level airport transportation service. PATS will achieve break-even status by month eight and will double sales of year one by year three. While PATS will incur a loss for year one, they will generate a tidy net profit for year three.
1.1 Objectives
The objectives for the first three years of operation include:
- To create a service-based company whose primary goal is to exceed customer’s expectations.
- To increase customers by 20% per year through superior performance and word-of-mouth referrals.
- To develop a sustainable transportation company serving the Cleveland Metropolitan Area
1.2 Mission
The Mission of Premier Airport Transportation Service is to provide the customer the finest airport transportation service available. We exist to attract and maintain customers. When we adhere to this maxim, everything else will fall in to place. Our services will exceed the expectations of our customers.
Company Summary
Premier Airport Transportation Service, located in Bedford Hts, OH offers an airport transportation service for the greater Cleveland metropolitan area. PATS will offer their service 24 hours a day to most neighborhoods in Cleveland. PATS will be priced less than a limousine service but more than a group shuttle service.
Sam Brougham will be working full time as the dispatcher and back office person. Sam will have four employees.
2.1 Company Ownership
PATS is an Ohio corporation founded and owned by Sam Brougham.
2.2 Start-up Summary
PATS’ start-up costs will include all the equipment needed for the home-based office, legal fees, website creation, and start-up advertising.
The office equipment will be the largest chunk of the start-up expenses. This equipment includes a computer system, fax machine, office supplies. The computer should have at least a 500 megahertz Celeron/ Pentium processor, 64 megabytes of RAM (preferably 128), 6 gigabyte hard drive, and a rewritable CD- ROM for backing up the system. A DSL line will need to be set up as well. PATS will also need some Nextel phones. The advantage of the Nextel phones is it allows two way communication from the base to the cars over cellular frequencies but at a drastically reduced rate.
The office will need some furniture such as a desk, file cabinets. The legal fees are used for the formation of the business as well as for reviewing/generating standard client contracts.

| Start-up | |
| Requirements | |
| Start-up Expenses | |
| Legal | $1,000 |
| Stationery etc. | $125 |
| Brochures | $400 |
| Office equipment | $500 |
| Website creation | $500 |
| Other | $0 |
| Total Start-up Expenses | $2,525 |
| Start-up Assets | |
| Cash Required | $30,975 |
| Other Current Assets | $0 |
| Long-term Assets | $1,500 |
| Total Assets | $32,475 |
| Total Requirements | $35,000 |
| Start-up Funding | |
| Start-up Expenses to Fund | $2,525 |
| Start-up Assets to Fund | $32,475 |
| Total Funding Required | $35,000 |
| Assets | |
| Non-cash Assets from Start-up | $1,500 |
| Cash Requirements from Start-up | $30,975 |
| Additional Cash Raised | $0 |
| Cash Balance on Starting Date | $30,975 |
| Total Assets | $32,475 |
| Liabilities and Capital | |
| Liabilities | |
| Current Borrowing | $0 |
| Long-term Liabilities | $0 |
| Accounts Payable (Outstanding Bills) | $0 |
| Other Current Liabilities (interest-free) | $0 |
| Total Liabilities | $0 |
| Capital | |
| Planned Investment | |
| Investor 1 | $35,000 |
| Other | $0 |
| Additional Investment Requirement | $0 |
| Total Planned Investment | $35,000 |
| Loss at Start-up (Start-up Expenses) | ($2,525) |
| Total Capital | $32,475 |
| Total Capital and Liabilities | $32,475 |
| Total Funding | $35,000 |
Services
PATS provides an airport transportation solution for the Cleveland metropolitan area. PATS can provide airport travel on short notice if cars are available, but they generally work with a reservation system. A customer would call up in advance and provide PATS with flight information. PATS would schedule the pick up time and then call and send an email to confirm the pickup. For pick up at the airport, PATS would meet the customer outside of baggage claim after the customer has picked up their luggage and would drive them home.
Market Analysis Summary
PATS will be focusing on families as well as business travelers. Both groups will likely demand PATS services. The families will utilize our service because it is convenient and less expensive than if they drove themselves and paid for long-term parking of their car. Business travelers will use our service because it offers a limousine-like service (other than the fact that PATS does not use limousines) where the traveler has a ride waiting for them when their planes comes in, but the service is less expensive than normal limousine services. Since the service is fairly comparable to a louisine service, companies will encourage their workers to utilize PATS as a cost saving measure, particularly in this economic downturn. Currently there are four limousine services in Cleveland and four taxi-type service providers.
4.1 Market Segmentation
Our customers can be divided into two groups: families/individuals on pleasure trips, and business travelers.
The first group is taking a trip for pleasure and will either be an individual or a family. Their choices are to either drive and park in long term parking, take a taxi, or use a limousine service. This group does not typically mind paying a bit more for a solution that takes care of their transportation to and from the airport. Since they are are on vacation, they appreciate having a service that gets them to the airport in a seamless way so they do not have to worry about anything. All they have to do is make the reservation and show up at the arranged pickup point.

The second group is the business traveler. In the past a company would typically hire a limousine service to pick up their worker. The company would always pay for the service. With PATS as an alternative, there is a transportation service that functions like a limousine (you can preschedule pickup dates and be taken directly home or to the airport) but without the overly fancy car and the associated high price. As companies are always looking at ways to cut costs, PATS offers a very reasonable solution in terms of comfort and cost. The business traveler will not notice anything different with PATS versus a limo service other than the vehicle they are traveling won’t be a limo, but will still be a sufficiently large and comfortable car.
| Market Analysis | |||||||
| Year 1 | Year 2 | Year 3 | Year 4 | Year 5 | |||
| Potential Customers | Growth | CAGR | |||||
| Individual/families | 9% | 578,000 | 630,020 | 686,722 | 748,527 | 815,894 | 9.00% |
| Business travelers | 8% | 425,000 | 459,000 | 495,720 | 535,378 | 578,208 | 8.00% |
| Total | 8.58% | 1,003,000 | 1,089,020 | 1,182,442 | 1,283,905 | 1,394,102 | 8.58% |
4.2 Target Market Segment Strategy
PATS will be targeting these two groups because they consistently travel, and PATS solution makes traveling easy for them. While a slow economy has some effect on travel. In general Americans tend to travel more each year, this trend beginning in the early 1980s. These groups are particularly attractive to PATS because they will always need to get to the airport and they are willing to pay a bit extra for the luxury of having someone take them there instead of being required to get themselves there. Please note, however, PATS is only slightly more expensive for trips under four days; over four days it is more cost effective to use PATS. Compared to driving a personal vehicle and paying for long-term parking.
In regard to the business customers, it is generally accepted practice for the company to provide the transportation for their employees. For trips over four days, there is no question that PATS is more cost effective. Under four days PATS service is slightly more expensive than driving oneself and parking, however, companies are more than willing to pay a bit extra as their employee is giving up a decent amount of their free time to go on the trip for work and the business recognizes and appreciates this. Of course for the companies already willing to pay limousine prices, PATS will appear as a way of reducing travel costs with no appreciable loss in service quality.
4.3 Competition and Buying Patterns
Currently in Cleveland there are several competing airport transportation systems:
- Public transportation: RTA provides rapid transit service to the airport. While this is an inexpensive alternative there are several disadvantages. The service does not run all hours of the night. RTA also forces travelers to change trains downtown to pick up the airport line. The rapid transit also requires travelers to manage all of their luggage which can be quite chore from some that are not skilled in the art of packing or are traveling for a real long time.
- Taxi service: Taxis do provide service to and from the airport, however, travelers cannot book the trip in advance, forcing them to call right before they want to travel. The level of service is inconsistent from taxi service to taxi service as well as from occasion to occasion. Taxis can also be quite expensive if city dwellers are going out to the suburbs.
- Airport parking: Airport parking can be cost effective if it is for fewer than four days. Driving oneself has the advantage of not having to deal with anyone else, the flip side to this however is they must do everything for themselves. Lastly, there is always the risk of damage to their car when it is parked and all airport parking facilities have drivers sign a waiver absolving the lot from responsibility if anything happens to the car.
- Shuttle service: This option packs a few different people into a van and takes them to the airport. This is a less expensive option, however, it takes longer to make the commute due to the other customers that are traveling Additionally, travelers lose out on the personalized service relative to PATS or a limousine service.
The buying patterns of these services vary based on the length of the trip, who is paying for it, and if it is a last minute or planned in advance trip. The longer the trip, the more economical a transportation option is relative to airport parking. A large percentage of business travelers use an upscale airport transportation solution like PATS or a limousine service for their employees. People who are just scraping by to go on vacation are likely to choose the least costly option, public transportation. Lastly, if the trip is planned at the last minute, taxi service might be the only option however, PATS will offer last minute rides if cars are available.
Strategy and Implementation Summary
PATS’ marketing/sales strategy will be two pronged, one to address each of our two segmented targeted groups:
- Families/individuals: In addition to some advertising, we will be working with associations such as AAA and other community groups to try to build up a network of users. PATS believes that working with these groups will provide us with steady flow of customers. Additionally, since a lot of these groups have close knit among member referrals will be quite powerful when they are coming from a member who already has established a trust bond with other organizational members.
- Business travelers: PATS will be contacting the travel department of many of the different companies in Cleveland that have a lot of employees traveling and informing them about our service and offering them an introductory discount. This will be an important segment to win over as companies routinely have employees traveling throughout the year. Businesses are also valuable because once the initial contact is made, the relationship can be turned into a steady stream of business.
5.1 Competitive Edge
PATS’ competitive advantage will be based on an incentive system that rewards the driver economically when they achieve good service, develop repeat customers and act in a team fashion instead of competing against other company drivers. This incentive system will reward drivers when:
- The company receives positive feedback about the driver (a feedback system will be set up).
- The customer is turned into a repeat customer.
- The driver develops new customers.
- The driver acts in manners that are team based instead of for individual gain.
Through this complicated but purposeful system, PATS is incentivizing behavior that they believe will help the company succeed, while not rewarding behavior that is destructive to the company.
Additionally, PATS will be having the drivers lease the cars through PATS for several reasons:
- With PATS leasing the cars, they are able to get a volume discount for the leases. PATS will actually be passing on the costs to the drivers.
- Leasing through PATS encourages a long term employee as there are fees to break a lease and PATS includes provisions in the lease that do not allow drivers to use the cars for more than two months beyond termination of employment.
- By having the drivers lease the cars, they have an economic incentive to maintain the cars as they are financial responsible for damage beyond reasonable wear and tear.
5.2 Sales Strategy
As stated earlier, we will be going after both families/individuals as well as business travelers. PATS will have a different strategy for each group. For the individuals, PATS will use contacts through membership associations and clubs to build customers. Customers that are a part of an association tend to put more trust in a service provider when the service provider is aligned with the association. PATS will offer a discount for the association members to try to build up a following. Our selling spiel will be total convenience at a cost that is competitive with the price that they currently pay when they leave their car in the parking lot. Offering the ability to schedule in advance pick up from home and then pick up from airport should be a big selling point. People like convenience, and people are willing to pay for conveniences. One phone call to arrange all of your transport needs to the airport is quite a convenience.
Our strategy of wooing the business travelers will be a campaign to introduce PATS to the different travel departments of the larger companies in the area. The initial contact will be a letter/brochure describing our services along with a pricing guide. PATS will then follow that up with a phone call to try to receive a commitment from the company. By including the pricing information within the brochure, PATS believes that this will catch the eyes of the companies’ travel departments as they are acutely aware of the costs that they are paying now and PATS believes that they can convert the lead into a customer by offering essentially the same service of a limo company at a reduced rate.
5.2.1 Sales Forecast
The first month will be spent setting up the business. It is unlikely that everything will be ready to go so that we could begin to take fares. By month two the business office will be in order, brochures will have been sent out and PATS will have been working with associations to create visibility for the company. PATS will have two drivers and will be paying a base monthly wage on the assumption that PATS wants to have the drivers ready when fares come up but there is not likely to be enough fares to support the wages of the two drivers.
Month three will see an increase in fares and things will be getting busy. Business will continue to grow and by month five a third driver will be brought on board. It will not be until month 11 that a fourth and final driver will be brought on board.


| Sales Forecast | |||
| Year 1 | Year 2 | Year 3 | |
| Sales | |||
| Individuals/families | $94,061 | $145,885 | $169,874 |
| Business travelers | $74,763 | $136,874 | $149,874 |
| Total Sales | $168,824 | $282,759 | $319,748 |
| Direct Cost of Sales | Year 1 | Year 2 | Year 3 |
| Individuals/families | $18,812 | $29,177 | $33,975 |
| Business travelers | $14,953 | $27,375 | $29,975 |
| Subtotal Direct Cost of Sales | $33,765 | $56,552 | $63,950 |
5.3 Milestones
PATS will have several milestones to aim for:
- Business plan completion. This will be done as a road map for the organization. While we do not need a business plan to raise capital, it will be an indispensable tool for the ongoing performance and improvement of the company.
- Set up office.
- Profitability.
- Bringing on board the fourth driver.
| Milestones | |||||
| Milestone | Start Date | End Date | Budget | Manager | Department |
| Business plan completion | 1/1/2001 | 1/1/2001 | $0 | ABC | Sam |
| Set up office | 1/1/2001 | 1/1/2001 | $0 | ABC | Sam |
| Profitability | 1/1/2001 | 8/30/2001 | $0 | ABC | everyone |
| Fourth drive hired | 1/1/2001 | 11/1/2001 | $0 | ABC | everyone |
| Totals | $0 | ||||
Management Summary
Premier Airport Transportation Service is owned and operated by Sam Brougham. Sam will be incorporating in Ohio. Sam has a degree in business and mathematics from Case Western Reserve University. While at Case, Sam worked as a taxi driver to cover expenses for his education. Upon graduation, Sam went to work for Yellow Freight Company as a manager for the Logistics Department. In this position, Sam was responsible for devising systems that utilized Yellow’s truck fleet to its maximum capacity. After developing systems for the efficient use of the equipment, Sam applied and was accepted to transfer over to the customer service department. Same felt that he did not have sufficient “people” skills and was determined to develop these skills. For three years Sam worked in the department, eventually being promoted to leader of a call center group.
Once Sam had developed the skills that he deemed necessary to run his own business, he left Yellow and decided to open up his own transportation business. The logistic skills coupled with an outstanding ability to communicate with others provides Sam with the necessary foundation to run PATS.
6.1 Personnel Plan
The staff will consist of Sam working full time in the back office. Sam will be responsible for setting up the appointments as well as the marketing to develop customers. By month two, Sam will be bringing on board a part-time employee to help him out in answering the phones and setting up appointments for fares. Month two will also bring two drivers to PATS. The head count will remain the same until month five when a third driver will be brought on board. Lastly, month 11 will see a fourth driver brought on board.
| Personnel Plan | |||
| Year 1 | Year 2 | Year 3 | |
| Sam | $36,000 | $36,000 | $36,000 |
| Part-time employee | $16,500 | $16,500 | $16,500 |
| Driver | $20,600 | $21,600 | $21,600 |
| Driver | $20,600 | $21,600 | $21,600 |
| Driver | $14,400 | $21,600 | $21,600 |
| Driver | $3,600 | $21,600 | $21,600 |
| Total People | 6 | 6 | 6 |
| Total Payroll | $111,700 | $138,900 | $138,900 |
Financial Plan
The following sections will detail important financial information.
7.1 Important Assumptions
The following table highlights some of the important financial assumptions for PATS.
| General Assumptions | |||
| Year 1 | Year 2 | Year 3 | |
| Plan Month | 1 | 2 | 3 |
| Current Interest Rate | 10.00% | 10.00% | 10.00% |
| Long-term Interest Rate | 10.00% | 10.00% | 10.00% |
| Tax Rate | 25.42% | 25.00% | 25.42% |
| Other | 0 | 0 | 0 |
7.2 Break-even Analysis
The Break-even Analysis indicates what PATS must have in averaged monthly revenue to break even.

| Break-even Analysis | |
| Monthly Revenue Break-even | $15,131 |
| Assumptions: | |
| Average Percent Variable Cost | 20% |
| Estimated Monthly Fixed Cost | $12,105 |
7.3 Projected Profit and Loss
The following table presents the projected profit and loss.


| Pro Forma Profit and Loss | |||
| Year 1 | Year 2 | Year 3 | |
| Sales | $168,824 | $282,759 | $319,748 |
| Direct Cost of Sales | $33,765 | $56,552 | $63,950 |
| Other | $0 | $0 | $0 |
| Total Cost of Sales | $33,765 | $56,552 | $63,950 |
| Gross Margin | $135,059 | $226,207 | $255,798 |
| Gross Margin % | 80.00% | 80.00% | 80.00% |
| Expenses | |||
| Payroll | $111,700 | $138,900 | $138,900 |
| Sales and Marketing and Other Expenses | $3,100 | $3,600 | $3,600 |
| Depreciation | $504 | $498 | $498 |
| Web site maintenance | $600 | $600 | $600 |
| Utilities | $1,200 | $1,200 | $1,200 |
| Insurance | $5,400 | $5,400 | $5,400 |
| Rent | $6,000 | $0 | $0 |
| Payroll Taxes | $16,755 | $20,835 | $20,835 |
| Other | $0 | $0 | $0 |
| Total Operating Expenses | $145,259 | $171,033 | $171,033 |
| Profit Before Interest and Taxes | ($10,200) | $55,174 | $84,765 |
| EBITDA | ($9,696) | $55,672 | $85,263 |
| Interest Expense | $0 | $0 | $0 |
| Taxes Incurred | $0 | $13,794 | $21,545 |
| Net Profit | ($10,200) | $41,381 | $63,221 |
| Net Profit/Sales | -6.04% | 14.63% | 19.77% |
7.4 Projected Cash Flow
The following chart and table display the projected cash flow.

| Pro Forma Cash Flow | |||
| Year 1 | Year 2 | Year 3 | |
| Cash Received | |||
| Cash from Operations | |||
| Cash Sales | $168,824 | $282,759 | $319,748 |
| Subtotal Cash from Operations | $168,824 | $282,759 | $319,748 |
| Additional Cash Received | |||
| Sales Tax, VAT, HST/GST Received | $0 | $0 | $0 |
| New Current Borrowing | $0 | $0 | $0 |
| New Other Liabilities (interest-free) | $0 | $0 | $0 |
| New Long-term Liabilities | $0 | $0 | $0 |
| Sales of Other Current Assets | $0 | $0 | $0 |
| Sales of Long-term Assets | $0 | $0 | $0 |
| New Investment Received | $0 | $0 | $0 |
| Subtotal Cash Received | $168,824 | $282,759 | $319,748 |
| Expenditures | Year 1 | Year 2 | Year 3 |
| Expenditures from Operations | |||
| Cash Spending | $111,700 | $138,900 | $138,900 |
| Bill Payments | $57,893 | $102,525 | $115,884 |
| Subtotal Spent on Operations | $169,593 | $241,425 | $254,784 |
| Additional Cash Spent | |||
| Sales Tax, VAT, HST/GST Paid Out | $0 | $0 | $0 |
| Principal Repayment of Current Borrowing | $0 | $0 | $0 |
| Other Liabilities Principal Repayment | $0 | $0 | $0 |
| Long-term Liabilities Principal Repayment | $0 | $0 | $0 |
| Purchase Other Current Assets | $0 | $0 | $0 |
| Purchase Long-term Assets | $0 | $0 | $0 |
| Dividends | $0 | $0 | $0 |
| Subtotal Cash Spent | $169,593 | $241,425 | $254,784 |
| Net Cash Flow | ($769) | $41,334 | $64,964 |
| Cash Balance | $30,206 | $71,540 | $136,504 |
7.5 Projected Balance Sheet
The following table details the projected balance sheet.
| Pro Forma Balance Sheet | |||
| Year 1 | Year 2 | Year 3 | |
| Assets | |||
| Current Assets | |||
| Cash | $30,206 | $71,540 | $136,504 |
| Other Current Assets | $0 | $0 | $0 |
| Total Current Assets | $30,206 | $71,540 | $136,504 |
| Long-term Assets | |||
| Long-term Assets | $1,500 | $1,500 | $1,500 |
| Accumulated Depreciation | $504 | $1,002 | $1,500 |
| Total Long-term Assets | $996 | $498 | $0 |
| Total Assets | $31,202 | $72,038 | $136,504 |
| Liabilities and Capital | Year 1 | Year 2 | Year 3 |
| Current Liabilities | |||
| Accounts Payable | $8,927 | $8,382 | $9,627 |
| Current Borrowing | $0 | $0 | $0 |
| Other Current Liabilities | $0 | $0 | $0 |
| Subtotal Current Liabilities | $8,927 | $8,382 | $9,627 |
| Long-term Liabilities | $0 | $0 | $0 |
| Total Liabilities | $8,927 | $8,382 | $9,627 |
| Paid-in Capital | $35,000 | $35,000 | $35,000 |
| Retained Earnings | ($2,525) | ($12,725) | $28,656 |
| Earnings | ($10,200) | $41,381 | $63,221 |
| Total Capital | $22,275 | $63,656 | $126,877 |
| Total Liabilities and Capital | $31,202 | $72,038 | $136,504 |
| Net Worth | $22,275 | $63,656 | $126,877 |
7.6 Business Ratios
The business ratios table below is generated by the planning software using the interconnected tables. Standard industry ratios, based upon Standard Industrial Classification Code (SIC) 4111, Local and Suburban Transit, are shown for comparison.
| Ratio Analysis | ||||
| Year 1 | Year 2 | Year 3 | Industry Profile | |
| Sales Growth | 0.00% | 67.49% | 13.08% | 3.70% |
| Percent of Total Assets | ||||
| Other Current Assets | 0.00% | 0.00% | 0.00% | 45.30% |
| Total Current Assets | 96.81% | 99.31% | 100.00% | 64.40% |
| Long-term Assets | 3.19% | 0.69% | 0.00% | 35.60% |
| Total Assets | 100.00% | 100.00% | 100.00% | 100.00% |
| Current Liabilities | 28.61% | 11.64% | 7.05% | 31.20% |
| Long-term Liabilities | 0.00% | 0.00% | 0.00% | 25.20% |
| Total Liabilities | 28.61% | 11.64% | 7.05% | 56.40% |
| Net Worth | 71.39% | 88.36% | 92.95% | 43.60% |
| Percent of Sales | ||||
| Sales | 100.00% | 100.00% | 100.00% | 100.00% |
| Gross Margin | 80.00% | 80.00% | 80.00% | 66.70% |
| Selling, General & Administrative Expenses | 86.04% | 65.37% | 60.12% | 46.50% |
| Advertising Expenses | 0.36% | 0.21% | 0.19% | 0.50% |
| Profit Before Interest and Taxes | -6.04% | 19.51% | 26.51% | 2.90% |
| Main Ratios | ||||
| Current | 3.38 | 8.53 | 14.18 | 1.61 |
| Quick | 3.38 | 8.53 | 14.18 | 1.17 |
| Total Debt to Total Assets | 28.61% | 11.64% | 7.05% | 56.40% |
| Pre-tax Return on Net Worth | -45.79% | 86.68% | 66.81% | 4.60% |
| Pre-tax Return on Assets | -32.69% | 76.59% | 62.10% | 10.50% |
| Additional Ratios | Year 1 | Year 2 | Year 3 | |
| Net Profit Margin | -6.04% | 14.63% | 19.77% | n.a |
| Return on Equity | -45.79% | 65.01% | 49.83% | n.a |
| Activity Ratios | ||||
| Accounts Payable Turnover | 7.49 | 12.17 | 12.17 | n.a |
| Payment Days | 27 | 31 | 28 | n.a |
| Total Asset Turnover | 5.41 | 3.93 | 2.34 | n.a |
| Debt Ratios | ||||
| Debt to Net Worth | 0.40 | 0.13 | 0.08 | n.a |
| Current Liab. to Liab. | 1.00 | 1.00 | 1.00 | n.a |
| Liquidity Ratios | ||||
| Net Working Capital | $21,279 | $63,158 | $126,877 | n.a |
| Interest Coverage | 0.00 | 0.00 | 0.00 | n.a |
| Additional Ratios | ||||
| Assets to Sales | 0.18 | 0.25 | 0.43 | n.a |
| Current Debt/Total Assets | 29% | 12% | 7% | n.a |
| Acid Test | 3.38 | 8.53 | 14.18 | n.a |
| Sales/Net Worth | 7.58 | 4.44 | 2.52 | n.a |
| Dividend Payout | 0.00 | 0.00 | 0.00 | n.a |
Appendix
| Sales Forecast | |||||||||||||
| Month 1 | Month 2 | Month 3 | Month 4 | Month 5 | Month 6 | Month 7 | Month 8 | Month 9 | Month 10 | Month 11 | Month 12 | ||
| Sales | |||||||||||||
| Individuals/families | 0% | $0 | $1,578 | $1,874 | $3,958 | $6,645 | $7,345 | $8,287 | $9,258 | $9,985 | $12,455 | $14,822 | $17,854 |
| Business travelers | 0% | $0 | $1,114 | $1,358 | $3,225 | $4,754 | $5,514 | $6,958 | $8,125 | $9,125 | $10,458 | $11,587 | $12,545 |
| Total Sales | $0 | $2,692 | $3,232 | $7,183 | $11,399 | $12,859 | $15,245 | $17,383 | $19,110 | $22,913 | $26,409 | $30,399 | |
| Direct Cost of Sales | Month 1 | Month 2 | Month 3 | Month 4 | Month 5 | Month 6 | Month 7 | Month 8 | Month 9 | Month 10 | Month 11 | Month 12 | |
| Individuals/families | $0 | $316 | $375 | $792 | $1,329 | $1,469 | $1,657 | $1,852 | $1,997 | $2,491 | $2,964 | $3,571 | |
| Business travelers | $0 | $223 | $272 | $645 | $951 | $1,103 | $1,392 | $1,625 | $1,825 | $2,092 | $2,317 | $2,509 | |
| Subtotal Direct Cost of Sales | $0 | $538 | $646 | $1,437 | $2,280 | $2,572 | $3,049 | $3,477 | $3,822 | $4,583 | $5,282 | $6,080 | |
| Personnel Plan | |||||||||||||
| Month 1 | Month 2 | Month 3 | Month 4 | Month 5 | Month 6 | Month 7 | Month 8 | Month 9 | Month 10 | Month 11 | Month 12 | ||
| Sam | 0% | $3,000 | $3,000 | $3,000 | $3,000 | $3,000 | $3,000 | $3,000 | $3,000 | $3,000 | $3,000 | $3,000 | $3,000 |
| Part-time employee | 0% | $0 | $1,500 | $1,500 | $1,500 | $1,500 | $1,500 | $1,500 | $1,500 | $1,500 | $1,500 | $1,500 | $1,500 |
| Driver | 0% | $0 | $2,200 | $2,200 | $1,800 | $1,800 | $1,800 | $1,800 | $1,800 | $1,800 | $1,800 | $1,800 | $1,800 |
| Driver | 0% | $0 | $2,200 | $2,200 | $1,800 | $1,800 | $1,800 | $1,800 | $1,800 | $1,800 | $1,800 | $1,800 | $1,800 |
| Driver | 0% | $0 | $0 | $0 | $0 | $1,800 | $1,800 | $1,800 | $1,800 | $1,800 | $1,800 | $1,800 | $1,800 |
| Driver | 0% | $0 | $0 | $0 | $0 | $0 | $0 | $0 | $0 | $0 | $0 | $1,800 | $1,800 |
| Total People | 1 | 4 | 4 | 4 | 5 | 5 | 5 | 5 | 5 | 5 | 6 | 6 | |
| Total Payroll | $3,000 | $8,900 | $8,900 | $8,100 | $9,900 | $9,900 | $9,900 | $9,900 | $9,900 | $9,900 | $11,700 | $11,700 | |
| General Assumptions | |||||||||||||
| Month 1 | Month 2 | Month 3 | Month 4 | Month 5 | Month 6 | Month 7 | Month 8 | Month 9 | Month 10 | Month 11 | Month 12 | ||
| Plan Month | 1 | 2 | 3 | 4 | 5 | 6 | 7 | 8 | 9 | 10 | 11 | 12 | |
| Current Interest Rate | 10.00% | 10.00% | 10.00% | 10.00% | 10.00% | 10.00% | 10.00% | 10.00% | 10.00% | 10.00% | 10.00% | 10.00% | |
| Long-term Interest Rate | 10.00% | 10.00% | 10.00% | 10.00% | 10.00% | 10.00% | 10.00% | 10.00% | 10.00% | 10.00% | 10.00% | 10.00% | |
| Tax Rate | 30.00% | 25.00% | 25.00% | 25.00% | 25.00% | 25.00% | 25.00% | 25.00% | 25.00% | 25.00% | 25.00% | 25.00% | |
| Other | 0 | 0 | 0 | 0 | 0 | 0 | 0 | 0 | 0 | 0 | 0 | 0 | |
| Pro Forma Profit and Loss | |||||||||||||
| Month 1 | Month 2 | Month 3 | Month 4 | Month 5 | Month 6 | Month 7 | Month 8 | Month 9 | Month 10 | Month 11 | Month 12 | ||
| Sales | $0 | $2,692 | $3,232 | $7,183 | $11,399 | $12,859 | $15,245 | $17,383 | $19,110 | $22,913 | $26,409 | $30,399 | |
| Direct Cost of Sales | $0 | $538 | $646 | $1,437 | $2,280 | $2,572 | $3,049 | $3,477 | $3,822 | $4,583 | $5,282 | $6,080 | |
| Other | $0 | $0 | $0 | $0 | $0 | $0 | $0 | $0 | $0 | $0 | $0 | $0 | |
| Total Cost of Sales | $0 | $538 | $646 | $1,437 | $2,280 | $2,572 | $3,049 | $3,477 | $3,822 | $4,583 | $5,282 | $6,080 | |
| Gross Margin | $0 | $2,154 | $2,586 | $5,746 | $9,119 | $10,287 | $12,196 | $13,906 | $15,288 | $18,330 | $21,127 | $24,319 | |
| Gross Margin % | 0.00% | 80.00% | 80.00% | 80.00% | 80.00% | 80.00% | 80.00% | 80.00% | 80.00% | 80.00% | 80.00% | 80.00% | |
| Expenses | |||||||||||||
| Payroll | $3,000 | $8,900 | $8,900 | $8,100 | $9,900 | $9,900 | $9,900 | $9,900 | $9,900 | $9,900 | $11,700 | $11,700 | |
| Sales and Marketing and Other Expenses | $150 | $175 | $200 | $225 | $250 | $300 | $300 | $300 | $300 | $300 | $300 | $300 | |
| Depreciation | $42 | $42 | $42 | $42 | $42 | $42 | $42 | $42 | $42 | $42 | $42 | $42 | |
| Web site maintenance | $50 | $50 | $50 | $50 | $50 | $50 | $50 | $50 | $50 | $50 | $50 | $50 | |
| Utilities | $100 | $100 | $100 | $100 | $100 | $100 | $100 | $100 | $100 | $100 | $100 | $100 | |
| Insurance | $450 | $450 | $450 | $450 | $450 | $450 | $450 | $450 | $450 | $450 | $450 | $450 | |
| Rent | $500 | $500 | $500 | $500 | $500 | $500 | $500 | $500 | $500 | $500 | $500 | $500 | |
| Payroll Taxes | 15% | $450 | $1,335 | $1,335 | $1,215 | $1,485 | $1,485 | $1,485 | $1,485 | $1,485 | $1,485 | $1,755 | $1,755 |
| Other | $0 | $0 | $0 | $0 | $0 | $0 | $0 | $0 | $0 | $0 | $0 | $0 | |
| Total Operating Expenses | $4,742 | $11,552 | $11,577 | $10,682 | $12,777 | $12,827 | $12,827 | $12,827 | $12,827 | $12,827 | $14,897 | $14,897 | |
| Profit Before Interest and Taxes | ($4,742) | ($9,398) | ($8,991) | ($4,936) | ($3,658) | ($2,540) | ($631) | $1,079 | $2,461 | $5,503 | $6,230 | $9,422 | |
| EBITDA | ($4,700) | ($9,356) | ($8,949) | ($4,894) | ($3,616) | ($2,498) | ($589) | $1,121 | $2,503 | $5,545 | $6,272 | $9,464 | |
| Interest Expense | $0 | $0 | $0 | $0 | $0 | $0 | $0 | $0 | $0 | $0 | $0 | $0 | |
| Taxes Incurred | $0 | $0 | $0 | $0 | $0 | $0 | $0 | $0 | $0 | $0 | $0 | $0 | |
| Net Profit | ($4,742) | ($9,398) | ($8,991) | ($4,936) | ($3,658) | ($2,540) | ($631) | $1,079 | $2,461 | $5,503 | $6,230 | $9,422 | |
| Net Profit/Sales | 0.00% | -349.12% | -278.20% | -68.71% | -32.09% | -19.75% | -4.14% | 6.21% | 12.88% | 24.02% | 23.59% | 31.00% | |
| Pro Forma Cash Flow | |||||||||||||
| Month 1 | Month 2 | Month 3 | Month 4 | Month 5 | Month 6 | Month 7 | Month 8 | Month 9 | Month 10 | Month 11 | Month 12 | ||
| Cash Received | |||||||||||||
| Cash from Operations | |||||||||||||
| Cash Sales | $0 | $2,692 | $3,232 | $7,183 | $11,399 | $12,859 | $15,245 | $17,383 | $19,110 | $22,913 | $26,409 | $30,399 | |
| Subtotal Cash from Operations | $0 | $2,692 | $3,232 | $7,183 | $11,399 | $12,859 | $15,245 | $17,383 | $19,110 | $22,913 | $26,409 | $30,399 | |
| Additional Cash Received | |||||||||||||
| Sales Tax, VAT, HST/GST Received | 0.00% | $0 | $0 | $0 | $0 | $0 | $0 | $0 | $0 | $0 | $0 | $0 | $0 |
| New Current Borrowing | $0 | $0 | $0 | $0 | $0 | $0 | $0 | $0 | $0 | $0 | $0 | $0 | |
| New Other Liabilities (interest-free) | $0 | $0 | $0 | $0 | $0 | $0 | $0 | $0 | $0 | $0 | $0 | $0 | |
| New Long-term Liabilities | $0 | $0 | $0 | $0 | $0 | $0 | $0 | $0 | $0 | $0 | $0 | $0 | |
| Sales of Other Current Assets | $0 | $0 | $0 | $0 | $0 | $0 | $0 | $0 | $0 | $0 | $0 | $0 | |
| Sales of Long-term Assets | $0 | $0 | $0 | $0 | $0 | $0 | $0 | $0 | $0 | $0 | $0 | $0 | |
| New Investment Received | $0 | $0 | $0 | $0 | $0 | $0 | $0 | $0 | $0 | $0 | $0 | $0 | |
| Subtotal Cash Received | $0 | $2,692 | $3,232 | $7,183 | $11,399 | $12,859 | $15,245 | $17,383 | $19,110 | $22,913 | $26,409 | $30,399 | |
| Expenditures | Month 1 | Month 2 | Month 3 | Month 4 | Month 5 | Month 6 | Month 7 | Month 8 | Month 9 | Month 10 | Month 11 | Month 12 | |
| Expenditures from Operations | |||||||||||||
| Cash Spending | $3,000 | $8,900 | $8,900 | $8,100 | $9,900 | $9,900 | $9,900 | $9,900 | $9,900 | $9,900 | $11,700 | $11,700 | |
| Bill Payments | $57 | $1,748 | $3,153 | $3,305 | $4,015 | $5,126 | $5,473 | $5,948 | $6,373 | $6,732 | $7,500 | $8,463 | |
| Subtotal Spent on Operations | $3,057 | $10,648 | $12,053 | $11,405 | $13,915 | $15,026 | $15,373 | $15,848 | $16,273 | $16,632 | $19,200 | $20,163 | |
| Additional Cash Spent | |||||||||||||
| Sales Tax, VAT, HST/GST Paid Out | $0 | $0 | $0 | $0 | $0 | $0 | $0 | $0 | $0 | $0 | $0 | $0 | |
| Principal Repayment of Current Borrowing | $0 | $0 | $0 | $0 | $0 | $0 | $0 | $0 | $0 | $0 | $0 | $0 | |
| Other Liabilities Principal Repayment | $0 | $0 | $0 | $0 | $0 | $0 | $0 | $0 | $0 | $0 | $0 | $0 | |
| Long-term Liabilities Principal Repayment | $0 | $0 | $0 | $0 | $0 | $0 | $0 | $0 | $0 | $0 | $0 | $0 | |
| Purchase Other Current Assets | $0 | $0 | $0 | $0 | $0 | $0 | $0 | $0 | $0 | $0 | $0 | $0 | |
| Purchase Long-term Assets | $0 | $0 | $0 | $0 | $0 | $0 | $0 | $0 | $0 | $0 | $0 | $0 | |
| Dividends | $0 | $0 | $0 | $0 | $0 | $0 | $0 | $0 | $0 | $0 | $0 | $0 | |
| Subtotal Cash Spent | $3,057 | $10,648 | $12,053 | $11,405 | $13,915 | $15,026 | $15,373 | $15,848 | $16,273 | $16,632 | $19,200 | $20,163 | |
| Net Cash Flow | ($3,057) | ($7,956) | ($8,821) | ($4,222) | ($2,516) | ($2,167) | ($128) | $1,535 | $2,837 | $6,281 | $7,209 | $10,236 | |
| Cash Balance | $27,918 | $19,962 | $11,141 | $6,920 | $4,404 | $2,237 | $2,109 | $3,644 | $6,481 | $12,761 | $19,971 | $30,206 | |
| Pro Forma Balance Sheet | |||||||||||||
| Month 1 | Month 2 | Month 3 | Month 4 | Month 5 | Month 6 | Month 7 | Month 8 | Month 9 | Month 10 | Month 11 | Month 12 | ||
| Assets | Starting Balances | ||||||||||||
| Current Assets | |||||||||||||
| Cash | $30,975 | $27,918 | $19,962 | $11,141 | $6,920 | $4,404 | $2,237 | $2,109 | $3,644 | $6,481 | $12,761 | $19,971 | $30,206 |
| Other Current Assets | $0 | $0 | $0 | $0 | $0 | $0 | $0 | $0 | $0 | $0 | $0 | $0 | $0 |
| Total Current Assets | $30,975 | $27,918 | $19,962 | $11,141 | $6,920 | $4,404 | $2,237 | $2,109 | $3,644 | $6,481 | $12,761 | $19,971 | $30,206 |
| Long-term Assets | |||||||||||||
| Long-term Assets | $1,500 | $1,500 | $1,500 | $1,500 | $1,500 | $1,500 | $1,500 | $1,500 | $1,500 | $1,500 | $1,500 | $1,500 | $1,500 |
| Accumulated Depreciation | $0 | $42 | $84 | $126 | $168 | $210 | $252 | $294 | $336 | $378 | $420 | $462 | $504 |
| Total Long-term Assets | $1,500 | $1,458 | $1,416 | $1,374 | $1,332 | $1,290 | $1,248 | $1,206 | $1,164 | $1,122 | $1,080 | $1,038 | $996 |
| Total Assets | $32,475 | $29,376 | $21,378 | $12,515 | $8,252 | $5,694 | $3,485 | $3,315 | $4,808 | $7,603 | $13,841 | $21,009 | $31,202 |
| Liabilities and Capital | Month 1 | Month 2 | Month 3 | Month 4 | Month 5 | Month 6 | Month 7 | Month 8 | Month 9 | Month 10 | Month 11 | Month 12 | |
| Current Liabilities | |||||||||||||
| Accounts Payable | $0 | $1,643 | $3,043 | $3,172 | $3,844 | $4,944 | $5,275 | $5,736 | $6,150 | $6,483 | $7,219 | $8,156 | $8,927 |
| Current Borrowing | $0 | $0 | $0 | $0 | $0 | $0 | $0 | $0 | $0 | $0 | $0 | $0 | $0 |
| Other Current Liabilities | $0 | $0 | $0 | $0 | $0 | $0 | $0 | $0 | $0 | $0 | $0 | $0 | $0 |
| Subtotal Current Liabilities | $0 | $1,643 | $3,043 | $3,172 | $3,844 | $4,944 | $5,275 | $5,736 | $6,150 | $6,483 | $7,219 | $8,156 | $8,927 |
| Long-term Liabilities | $0 | $0 | $0 | $0 | $0 | $0 | $0 | $0 | $0 | $0 | $0 | $0 | $0 |
| Total Liabilities | $0 | $1,643 | $3,043 | $3,172 | $3,844 | $4,944 | $5,275 | $5,736 | $6,150 | $6,483 | $7,219 | $8,156 | $8,927 |
| Paid-in Capital | $35,000 | $35,000 | $35,000 | $35,000 | $35,000 | $35,000 | $35,000 | $35,000 | $35,000 | $35,000 | $35,000 | $35,000 | $35,000 |
| Retained Earnings | ($2,525) | ($2,525) | ($2,525) | ($2,525) | ($2,525) | ($2,525) | ($2,525) | ($2,525) | ($2,525) | ($2,525) | ($2,525) | ($2,525) | ($2,525) |
| Earnings | $0 | ($4,742) | ($14,140) | ($23,132) | ($28,067) | ($31,725) | ($34,265) | ($34,896) | ($33,817) | ($31,356) | ($25,852) | ($19,622) | ($10,200) |
| Total Capital | $32,475 | $27,733 | $18,335 | $9,343 | $4,408 | $750 | ($1,790) | ($2,421) | ($1,342) | $1,119 | $6,623 | $12,853 | $22,275 |
| Total Liabilities and Capital | $32,475 | $29,376 | $21,378 | $12,515 | $8,252 | $5,694 | $3,485 | $3,315 | $4,808 | $7,603 | $13,841 | $21,009 | $31,202 |
| Net Worth | $32,475 | $27,733 | $18,335 | $9,343 | $4,408 | $750 | ($1,790) | ($2,421) | ($1,342) | $1,119 | $6,623 | $12,853 | $22,275 |


