
Valley Airporter
Executive Summary
This year Valley Airporter plans to transport over 20,000 passengers. To accommodate those passengers, we plan to purchase three brand new 20-passenger buses to replace older 14-passenger buses.
The new buses are needed because of the expansion of airport service. The schedule has continually expanded over the years from three times a day, Monday through Friday only, to ten trips each weekday and nine trips on Saturday and Sunday, 365 days per year.
Valley Airporter operates out of Corvallis which is home to Oregon State University. Over 18,000 thousand students attend the university. In addition, there are over 120 high-tech businesses in Corvallis. Though there is a small airport in Corvallis and a regional airport in Eugene (50 miles south of Corvallis), most travelers prefer to use the Portland International Airport, which is 70 miles north of Corvallis.
Bob and Mary Wilson, co-owners of Valley Airporter, will invest in the purchase of the new vans. The owners will also secure a long-term commercial loan.
1.1 Mission
The mission of Valley Airporter has been to assure safety, convenience and comfort to every customer.
1.2 Keys to Success
-
- Valley Airporter’s chauffeurs are experienced, professional, commercially certified drivers.
-
- The office staff is professional, friendly and helpful going above the call of duty for customers.
- Valley Airporter is a caring company that continually donates time and services to community schools and other organizations.
Company Summary
Valley Airporter is a successful airport shuttle service that transports passengers between the Portland International Airport and Corvallis. Valley Airporter has office space in the Clairmont Inn, as well as long-term parking for customers.
2.1 Company Ownership
Bob and Mary Wilson are co-owners of Valley Airporter.
2.2 Company History
In April 1998, three 14-passenger vans were converted to 11-passenger vans with rear luggage area and Valley Airporter began. Valley Airporter plans to travel over 2,000 miles per day, transporting over 20,000 passengers.
To accommodate those passengers, we plan to purchase three brand new 20-passenger replacement buses. All buses are equipped with seat belts and high back reclinable seats for comfort and safety. The schedule has continually expanded over the years from three times a day weekdays only, to ten trips each weekday and nine trips on Saturday and Sunday, 365 days per year.

| Past Performance | |||
| 1999 | 2000 | 2001 | |
| Sales | $138,600 | $200,000 | $290,000 |
| Gross Margin | $30,000 | $40,000 | $60,000 |
| Gross Margin % | 21.65% | 20.00% | 20.69% |
| Operating Expenses | $75,000 | $90,000 | $120,000 |
| Balance Sheet | |||
| 1999 | 2000 | 2001 | |
| Current Assets | |||
| Cash | $20,000 | $30,000 | $50,000 |
| Other Current Assets | $0 | $0 | $0 |
| Total Current Assets | $20,000 | $30,000 | $50,000 |
| Long-term Assets | |||
| Long-term Assets | $60,000 | $60,000 | $130,000 |
| Accumulated Depreciation | $8,000 | $16,000 | $24,000 |
| Total Long-term Assets | $52,000 | $44,000 | $106,000 |
| Total Assets | $72,000 | $74,000 | $156,000 |
| Current Liabilities | |||
| Accounts Payable | $10,000 | $14,000 | $16,000 |
| Current Borrowing | $0 | $0 | $0 |
| Other Current Liabilities (interest free) | $0 | $0 | $0 |
| Total Current Liabilities | $10,000 | $14,000 | $16,000 |
| Long-term Liabilities | $20,000 | $10,000 | $80,000 |
| Total Liabilities | $30,000 | $24,000 | $96,000 |
| Paid-in Capital | $0 | $0 | $0 |
| Retained Earnings | $33,000 | $38,400 | $45,500 |
| Earnings | $9,000 | $11,600 | $14,500 |
| Total Capital | $42,000 | $50,000 | $60,000 |
| Total Capital and Liabilities | $72,000 | $74,000 | $156,000 |
| Other Inputs | |||
| Payment Days | 0 | 0 | 0 |
Services
Valley Airporter provides airport shuttle between Corvallis and Portland International Airport. The shuttle makes ten trips Monday through Friday and nine trips on Saturday and Sunday, 365 days per year.
Departure Times To Portland International Airport:
- 3:00 a.m. (Monday to Friday only)
- 4:30 a.m.
- 6:30 a.m.
- 8:30 a.m.
- 10:30 a.m.
- 12:30 p.m.
- 2:30 p.m.
- 4:30 p.m.
- 6:30 p.m.
- 8:30 p.m.
Departure Times To Corvallis from the Portland International Airport:
- 5:05 a.m.
- 9:00 a.m.
- 11:00 a.m.
- 1:00 p.m.
- 3:00 p.m.
- 5:00 p.m.
- 7:00 p.m.
- 9:00 p.m.
- 11:10 p.m.
| Fares: |
One way |
Round trip |
| Adult (17-54) | $40 | $70 |
| Senior (55+) | $36 | $70 |
| Youth 13-16 without adult | $36 | $70 |
| Youth 13-16 (limit 2 per adult) | $10 | $20 |
| Child 12 and under (limit 2 per adult) | Free | Free |
| 2 or more round trips | n/a | $66 per round trip |
Market Analysis Summary
There are a number of environmental factors that create an increasing demand for shuttle services between Corvallis and Portland International Airport.
- The city of Portland has the states only international airport. The regional airport in Eugene (50 miles south of Corvallis) has flights to Portland but those flights cost more than the shuttle service from Corvallis.
- The city of Corvallis has experienced tremendous growth during the past three years. Enrollment at Oregon State University is up 20%. More importantly, the city is home to a number of high-tech businesses that serve an international market.
- The cost of long-term parking has gone up 20% at Portland International Airport. The cost is now 10$ a day.
4.1 Market Segmentation
Valley Airporter will focus on two significant customer groups:
- University students, staff, faculty, and university visitors.
- Employees of high-tech companies.

| Market Analysis | |||||||
| 2002 | 2003 | 2004 | 2005 | 2006 | |||
| Potential Customers | Growth | CAGR | |||||
| University | 15% | 18,000 | 20,700 | 23,805 | 27,376 | 31,482 | 15.00% |
| High Tech | 10% | 10,000 | 11,000 | 12,100 | 13,310 | 14,641 | 10.00% |
| Total | 13.29% | 28,000 | 31,700 | 35,905 | 40,686 | 46,123 | 13.29% |
Strategy and Implementation Summary
Valley Airporter has developed a strong customer support base at Oregon State University and numerous high-tech companies in Corvallis. The expansion of services is in response to the growing demand by these repeat customers for additional shuttle times and greater capacity of buses.
To facilitate increased sales at Oregon State University, the shuttle will pick up and deliver customers in front of the university’s bookstore on campus.
To increase ridership with high-tech companies, Valley Airporter will offer the round-trip fare package of $60 when a company purchases 10 or more round-trip tickets in advance.
5.1 Sales Forecast
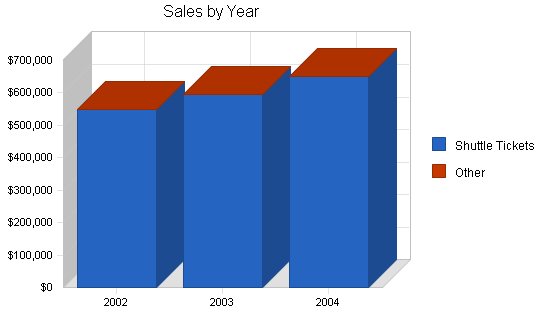
The following is the sales forecast for three years.
| Sales Forecast | |||
| 2002 | 2003 | 2004 | |
| Sales | |||
| Shuttle Tickets | $550,000 | $595,000 | $650,000 |
| Other | $0 | $0 | $0 |
| Total Sales | $550,000 | $595,000 | $650,000 |
| Direct Cost of Sales | 2002 | 2003 | 2004 |
| Shuttle Tickets | $67,000 | $73,000 | $78,000 |
| Other | $0 | $0 | $0 |
| Subtotal Direct Cost of Sales | $67,000 | $73,000 | $78,000 |
Management Summary
Bob and Mary Wilson, co-owners of Valley Airporter, both perform management duties. Mary is the office manager and bookkeeper. She supervises the office staff and oversees the customer service. Bob supervises and schedules the shuttle drivers and is responsible for vehicle repair and maintenance.
6.1 Personnel Plan
The staff for Valley Airporter is as follows:
- Office manager
- Shuttle manager
- Full-time drivers (3)
- Part-time drivers (2)
- Office staff (2)
| Personnel Plan | |||
| 2002 | 2003 | 2004 | |
| Bob Wilson | $30,000 | $32,000 | $34,000 |
| Mary Wilson | $30,000 | $32,000 | $34,000 |
| Drivers | $192,000 | $200,000 | $210,000 |
| Office Staff/Sales | $36,000 | $38,000 | $40,000 |
| Total People | 9 | 9 | 9 |
| Total Payroll | $288,000 | $302,000 | $318,000 |
Financial Plan
The following is the Financial Plan for Valley Airporter.
7.1 Break-even Analysis
The following table and chart show the break-even analysis for Valley Airporter.

| Break-even Analysis | |
| Monthly Revenue Break-even | $41,161 |
| Assumptions: | |
| Average Percent Variable Cost | 12% |
| Estimated Monthly Fixed Cost | $36,147 |
7.2 Projected Profit and Loss
The following table and charts are the projected profit and loss for three years.


| Pro Forma Profit and Loss | |||
| 2002 | 2003 | 2004 | |
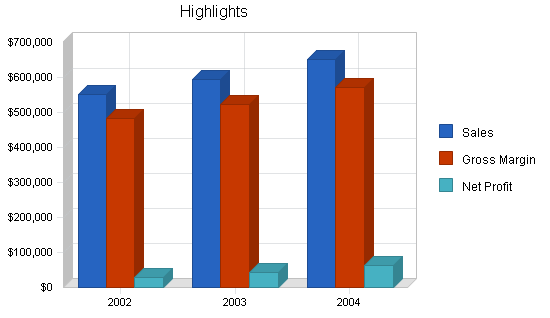
| Sales | $550,000 | $595,000 | $650,000 |
| Direct Cost of Sales | $67,000 | $73,000 | $78,000 |
| Other Production Expenses | $0 | $0 | $0 |
| Total Cost of Sales | $67,000 | $73,000 | $78,000 |
| Gross Margin | $483,000 | $522,000 | $572,000 |
| Gross Margin % | 87.82% | 87.73% | 88.00% |
| Expenses | |||
| Payroll | $288,000 | $302,000 | $318,000 |
| Sales and Marketing and Other Expenses | $24,000 | $27,000 | $30,000 |
| Depreciation | $18,564 | $18,564 | $18,564 |
| Leased Equipment | $0 | $0 | $0 |
| Utilities | $0 | $0 | $0 |
| Insurance | $12,000 | $12,000 | $12,000 |
| Rent | $48,000 | $48,000 | $48,000 |
| Payroll Taxes | $43,200 | $45,300 | $47,700 |
| Other | $0 | $0 | $0 |
| Total Operating Expenses | $433,764 | $452,864 | $474,264 |
| Profit Before Interest and Taxes | $49,236 | $69,136 | $97,736 |
| EBITDA | $67,800 | $87,700 | $116,300 |
| Interest Expense | $7,090 | $6,680 | $7,400 |
| Taxes Incurred | $12,644 | $18,737 | $27,101 |
| Net Profit | $29,502 | $43,719 | $63,235 |
| Net Profit/Sales | 5.36% | 7.35% | 9.73% |
7.3 Projected Cash Flow
The following table and chart is the projected cash flow for three years.

| Pro Forma Cash Flow | |||
| 2002 | 2003 | 2004 | |
| Cash Received | |||
| Cash from Operations | |||
| Cash Sales | $550,000 | $595,000 | $650,000 |
| Subtotal Cash from Operations | $550,000 | $595,000 | $650,000 |
| Additional Cash Received | |||
| Sales Tax, VAT, HST/GST Received | $0 | $0 | $0 |
| New Current Borrowing | $0 | $0 | $0 |
| New Other Liabilities (interest-free) | $24,000 | $24,000 | $24,000 |
| New Long-term Liabilities | $0 | $24,000 | $24,000 |
| Sales of Other Current Assets | $0 | $0 | $0 |
| Sales of Long-term Assets | $0 | $0 | $0 |
| New Investment Received | $0 | $0 | $0 |
| Subtotal Cash Received | $574,000 | $643,000 | $698,000 |
| Expenditures | 2002 | 2003 | 2004 |
| Expenditures from Operations | |||
| Cash Spending | $288,000 | $302,000 | $318,000 |
| Bill Payments | $211,253 | $230,434 | $248,599 |
| Subtotal Spent on Operations | $499,253 | $532,434 | $566,599 |
| Additional Cash Spent | |||
| Sales Tax, VAT, HST/GST Paid Out | $0 | $0 | $0 |
| Principal Repayment of Current Borrowing | $0 | $0 | $0 |
| Other Liabilities Principal Repayment | $0 | $0 | $0 |
| Long-term Liabilities Principal Repayment | $16,800 | $16,800 | $16,800 |
| Purchase Other Current Assets | $24,000 | $24,000 | $24,000 |
| Purchase Long-term Assets | $24,000 | $24,000 | $24,000 |
| Dividends | $0 | $0 | $0 |
| Subtotal Cash Spent | $564,053 | $597,234 | $631,399 |
| Net Cash Flow | $9,947 | $45,766 | $66,601 |
| Cash Balance | $59,947 | $105,712 | $172,313 |
7.4 Projected Balance Sheet
The following table is the projected balance sheet for three years.
| Pro Forma Balance Sheet | |||
| 2002 | 2003 | 2004 | |
| Assets | |||
| Current Assets | |||
| Cash | $59,947 | $105,712 | $172,313 |
| Other Current Assets | $24,000 | $48,000 | $72,000 |
| Total Current Assets | $83,947 | $153,712 | $244,313 |
| Long-term Assets | |||
| Long-term Assets | $154,000 | $178,000 | $202,000 |
| Accumulated Depreciation | $42,564 | $61,128 | $79,692 |
| Total Long-term Assets | $111,436 | $116,872 | $122,308 |
| Total Assets | $195,383 | $270,584 | $366,621 |
| Liabilities and Capital | 2002 | 2003 | 2004 |
| Current Liabilities | |||
| Accounts Payable | $18,680 | $18,963 | $20,564 |
| Current Borrowing | $0 | $0 | $0 |
| Other Current Liabilities | $24,000 | $48,000 | $72,000 |
| Subtotal Current Liabilities | $42,680 | $66,963 | $92,564 |
| Long-term Liabilities | $63,200 | $70,400 | $77,600 |
| Total Liabilities | $105,880 | $137,363 | $170,164 |
| Paid-in Capital | $0 | $0 | $0 |
| Retained Earnings | $60,000 | $89,502 | $133,221 |
| Earnings | $29,502 | $43,719 | $63,235 |
| Total Capital | $89,502 | $133,221 | $196,457 |
| Total Liabilities and Capital | $195,383 | $270,584 | $366,621 |
| Net Worth | $89,502 | $133,221 | $196,457 |

7.5 Business Ratios
Business ratios for the years of this plan are shown below. Industry profile ratios based on the Standard Industrial Classification (SIC) code 4119, Local Passenger Transportation, are shown for comparison.
| Ratio Analysis | ||||
| 2002 | 2003 | 2004 | Industry Profile | |
| Sales Growth | 89.66% | 8.18% | 9.24% | 3.70% |
| Percent of Total Assets | ||||
| Other Current Assets | 12.28% | 17.74% | 19.64% | 47.00% |
| Total Current Assets | 42.97% | 56.81% | 66.64% | 64.90% |
| Long-term Assets | 57.03% | 43.19% | 33.36% | 35.10% |
| Total Assets | 100.00% | 100.00% | 100.00% | 100.00% |
| Current Liabilities | 21.84% | 24.75% | 25.25% | 30.00% |
| Long-term Liabilities | 32.35% | 26.02% | 21.17% | 26.20% |
| Total Liabilities | 54.19% | 50.77% | 46.41% | 56.20% |
| Net Worth | 45.81% | 49.23% | 53.59% | 43.80% |
| Percent of Sales | ||||
| Sales | 100.00% | 100.00% | 100.00% | 100.00% |
| Gross Margin | 87.82% | 87.73% | 88.00% | 78.20% |
| Selling, General & Administrative Expenses | 82.45% | 80.38% | 78.27% | 55.40% |
| Advertising Expenses | 1.09% | 1.34% | 1.54% | 0.70% |
| Profit Before Interest and Taxes | 8.95% | 11.62% | 15.04% | 2.10% |
| Main Ratios | ||||
| Current | 1.97 | 2.30 | 2.64 | 1.96 |
| Quick | 1.97 | 2.30 | 2.64 | 1.51 |
| Total Debt to Total Assets | 54.19% | 50.77% | 46.41% | 56.20% |
| Pre-tax Return on Net Worth | 47.09% | 46.88% | 45.98% | 3.50% |
| Pre-tax Return on Assets | 21.57% | 23.08% | 24.64% | 8.10% |
| Additional Ratios | 2002 | 2003 | 2004 | |
| Net Profit Margin | 5.36% | 7.35% | 9.73% | n.a |
| Return on Equity | 32.96% | 32.82% | 32.19% | n.a |
| Activity Ratios | ||||
| Accounts Payable Turnover | 11.45 | 12.17 | 12.17 | n.a |
| Payment Days | 29 | 30 | 29 | n.a |
| Total Asset Turnover | 2.81 | 2.20 | 1.77 | n.a |
| Debt Ratios | ||||
| Debt to Net Worth | 1.18 | 1.03 | 0.87 | n.a |
| Current Liab. to Liab. | 0.40 | 0.49 | 0.54 | n.a |
| Liquidity Ratios | ||||
| Net Working Capital | $41,266 | $86,749 | $151,749 | n.a |
| Interest Coverage | 6.94 | 10.35 | 13.21 | n.a |
| Additional Ratios | ||||
| Assets to Sales | 0.36 | 0.45 | 0.56 | n.a |
| Current Debt/Total Assets | 22% | 25% | 25% | n.a |
| Acid Test | 1.97 | 2.30 | 2.64 | n.a |
| Sales/Net Worth | 6.15 | 4.47 | 3.31 | n.a |
| Dividend Payout | 0.00 | 0.00 | 0.00 | n.a |
Appendix
| Sales Forecast | |||||||||||||
| Jan | Feb | Mar | Apr | May | Jun | Jul | Aug | Sep | Oct | Nov | Dec | ||
| Sales | |||||||||||||
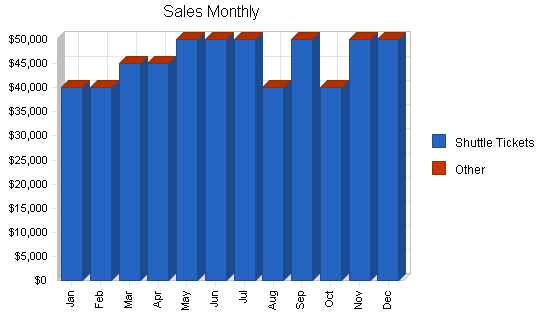
| Shuttle Tickets | 0% | $40,000 | $40,000 | $45,000 | $45,000 | $50,000 | $50,000 | $50,000 | $40,000 | $50,000 | $40,000 | $50,000 | $50,000 |
| Other | 0% | $0 | $0 | $0 | $0 | $0 | $0 | $0 | $0 | $0 | $0 | $0 | $0 |
| Total Sales | $40,000 | $40,000 | $45,000 | $45,000 | $50,000 | $50,000 | $50,000 | $40,000 | $50,000 | $40,000 | $50,000 | $50,000 | |
| Direct Cost of Sales | Jan | Feb | Mar | Apr | May | Jun | Jul | Aug | Sep | Oct | Nov | Dec | |
| Shuttle Tickets | $0 | $5,000 | $6,000 | $6,000 | $7,000 | $7,000 | $7,000 | $6,000 | $6,000 | $5,000 | $6,000 | $6,000 | |
| Other | $0 | $0 | $0 | $0 | $0 | $0 | $0 | $0 | $0 | $0 | $0 | $0 | |
| Subtotal Direct Cost of Sales | $0 | $5,000 | $6,000 | $6,000 | $7,000 | $7,000 | $7,000 | $6,000 | $6,000 | $5,000 | $6,000 | $6,000 | |
| Personnel Plan | |||||||||||||
| Jan | Feb | Mar | Apr | May | Jun | Jul | Aug | Sep | Oct | Nov | Dec | ||
| Bob Wilson | 0% | $2,500 | $2,500 | $2,500 | $2,500 | $2,500 | $2,500 | $2,500 | $2,500 | $2,500 | $2,500 | $2,500 | $2,500 |
| Mary Wilson | 0% | $2,500 | $2,500 | $2,500 | $2,500 | $2,500 | $2,500 | $2,500 | $2,500 | $2,500 | $2,500 | $2,500 | $2,500 |
| Drivers | 0% | $16,000 | $16,000 | $16,000 | $16,000 | $16,000 | $16,000 | $16,000 | $16,000 | $16,000 | $16,000 | $16,000 | $16,000 |
| Office Staff/Sales | 0% | $3,000 | $3,000 | $3,000 | $3,000 | $3,000 | $3,000 | $3,000 | $3,000 | $3,000 | $3,000 | $3,000 | $3,000 |
| Total People | 9 | 9 | 9 | 9 | 9 | 9 | 9 | 9 | 9 | 9 | 9 | 9 | |
| Total Payroll | $24,000 | $24,000 | $24,000 | $24,000 | $24,000 | $24,000 | $24,000 | $24,000 | $24,000 | $24,000 | $24,000 | $24,000 | |
| General Assumptions | |||||||||||||
| Jan | Feb | Mar | Apr | May | Jun | Jul | Aug | Sep | Oct | Nov | Dec | ||
| Plan Month | 1 | 2 | 3 | 4 | 5 | 6 | 7 | 8 | 9 | 10 | 11 | 12 | |
| Current Interest Rate | 10.00% | 10.00% | 10.00% | 10.00% | 10.00% | 10.00% | 10.00% | 10.00% | 10.00% | 10.00% | 10.00% | 10.00% | |
| Long-term Interest Rate | 10.00% | 10.00% | 10.00% | 10.00% | 10.00% | 10.00% | 10.00% | 10.00% | 10.00% | 10.00% | 10.00% | 10.00% | |
| Tax Rate | 30.00% | 30.00% | 30.00% | 30.00% | 30.00% | 30.00% | 30.00% | 30.00% | 30.00% | 30.00% | 30.00% | 30.00% | |
| Other | 0 | 0 | 0 | 0 | 0 | 0 | 0 | 0 | 0 | 0 | 0 | 0 | |
| Pro Forma Profit and Loss | |||||||||||||
| Jan | Feb | Mar | Apr | May | Jun | Jul | Aug | Sep | Oct | Nov | Dec | ||
| Sales | $40,000 | $40,000 | $45,000 | $45,000 | $50,000 | $50,000 | $50,000 | $40,000 | $50,000 | $40,000 | $50,000 | $50,000 | |
| Direct Cost of Sales | $0 | $5,000 | $6,000 | $6,000 | $7,000 | $7,000 | $7,000 | $6,000 | $6,000 | $5,000 | $6,000 | $6,000 | |
| Other Production Expenses | $0 | $0 | $0 | $0 | $0 | $0 | $0 | $0 | $0 | $0 | $0 | $0 | |
| Total Cost of Sales | $0 | $5,000 | $6,000 | $6,000 | $7,000 | $7,000 | $7,000 | $6,000 | $6,000 | $5,000 | $6,000 | $6,000 | |
| Gross Margin | $40,000 | $35,000 | $39,000 | $39,000 | $43,000 | $43,000 | $43,000 | $34,000 | $44,000 | $35,000 | $44,000 | $44,000 | |
| Gross Margin % | 100.00% | 87.50% | 86.67% | 86.67% | 86.00% | 86.00% | 86.00% | 85.00% | 88.00% | 87.50% | 88.00% | 88.00% | |
| Expenses | |||||||||||||
| Payroll | $24,000 | $24,000 | $24,000 | $24,000 | $24,000 | $24,000 | $24,000 | $24,000 | $24,000 | $24,000 | $24,000 | $24,000 | |
| Sales and Marketing and Other Expenses | $2,000 | $2,000 | $2,000 | $2,000 | $2,000 | $2,000 | $2,000 | $2,000 | $2,000 | $2,000 | $2,000 | $2,000 | |
| Depreciation | $1,547 | $1,547 | $1,547 | $1,547 | $1,547 | $1,547 | $1,547 | $1,547 | $1,547 | $1,547 | $1,547 | $1,547 | |
| Leased Equipment | $0 | $0 | $0 | $0 | $0 | $0 | $0 | $0 | $0 | $0 | $0 | $0 | |
| Utilities | $0 | $0 | $0 | $0 | $0 | $0 | $0 | $0 | $0 | $0 | $0 | $0 | |
| Insurance | $1,000 | $1,000 | $1,000 | $1,000 | $1,000 | $1,000 | $1,000 | $1,000 | $1,000 | $1,000 | $1,000 | $1,000 | |
| Rent | $4,000 | $4,000 | $4,000 | $4,000 | $4,000 | $4,000 | $4,000 | $4,000 | $4,000 | $4,000 | $4,000 | $4,000 | |
| Payroll Taxes | 15% | $3,600 | $3,600 | $3,600 | $3,600 | $3,600 | $3,600 | $3,600 | $3,600 | $3,600 | $3,600 | $3,600 | $3,600 |
| Other | $0 | $0 | $0 | $0 | $0 | $0 | $0 | $0 | $0 | $0 | $0 | $0 | |
| Total Operating Expenses | $36,147 | $36,147 | $36,147 | $36,147 | $36,147 | $36,147 | $36,147 | $36,147 | $36,147 | $36,147 | $36,147 | $36,147 | |
| Profit Before Interest and Taxes | $3,853 | ($1,147) | $2,853 | $2,853 | $6,853 | $6,853 | $6,853 | ($2,147) | $7,853 | ($1,147) | $7,853 | $7,853 | |
| EBITDA | $5,400 | $400 | $4,400 | $4,400 | $8,400 | $8,400 | $8,400 | ($600) | $9,400 | $400 | $9,400 | $9,400 | |
| Interest Expense | $655 | $643 | $632 | $620 | $608 | $597 | $585 | $573 | $562 | $550 | $538 | $527 | |
| Taxes Incurred | $959 | ($537) | $666 | $670 | $1,873 | $1,877 | $1,880 | ($816) | $2,187 | ($509) | $2,194 | $2,198 | |
| Net Profit | $2,239 | ($1,253) | $1,555 | $1,563 | $4,371 | $4,379 | $4,388 | ($1,904) | $5,104 | ($1,188) | $5,120 | $5,128 | |
| Net Profit/Sales | 5.60% | -3.13% | 3.46% | 3.47% | 8.74% | 8.76% | 8.78% | -4.76% | 10.21% | -2.97% | 10.24% | 10.26% | |
| Pro Forma Cash Flow | |||||||||||||
| Jan | Feb | Mar | Apr | May | Jun | Jul | Aug | Sep | Oct | Nov | Dec | ||
| Cash Received | |||||||||||||
| Cash from Operations | |||||||||||||
| Cash Sales | $40,000 | $40,000 | $45,000 | $45,000 | $50,000 | $50,000 | $50,000 | $40,000 | $50,000 | $40,000 | $50,000 | $50,000 | |
| Subtotal Cash from Operations | $40,000 | $40,000 | $45,000 | $45,000 | $50,000 | $50,000 | $50,000 | $40,000 | $50,000 | $40,000 | $50,000 | $50,000 | |
| Additional Cash Received | |||||||||||||
| Sales Tax, VAT, HST/GST Received | 0.00% | $0 | $0 | $0 | $0 | $0 | $0 | $0 | $0 | $0 | $0 | $0 | $0 |
| New Current Borrowing | $0 | $0 | $0 | $0 | $0 | $0 | $0 | $0 | $0 | $0 | $0 | $0 | |
| New Other Liabilities (interest-free) | $2,000 | $2,000 | $2,000 | $2,000 | $2,000 | $2,000 | $2,000 | $2,000 | $2,000 | $2,000 | $2,000 | $2,000 | |
| New Long-term Liabilities | $0 | $0 | $0 | $0 | $0 | $0 | $0 | $0 | $0 | $0 | $0 | $0 | |
| Sales of Other Current Assets | $0 | $0 | $0 | $0 | $0 | $0 | $0 | $0 | $0 | $0 | $0 | $0 | |
| Sales of Long-term Assets | $0 | $0 | $0 | $0 | $0 | $0 | $0 | $0 | $0 | $0 | $0 | $0 | |
| New Investment Received | $0 | $0 | $0 | $0 | $0 | $0 | $0 | $0 | $0 | $0 | $0 | $0 | |
| Subtotal Cash Received | $42,000 | $42,000 | $47,000 | $47,000 | $52,000 | $52,000 | $52,000 | $42,000 | $52,000 | $42,000 | $52,000 | $52,000 | |
| Expenditures | Jan | Feb | Mar | Apr | May | Jun | Jul | Aug | Sep | Oct | Nov | Dec | |
| Expenditures from Operations | |||||||||||||
| Cash Spending | $24,000 | $24,000 | $24,000 | $24,000 | $24,000 | $24,000 | $24,000 | $24,000 | $24,000 | $24,000 | $24,000 | $24,000 | |
| Bill Payments | $16,407 | $12,331 | $15,779 | $17,898 | $17,963 | $20,081 | $20,073 | $19,942 | $16,457 | $19,225 | $15,764 | $19,332 | |
| Subtotal Spent on Operations | $40,407 | $36,331 | $39,779 | $41,898 | $41,963 | $44,081 | $44,073 | $43,942 | $40,457 | $43,225 | $39,764 | $43,332 | |
| Additional Cash Spent | |||||||||||||
| Sales Tax, VAT, HST/GST Paid Out | $0 | $0 | $0 | $0 | $0 | $0 | $0 | $0 | $0 | $0 | $0 | $0 | |
| Principal Repayment of Current Borrowing | $0 | $0 | $0 | $0 | $0 | $0 | $0 | $0 | $0 | $0 | $0 | $0 | |
| Other Liabilities Principal Repayment | $0 | $0 | $0 | $0 | $0 | $0 | $0 | $0 | $0 | $0 | $0 | $0 | |
| Long-term Liabilities Principal Repayment | $1,400 | $1,400 | $1,400 | $1,400 | $1,400 | $1,400 | $1,400 | $1,400 | $1,400 | $1,400 | $1,400 | $1,400 | |
| Purchase Other Current Assets | $2,000 | $2,000 | $2,000 | $2,000 | $2,000 | $2,000 | $2,000 | $2,000 | $2,000 | $2,000 | $2,000 | $2,000 | |
| Purchase Long-term Assets | $2,000 | $2,000 | $2,000 | $2,000 | $2,000 | $2,000 | $2,000 | $2,000 | $2,000 | $2,000 | $2,000 | $2,000 | |
| Dividends | $0 | $0 | $0 | $0 | $0 | $0 | $0 | $0 | $0 | $0 | $0 | $0 | |
| Subtotal Cash Spent | $45,807 | $41,731 | $45,179 | $47,298 | $47,363 | $49,481 | $49,473 | $49,342 | $45,857 | $48,625 | $45,164 | $48,732 | |
| Net Cash Flow | ($3,807) | $269 | $1,821 | ($298) | $4,637 | $2,519 | $2,527 | ($7,342) | $6,143 | ($6,625) | $6,836 | $3,268 | |
| Cash Balance | $46,193 | $46,462 | $48,283 | $47,985 | $52,622 | $55,141 | $57,667 | $50,325 | $56,468 | $49,843 | $56,679 | $59,947 | |
| Pro Forma Balance Sheet | |||||||||||||
| Jan | Feb | Mar | Apr | May | Jun | Jul | Aug | Sep | Oct | Nov | Dec | ||
| Assets | Starting Balances | ||||||||||||
| Current Assets | |||||||||||||
| Cash | $50,000 | $46,193 | $46,462 | $48,283 | $47,985 | $52,622 | $55,141 | $57,667 | $50,325 | $56,468 | $49,843 | $56,679 | $59,947 |
| Other Current Assets | $0 | $2,000 | $4,000 | $6,000 | $8,000 | $10,000 | $12,000 | $14,000 | $16,000 | $18,000 | $20,000 | $22,000 | $24,000 |
| Total Current Assets | $50,000 | $48,193 | $50,462 | $54,283 | $55,985 | $62,622 | $67,141 | $71,667 | $66,325 | $74,468 | $69,843 | $78,679 | $83,947 |
| Long-term Assets | |||||||||||||
| Long-term Assets | $130,000 | $132,000 | $134,000 | $136,000 | $138,000 | $140,000 | $142,000 | $144,000 | $146,000 | $148,000 | $150,000 | $152,000 | $154,000 |
| Accumulated Depreciation | $24,000 | $25,547 | $27,094 | $28,641 | $30,188 | $31,735 | $33,282 | $34,829 | $36,376 | $37,923 | $39,470 | $41,017 | $42,564 |
| Total Long-term Assets | $106,000 | $106,453 | $106,906 | $107,359 | $107,812 | $108,265 | $108,718 | $109,171 | $109,624 | $110,077 | $110,530 | $110,983 | $111,436 |
| Total Assets | $156,000 | $154,646 | $157,368 | $161,642 | $163,797 | $170,887 | $175,859 | $180,838 | $175,949 | $184,545 | $180,373 | $189,662 | $195,383 |
| Liabilities and Capital | Jan | Feb | Mar | Apr | May | Jun | Jul | Aug | Sep | Oct | Nov | Dec | |
| Current Liabilities | |||||||||||||
| Accounts Payable | $16,000 | $11,807 | $15,183 | $17,301 | $17,294 | $19,412 | $19,404 | $19,397 | $15,812 | $18,704 | $15,120 | $18,688 | $18,680 |
| Current Borrowing | $0 | $0 | $0 | $0 | $0 | $0 | $0 | $0 | $0 | $0 | $0 | $0 | $0 |
| Other Current Liabilities | $0 | $2,000 | $4,000 | $6,000 | $8,000 | $10,000 | $12,000 | $14,000 | $16,000 | $18,000 | $20,000 | $22,000 | $24,000 |
| Subtotal Current Liabilities | $16,000 | $13,807 | $19,183 | $23,301 | $25,294 | $29,412 | $31,404 | $33,397 | $31,812 | $36,704 | $35,120 | $40,688 | $42,680 |
| Long-term Liabilities | $80,000 | $78,600 | $77,200 | $75,800 | $74,400 | $73,000 | $71,600 | $70,200 | $68,800 | $67,400 | $66,000 | $64,600 | $63,200 |
| Total Liabilities | $96,000 | $92,407 | $96,383 | $99,101 | $99,694 | $102,412 | $103,004 | $103,597 | $100,612 | $104,104 | $101,120 | $105,288 | $105,880 |
| Paid-in Capital | $0 | $0 | $0 | $0 | $0 | $0 | $0 | $0 | $0 | $0 | $0 | $0 | $0 |
| Retained Earnings | $45,500 | $60,000 | $60,000 | $60,000 | $60,000 | $60,000 | $60,000 | $60,000 | $60,000 | $60,000 | $60,000 | $60,000 | $60,000 |
| Earnings | $14,500 | $2,239 | $985 | $2,540 | $4,103 | $8,475 | $12,854 | $17,242 | $15,337 | $20,441 | $19,253 | $24,374 | $29,502 |
| Total Capital | $60,000 | $62,239 | $60,985 | $62,540 | $64,103 | $68,475 | $72,854 | $77,242 | $75,337 | $80,441 | $79,254 | $84,374 | $89,502 |
| Total Liabilities and Capital | $156,000 | $154,646 | $157,368 | $161,642 | $163,797 | $170,887 | $175,859 | $180,838 | $175,949 | $184,545 | $180,373 | $189,662 | $195,383 |
| Net Worth | $60,000 | $62,239 | $60,985 | $62,540 | $64,103 | $68,475 | $72,854 | $77,242 | $75,337 | $80,441 | $79,254 | $84,374 | $89,502 |


