
Heavy Lifting, Inc.
Executive Summary
Heavy Lifting, Inc. is a new entrant in the international civil aviation industry and is in its formative stages. It is being formed to take advantage of a gap that exists in international civil aviation safety with respect to the provision of systems:
- For independently verifying compliance with maximum certified aircraft weight & balance limitations for take off and landing.
- That provide airport operators with a revenue-generating tool that is more efficient and uses a fairer base from which to generate airport landing fees than the present system.
- That offer others in the industry cost savings and accurate weight & balance measurement.
- That achieve peace of mind, fuel and emission cost savings and can reduce maintenance costs for aircraft operators.
The management of Heavy Lifting, Inc. is experienced in the aviation and engineering businesses with a total of over eighty years combined experience.
From a modest initial turnover in the first year, Heavy Lifting, Inc. expects exceptional sales by the end of year three and a commensurate net profit. Our research shows that there is a potential for upwards of 10,000 airports in the World that need our product. From that potential our company expects to obtain a lion’s share of the total market. An outside investor, with 20% of Heavy lifting stock, can expect an IRR of 91% on a $1 Million investment by year 5, when we plan an initial public offering of stock.
We will begin by demonstrating the overdue need for aircraft weight and balance systems at all airports carrying passengers or freight for hire or reward. We will outline a unique and innovative method of revenue generation for airport owners coupled with a tangible flight safety enhancement that can potentially save the industry untold human lives and aircraft hull losses.

1.1 Objectives
The company has the following objectives:
- To build and test the first two (2) Heavy Lifting aircraft weigh bridges at DEF, California, U.S. in the first year of operations.
- To gain acceptance of the concept of weigh bridges as a mandatory safety and compliance checking requirement for all Regular Passenger Transport (RPT) and Cargo aircraft in U.S. and the world.
- Maintain a world database of commercial weight and balance information.
- After acceptance by FAA of the mandatory requirement for RPT airports, to provide Heavy Lifting systems for regular public transport and cargo aircraft safety monitoring and compliance and to gain acceptance from other State CAA’s and from ICAO of the need for a global safety and compliance monitoring weight and balance network (Create SARPS in Annex 6).
It is our ultimate objective to sell Heavy Lifting aircraft weight and balance weigh bridges to all airports in the world that cater for aircraft carrying passengers and/or cargo for hire or reward.
1.2 Mission
Heavy Lifting’s mission is to provide accurate and cost-effective aircraft weight and balance, safety and compliance monitoring systems to all aviation users. This includes regulatory authorities, airport owners, aircraft operators, aircraft insurers, aircraft manufacturers, and the travelling public in the international civil aviation environment.
Our service will ensure that all aircraft will be measured quickly and accurately just before takeoff to ensure they do not exceed the certified maximum allowable takeoff weight limit or exceed the load balance limits for that aircraft type. On landing, each aircraft will be weighed to ensure compliance with maximum certified landing weight limits for that aircraft type.
Our products will help enhance flight safety. They will be produced to the highest international standards of accuracy, reliability and quality assurance. Our products will be ISO 9001 certified.
We pledge:
- Honesty.
- Ethical conduct.
- Fairness.
- Openness (Transparent business dealings).
- Quality Assurance.
- Customer satisfaction.
- State-of-the-art technology.
- Ongoing feedback and discussion.
To our staff, we offer industry leading renumeration packages that recognize and reward excellence. We offer all full-time employees a renumeration package that recognizes their worth to the company, their families and the community. Benefits such as heath care insurance, term life insurance and long-service pension plans are offered to all staff under the terms of our various contracts.
To our customers, we offer the assurance that we will always be listening. We will try to be aware of their needs and involve them in all phases of the product’s implementation. From pre-contract to post-contract, we pledge to behave in a totally professional, helpful and friendly manner.
To our shareholders, we pledge to maximize profits, consistent with a policy of quality and service above profit. We invite every shareholder to be able to contact the company senior management with any and all matters of concern, and to this end we publish the contact email addresses of all senior management. We will do business in an open and professional manner and welcome constructive feedback.
1.3 Keys to Success
Our keys to success are:
- Experienced executive management
- High-quality products
- Systems delivered on time, within budget
- The unfilled market need for our products
Company Summary
Heavy Lifting, Inc. is being formed in April, 2005 to develop a model and prototype for approval after trial by the FAA and thereafter as a provider of Heavy Lifting aircraft weight and balance systems and consultant services to the FAA and airports in the U.S., and subsequently around the world. Its office will be in Gold Coast City, California.
The company will provide Heavy Lifting aircraft weight and balance systems and consultant services to airport owners, aviation authorities, airlines, government agencies and other interested parties, such as insurers, manufacturers, accident investigation bodies and maintenance companies.
The founders of Heavy Lifting, Inc. are:
- Captain A. Airway, MBA – has over four decades of experience in the aviation business as an ex-military pilot, international airline pilot, past ALPA VP and President, Pilot’s MBF Trustee and small business owner. A is a Fellow of the Royal Aeronautical Society. A is the inventor of Heavy Lifting Systems.
- Mr B. Freeway, MBA FRAeS – has over two decades experience in international aviation consultancy through owning and operating his own business, Aviation Consultants International. Previously he was a helicopter pilot for approximately 15 years in Australia. B is also an Aviation professor at GOP University, Nathan, California.
- Mr C. Highway – a former principal shareholder, Company X (weigh machine manufacturer). C is presently a weigh bridge consultant. C has been at the design and innovation forefront of weigh bridge design in the U.S. and has many firsts to his credit. Individual axle weight measurement for locomotives and designing and building a 400-ton mining-dump-truck weigh bridge are just two examples.
- Mr D. Byway – a founding partner of Company Y, Gold Coast City, California. As a founding partner of Company Y, D is involved in all forms of commercial law, including start-up business funding, conveyance and property development both in US and overseas. D gained his Law degree at UCLA.
- Mr E. Expressway – has had over two decades of experience in the food processing and packaging industry and brings international marketing and service engineering experience to the company. E was involved in the New Zealand start-up of his company before moving to the U.S. to become the manufacturing and marketing manager. E travels overseas extensively.
2.1 Company Ownership
Heavy Lifting, Inc., a public unlisted company, will be registered in Gold Coast City, California and will authorize 30,000,000 shares of common and preferential stock. 10,000,000 shares will be set aside as founders’ stock to be divided up amongst key founding shareholders as follows, based on their investment:

- CEO, A. Airway 40%.
- Manufacturing Director, C. Highway 10%.
- Project Director, B. Freeway 10%.
- Legal Services Director, D. Byway 10%
- Marketing Director, E. Expressway 10%
- Venture capital provider 20%
It is also envisaged that management stock options will be made available to key management personnel after operations commence. Founders’ stock plus option stock will not total more than 33% of the authorized shares.
Initial seed capital is to be attracted by way of either an advance payment or other negotiated financial arrangement or both with:
- Funds from private venture capital providers in U.S. or elsewhere in the world.
- Funds from U.S. Government innovative and business sponsorship schemes.
- Sole private investor (Company or individual).
The expected proceeds from the Private Placement are expected to be $2,000,000 at “seed” stage and $300,000,000 in I.P.O. proceeds (projected at $3 per share). Management cannot assure that an I.P.O. will be available at the time desired and at the price sought.
2.2 Start-up Summary
Heavy Lifting, Inc.’s start up costs are projected below, and will be provided directly from “seed” capital.
In the first year year we will build (2) Heavy Lifting machines as follows:
- One (1) prototype at DEF Airport, CA, US.
- One (1) prototype at GHI Airport, Dublin, Ireland
- The initial two (2)units will be prototype models to gain experience and gather data to prove the Heavy Lifting concept is viable and performs to expectations. It will also be used to develop standard operating procedures concerning FAA/CAA rules and create a database of weight & balance information. A free trial period of 6 months per unit should be sufficient to achieve these goals. Once approved, the prototype units will be available for sale. Likely customers are the U.S. and Irish Governments, DEF International Airport or private investors.
Once approved, Heavy Lifting will market the product extensively in US and Europe. Pricing for these Heavy Lifting systems is provisionally estimated at $1,000,000 each (sales of these prototypes are listed in the first month of the plan). Costing is estimated at $650-750,000 each reducing as R & D costs are absorbed. Costing includes consultant services, manufacture of Heavy Lifting locally and under license in Ireland and elsewhere in the world. These prototype materials costs are listed under Inventory, in the Start-up table, below. We will also need to buy equipment sufficient to begin the production process, listed as current and long-term assets, below.
The above figures assume a Deluxe Heavy Lifting Mk I model without customization. The Mk I model includes:
- Visual display panel adjacent to the taxi way.
- Airport operations data link.
- ATS operations data link capability
- CAA operations data link capability.
- Airline operations data link capability
- Third party data link capability.
- Heavy Lifting, Inc. database link.
- In ground installation.
Securing sufficient funding to support the introduction to the aviation industry of Heavy Lifting systems. Specifically; the research and development costs associated with producing a computer model, a portable demonstration unit and funding for the building testing and operation of at least the first full scale unit in ground for FAA; the operation of this unit free of charge for 6 months to build an initial data base.
Due to the need for Government approval, the FAA has been approached on a personal basis. Heavy Lifting Systems needs to build, test and trial its product for a period of up to 6 months. Then the aviation authorities need time to develop rules, regulations and SOP’s for using the Heavy Lifting Systems; they have given us a time frame of a further six months. This makes a total of one year for our start-up period, before payment for the first systems.
This is a necessary evil of creating a world first. It is akin to designing a new type of aircraft. First you must build it to demonstrate it will fly. In the Heavy Lifting case, the weigh bridge design is not new, but the application of the customized weigh bridge to aircraft, and the formulas in the software that allow weight & balance for such a complicated craft to be measured, are totally unique.

| Start-up Funding | |
| Start-up Expenses to Fund | $65,550 |
| Start-up Assets to Fund | $1,650,000 |
| Total Funding Required | $1,715,550 |
| Assets | |
| Non-cash Assets from Start-up | $1,950,000 |
| Cash Requirements from Start-up | $1,000,000 |
| Additional Cash Raised | $1,300,000 |
| Cash Balance on Starting Date | $2,300,000 |
| Total Assets | $4,250,000 |
| Liabilities and Capital | |
| Liabilities | |
| Current Borrowing | $0 |
| Long-term Liabilities | $990,550 |
| Accounts Payable (Outstanding Bills) | $25,000 |
| Other Current Liabilities (interest-free) | $0 |
| Total Liabilities | $1,015,550 |
| Capital | |
| Planned Investment | |
| Founders | $1,000,000 |
| Investor | $1,000,000 |
| Other | $0 |
| Additional Investment Requirement | $0 |
| Total Planned Investment | $2,000,000 |
| Loss at Start-up (Start-up Expenses) | ($65,550) |
| Total Capital | $1,934,450 |
| Total Capital and Liabilities | $2,950,000 |
| Total Funding | $3,015,550 |
| Start-up | |
| Requirements | |
| Start-up Expenses | |
| Legal | $3,000 |
| Stationery etc. | $1,000 |
| Business Plans | $3,000 |
| Company product patent, trade mark registering and LOGO design | $3,000 |
| Operating Expenses during Prototype build (1 year) | $50,000 |
| Website design and publishing | $5,000 |
| Accomodation Auckland Hyatt Rental car Hertz | $550 |
| Total Start-up Expenses | $65,550 |
| Start-up Assets | |
| Cash Required | $1,000,000 |
| Other Current Assets | $250,000 |
| Long-term Assets | $400,000 |
| Total Assets | $1,650,000 |
| Total Requirements | $1,715,550 |
2.2.1 Start-up Funding
To fund our start-up requirements, we will take out a long-term loan, repayable over 10 years. We also need a large investment. For this investment, we are prepared to offer 20,000 shares of equity stock in the venture (see Company Ownership, above, for details). Dividends between start-up and 2010 will be dispersed. Details of the investment analysis can be found in the Financial Plan section, below.
2.3 Company Locations and Facilities
Management intends to operate initially from a home office based in Gold Coast City, CA. Office space allocated is 200 sq ft at no charge during the first year of start-up. Virtual office services will be provided as necessary. All printing, faxing, copying and electronic mail will be provided at this office, except for embossed Logo and letterhead printing.
After start-up, in our first plan year, Heavy Lifting, Inc. will occupy commercial office space at [proprietary and confidential information removed]. This space is available at $100 sq. ft., plus parking fees and maintenance fees.
This space is sufficient for the following usage:
- CEO’s office
- PA Office manager Foyer
- Board room Library
- Cubicle space for contract staff and software engineer
- Equipment space, computer server, printing room, office storage
Later, regional offices are planned for locations to be leased in Montreal, Canada (North America Branch), Bangkok, Thailand (Asia and SE Asia Branch), and Dublin, Ireland (European Branch).
Products and Services
The product consists of three principal parts:
- The patented Heavy Lifting 3 platform weight & balance weigh bridge (Hardware).
- The provision of data collection and transmission services (Hardware and Software).
- The provision of consultant services to evaluate customer’s needs and design custom weigh bridges, for a fee of $200 per hour.
The first two parts are included in the sales price. Consultant services vary by client needs, and will be billed separately. **There are no consultant fees assessed for testing and sale of the initial prototypes, since that is part of the R&D costs of developing the new product.
Product quality is paramount. Always with maximum safety, quality and reliability guaranteed (ISO 9001 certified). Quality and assurance audit systems to maintain maximum quality at all stages of manufacture, operation and maintenance of Heavy Lifting systems.
These products and services are provided by Heavy Lifting, Inc. personnel, weigh bridge manufacturers (under license), and data service providers to aviation.
The Weigh Bridge
Heavy Lifting, Inc.’s aircraft weight & balance product is the ideal system for airport operators and owners.
The Heavy Lifting weigh bridge system allows airport operators to accurately weigh all aircraft using the airport’s facilities. At present, the system used by most international airport operators is charging by aircraft type and number of cycles of take-off and landing or by certified maximum take off weight (MTOW).
Some operators may be operating consistently below their maximum allowable take-off or landing weights, but are being charged at the one flat rate. Some operators may be cheating the system by operating over allowable weights. This may be possible as no accurate, independent and verifiable weighing system is available at airports until now. These operators will be caught, fined or have their licenses suspended or revoked. Nobody wants a deceitful operator on their airfield or in their system. These operators may arrive over-weight from overseas, secure in the knowledge that no one will know.
Airport operators will have the ability to adjust their charges to airline users in line with actual weights. That will allow the airport operator to more accurately assess the impact effects of various weights on the runways, taxi ways and hard standing areas. Visiting aircraft, non-scheduled aircraft and military and state aircraft can be more accurately and fairly billed for their use of the airport.
Most importantly, airport operators will have a tool at their disposal with which to independently verify that all aircraft operating at that airport are operating within the law, as far as aircraft weight is concerned. This will have enormous benefits to the operator in the event of the unthinkable but inevitable fact of an aircraft accident/incident on the airport or to or from that airport. Public liability insurance premiums should show favorable reductions for airports with the Heavy Lifting, Inc. systems in operation.
3.1 Product and Service Description
Weigh Bridges
Heavy Lifting, Inc. provides Heavy Lifting weigh bridges manufactured by world leading weigh bridge manufacturing companies to airport owners, airline operators or authorities.
Starting prices are as low as $1,000,000 for a fully functional Heavy Lifting weigh bridge, designed for aircraft from commuter aircraft to international jet transports such as the B747. Smaller units and portable weighing machines are scheduled for future availability priced from $150,000.
Heavy Lifting, Inc. provides airport owners with construction advice and services for the installation of licensed Heavy Lifting weigh bridges either as lead contractor or sole contractor. We require pre-payment of one half (1/2) the total sales price upon beginning the installation. The rest is due at completion of the project. Normal per-consultant fees for pre-project cost/benefit analyses are $200 per hour plus expenses.
Consulting and Customization
Heavy Lifting, Inc. provides operating and in-service advice and consultation for licensed Heavy Lifting weigh bridges to airport customers. As a guide, Heavy Lifting, Inc. charges $200 per hour plus expenses per consultant. The services provided include but are not limited to:
- Customization of Heavy Lifting weigh bridges to suit customers needs, such as number, placement and complexity of data servers and terminals.
- Advice, based on studies, trials and experience on the location and number of Heavy Lifting machines required.
- Advice on strategy to cope with possible airline, manufacturer or other interested group resistance to the Heavy Lifting concept.
Heavy Lifting, Inc. provides advice and consultation to local and international insurance industry representatives as to:
- The Heavy Lifting concept.
- The need for improved flight safety and consumer confidence by the use of Heavy Lifting weigh bridges.
- Legal implications of NOT employing Heavy Lifting at all airports serving commercial civil aviation.
- Consultation on the International civil aviation related aspects of safety oversight and audit programs and the changing nature of liability for aircraft accidents.
Fees are charged on either a per consultant $200 per hour plus expenses basis or a contract service fee basis.
Heavy Lifting, Inc. offers State Governments our full range of products and services including:
- Heavy Lifting weigh bridges
- Heavy Lifting data services (Hardware and Software). Prices by negotiation
- Heavy Lifting consultant services. Per consultant, $200 per hour plus expenses
Heavy Lifting, Inc. offers accident investigation organizations, such as NTSB, consultancy and Heavy Lifting data and information on a per-hour-plus-expenses basis. Heavy Lifting certified weight data can be an invaluable tool to verify the take off weight of a particular ill fated flight subject to investigation. Similarly accurate and verifiable aircraft landing weights will remove one more unknown from the landing accident story.
Fees are charged at the standard, per consultant, $200 per-hour-plus-expenses basis for personal representations or at a data provision rate.
Service Partnerships
Heavy Lifting, Inc. offers service partnership arrangements to Boeing Aeroplane, Airbus Industries and other international aircraft manufacturers. These arrangements can involve but are not limited to:
- The sharing of technologies and information regarding Heavy Lifting weigh bridges.
- The sharing of information regarding the Heavy Lifting concept of aircraft weight verification and compliance.
- The provision of Heavy Lifting machines and services at company airfields such as Boeing field, Seattle, USA.
- The linking of Heavy Lifting products to Aircraft manufacturer’s products at the design and marketing phases of new aircraft production.
- Access to Heavy Lifting database for manufacturer’s aircraft operating weight by flight, date, model number and aircraft number.
Service partnerships are by contracted agreements only. See the section on Strategic Alliances, number 5.3, below, for further details.
Data Production
Heavy Lifting, Inc. offers Data production services (Heavy Lifting data services) – These include but are not limited to:
- Provision of data to accident investigators.
- Provision of data to aviation authorities.
- Provision of data to airport owners and authorities as applicable.
- Provision of data to Insurance industry professionals and companies.
- Provision of data to aircraft manufacturers.
- Provision of data to educational institutions.
- Provision of data to Safety related organizations.
- Provision of data to IFALPA.
- Provision of data to ICAO.
- Provision of data to IATA.
- Provision of data to consumer rights and passenger interest groups.
- Provision of data by Court order.
- Provision of data for legal firms for deceased estate litigation.
All data information provision services are subject to certain conditions and restrictions regarding there use. Fees are based on various scales depending upon the organization requesting the information and the sensitivity of the data. Educational institutions can be provided with statistical summaries and Annual reports free of charge.
3.2 Competitive Comparison
There is currently no competition.
As the concept is embraced by more and more airports, airlines, governments and regulatory agencies around the U.S. and overseas, other weigh bridge manufacturers will be encouraged to tender for work under license. Heavy Lifting, Inc.’s aim is to capture the major market share of world aviation weigh bridge acquisition through excellence of product, quality assurance guaranteed (ISO 9002).
World-wide patents will be obtained by Heavy Lifting, Inc. to protect the product. U.S. patent [# omitted] has been obtained and is owned by Mr. A. Airway. U.S. registered trademark protection has been obtained by Mr. A. Airway.
Later licenses to build Heavy Lifting weigh bridges will be granted to selected weigh bridge manufacturers as necessary. Due to future state-imposed licensing requirements, Heavy Lifting, Inc. will be in a favorable position to win aviation weigh bridge tenders.
Aggressive litigious legal assistance will be used to maintain market share where necessary. Hopefully this will not be needed except in the rare cases of government, industry or airport owner corruption or collusion.
Competition will be further restricted by government regulation, once obtained, as weigh bridge manufacturers will have to be licensed. Licensing requirements will initially be drawn up by Heavy Lifting, Inc. consultants working from previous development, design and construction experience, and the aviation detail protocol requirements should deter all but the largest weighbridge manufacturers.
Protocols such as traceability of Heavy Lifting components and maintenance systems will be employed throughout the weighbridge design, patent and construction phases. Airport owners, Government agencies and others requiring aviation weigh bridges that are still interested in sourcing their own manufacturers will find it easier and cheaper to license the patented Heavy Lifting weigh bridge from Heavy Lifting, Inc.
3.3 Sales Literature
All company literature is yet to be developed. This includes basic corporate identity material as well as advertising executions. Start-up projections include an expense item for this necessary development work included in the website design item. The logo has already been designed and will be registered. The company website will be the primary marketing medium method for our products.
Sales and marketing in the initial period will be by direct sales approaches to prospective customers by the principals of Heavy Lifting, Inc., using customized power point presentations and personal briefings. Subsequent meetings can be arranged by tele-conference calls.
An important adjunct to these initial marketing and sales efforts will be the presentation of briefings and papers, of the Heavy Lifting concept, by Mr. A. Airway, to prestigious international aviation groups such as:
- the International Insurance Council
- the International Airport Owners’ Federation
- Boeing and Airbus company management, the International Federation of Airline Pilot Associations (IFALPA)
- the International Civil Aviation Organization (ICAO)
- The Royal Aeronautical Society (RAeS)
- The International Air Transport Association (IATA)
3.4 Fulfillment
Specifications for the Heavy Lifting weigh bridge, manufactured under licence by [proprietary and confidential information removed], are available on demand by interested parties, through Heavy Lifting, Inc. All installations will be in-ground units. These units will be tailored to local ground conditions concerning such things as drainage, slope and soil type.
Heavy Lifting, Inc.’s weigh bridges will be capable of weighing aircraft from small regional commuter such as the EMB 135 to giant B744F cargo aircraft. Heavy Lifting weigh bridges will provide visual indications on site to the pilot in command of the aircraft via large digital display panels (also visible to the passengers). Speed across the weigh bridge will be limited to 5 kph for normal use. For compliance, a stop of up to 30 seconds may be required.
Additionally, utilizing state-of-the-art software and additional hardware (dedicated servers and intranet connections), digital read outs to any number of slave stations can be provided, such as to airport operations, airline operations, engineering/maintenance watch rooms, crash fire control room, aircraft recovery and jacking/towing assistance control, and regulatory databases.
Global accident and investigation organizations and the Insurance Council can be provided with database information by arrangement with the Heavy Lifting owners. All weigh bridges will be to OEML standards. The weighing components will have traceable component logging and government-supervised accuracy measurement and audit.
Heavy Lifting weigh bridges will be accurate to within 1-200 kg., depending upon the time allowed for measurement. The weight calibration equipment is conditional upon the provision of concrete weight blocks of up to forty tons each. Heavy lift equipment must be available, via hire or airport equipment to move the blocks on to the weighbridge for accuracy testing and verification.
All data obtained by Heavy Lifting weigh bridges will be stored against an individual flight number and aircraft registration number as specified on the flight plan. Electronic date, time, location and registration stamps of the weighed aircraft will be provided independently by Heavy Lifting Systems.
Detailed engineering drawings of the Heavy Lifting Mk I are available and can be provided to interested parties on request.
3.5 Technology
The hardware component of the Heavy Lifting system is proven technology in other transport industries, such as the road transport industry. The software, however, is peculiar to aircraft. The software must be capable of:
- Calculating the gross weight of the aircraft by totalizing the three platforms’ weight measurements.
- Providing a center of gravity (CG) position in relation to the aircraft mean chord (MAC).
- Correcting measured weight for the effect of wind over the aerofoil surfaces of the aircraft.
- Correcting weight measurement for temperature variations.
- Capturing the date & time against a particular aircraft registration.
- Capturing the registration data electronically.
- Providing a traffic guidance system for aircraft to be measured.
The captured data will be:
- Stored on Heavy Lifting Inc’s servers.
- Produced for customers by email packet via the Internet.
- Produced for customers by data packet via local Intranet.
- Data transmission and recording will be via wireless link on site.
The company website will include a customer log-on service to allow customers to log on and download archival data.
IT requirements for Heavy Lifting, Inc. will consist of:
- Data storage servers.
- Communication servers (Internet/Intranet).
- Hardware units on site such as CG and wind factor units.
- Company IT servers and work stations.
- Company financial computerized system.
As far as possible, off the shelf computer/server and storage units will be used.
Technology affects Heavy Lifting, Inc. to the extent that all communications in the field will be by wireless high speed data connection. Additionally, as proprietory software is developed, improvements and modification states will be continuously reviewed.
3.6 Future Products and Services
Future load cell technology will improve weighing accuracy and will be constantly monitored as it develops. The engineering and construction techniques for Heavy Lifting will be constantly reviewed with a view to improving reliability, accuracy, environmental impact and cost.
A second design model Heavy Lifting Systems (Standard model) is planned to cater for smaller airports with maximum aircraft weight limits suitable for the runways provided. These units can accommodate aircraft up to B767 or equivalent size and will be of twin platform design.
A third design model is planned that caters for small aircraft and special function needs. These smaller model Heavy Lifting (Basic model) can be manufactured to cover temporary needs such as special aviation events at that airport for a limited duration. For example, air show weekends, aviation commuter trade expositions or FAA oversight and audit checks. These Basic Heavy Lifting models can be made road/rail transportable and placed in above-ground locations on an airport maneuvering area. Event organizers may consider event entrant pricing structures based on landing or takeoff weights.
Another use for the Basic Heavy Lifting weigh bridge could be during airfield reconstruction, when other runways/taxi ways with lower LCN numbers have to be used. Temporary aircraft weight monitoring pricing services can be provided by airport authorities. The size of these installations is limited only by the physical limitations of the site.
Market Analysis Summary
The customer base anticipated for Heavy Lifting, Inc.’s products and services includes:
- Airport owners-provision of Heavy Lifting products, financing and consultation services.
- Regulatory Authority-provision of Heavy Lifting products, finance and consultation services.
- Insurance Industry-provision of information regarding the Heavy Lifting concept and products, the need for and the provision of Heavy Lifting weight & balance weigh bridges for civil aviation.
- Aircraft manufacturers-Boeing Aeroplane, Airbus Industries, BAC, Embreaer and other major international aircraft manufacturing companies-consultation and service partner relationships.
- Flight Safety Organizations-International safety consultant services related to the concept of Heavy Lifting aircraft weight & balance systems and their benefits to flight safety.
- International Civil Aviation Organization-assistance to ICAO in the preparation of weigh bridge related standards and related procedures (SARPS).
- Sate Governments-assistance with the formulation of Government policy, regulation drafting and incorporation of weight & balance weigh bridge SARPS in State legislation.
- Data production services (Heavy Lifting, Inc. data services)-providing aircraft operational weight & balance and other data and statistics for legislative monitoring, compliance, research and audit of International civil aviation weigh bridge systems.
- IFALPA & Private aircraft owners associations-educating pilots on the availability of the Heavy Lifting concept product and systems.
- Consumer rights groups and civil aviation passenger representative organizations-to educate and inform them of the Heavy Lifting concept, product and system. Demonstrating how Heavy Lifting can help improve flight safety through compliance, monitoring, audit and data collection of aircraft operating weights.
- Accident investigation bodies and other safety organizations-provision of data and consultant services on an as requested basis.
- Aviation educational organizations-provision of presentations, papers and general information of an educational nature on the Heavy Lifting concept, product and systems.
Launch Location
California is the best place to launch Heavy Lifting due to the support of the CA state government towards technology based companies. FAA and Air YY Inc. and airport owners in CA are also progressive and in touch with their new responsibilities under the ICAO Global Air Safety Plan (GASP) and the International change of emphasis on responsibility for aircraft safety (Duty of Care). X International Airport will be targeted once their present contract with B. Company, Inc. approaches maturity. The airport is in close proximity to the founding shareholders and enjoys co-ownership of Y Airport.
The Heavy Lifting concept is a novel and practical approach to improving International flight safety created by the principal founding member, Captain Airway. It has long been Captain Airway’s dream to introduce this long-overdue piece of safety equipment to the International aviation industry. Now free to pursue this dream, retired from full time airline pilot duties, he feels he has the time and energy to devote to his Heavy Lifting concept and products.
By forming such an experienced team to run Heavy Lifting, Inc., success for the company is guaranteed. As Heavy Lifting, Inc. is the first company in the World to introduce this concept, a considerable degree of competitor challenge can be diluted by the element of speed and surprise.
Obviously, as the concept takes hold worldwide, other aircraft weighbridge manufacturers will emerge as competitors. With an estimated worldwide demand in excess of twenty thousand (20,000) weigh bridges at large to medium airports in ICAO-member-contracting states, let alone the non-contracting States, smaller airfields, portable weigh bridges and future military requirements, Heavy Lifting, Inc. is assured of a comfortable slice of the revenue pie. Demand is based on estimated ten thousand (10,000) commercial airports worldwide.
As the creator of the aircraft weight & balance weigh bridge concept, Heavy Lifting, Inc. has the added advantage of setting the industry standards and requirements for all future aircraft requirements. These standards (ISO 9002 certified) will ensure a healthy load of orders for Heavy Lifting, Inc.’s products well into the future.
The ongoing need for education, training, maintenance, service enhancements, data provision, and new technology innovation will further swell the order books at Heavy Lifting, Inc.
4.1 Market Segmentation
Heavy Lifting, Inc. will create the market for Heavy Lifting aircraft weight & balance weigh bridges with a carefully-planned educational campaign. As its creator, Heavy Lifting, Inc. will control 100% of the market, for at least the first couple of years. Controlled growth at the major airports in California, and European markets will give some maturity and stability to both the markets and the company.
Markets for weigh bridges: airports
- European Union: By the time Heavy Lifting, Inc. moves into its third year of operations, some opposition may be found in the European Union (EU) through complaints to the monopolies commission by European weigh bridge manufacturers. A loss of 30% of the potential market may be encountered by anti-competitive trade rule enforcement action by the EU. As Heavy Lifting, Inc. is primarily a flight safety equipment maker, this market opposition may be limited by trade licensing agreements to perhaps 15% loss. This still ensures a healthy 85% dominance.
- Canadian and U.K. market penetration should initially be able to be contained to 100% domination for at least the first two years under possible regulatory limits or trial permit limitations. The third year may see market dilution for Heavy Lifting, Inc. by as much as 30%, similar to the European mature market expectation. Again, a significant maintenance of revenues can be achieved by licensing agreements.
- Southeast Asia: Once Heavy Lifting, Inc. penetrates the SE Asian market, the market protection from external competition may lie in APEC membership by establishing a secondary headquarters in Australia. Secondly, many airports are still Government-owned and controlled, and Heavy Lifting, Inc., as the World leader in aviation weigh bridge design, construction and consultative services, should maintain a near 100% market share. At the very least market penetration by major competitors should be contained by involving them in licensing agreements. Market share should be a healthy 90% after corruption, graft and trade incentives are allowed for.
- United States: Entry into the U.S. market is much more favorable with respect to market share due to the patriotic nature of the market (as a U.S. Company) and the degree of collusion between business and the FAA. Heavy Lifting, Inc. may gain some advantage by both licensing agreements with U.S. manufacturers and partnership ventures. At the very least, Heavy Lifting, Inc. aims for 50% market share.
Obviously, the U.S. market potential is huge with more than 75% of the available airports of the world for marketing purposes. If even 50% of the market can be maintained, Heavy Lifting, Inc. stands to have considerable financial success.
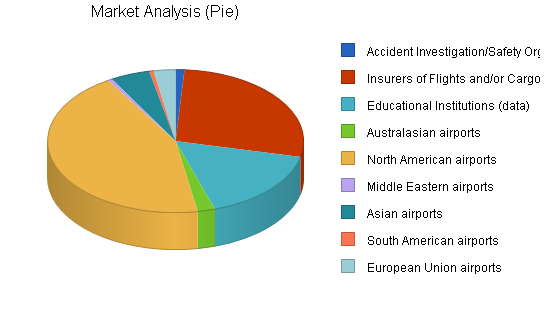
Markets for consulting and data:
- Accident Investigation/Safety Organizations
- Insurers of Flights and Cargo
- Educational Institutions seeking data
The following table and chart reflect the number of potential customers for Heavy Lifting, Inc.’s products and services.
| Market Analysis | |||||||
| Year 1 | Year 2 | Year 3 | Year 4 | Year 5 | |||
| Potential Customers | Growth | CAGR | |||||
| Accident Investigation/Safety Organizations | 0% | 200 | 200 | 201 | 201 | 202 | 0.20% |
| Insurers of Flights and/or Cargo | 2% | 5,000 | 5,100 | 5,202 | 5,306 | 5,412 | 2.00% |
| Educational Institutions (data) | 2% | 3,000 | 3,060 | 3,121 | 3,184 | 3,247 | 2.00% |
| Australasian airports | 1% | 400 | 404 | 408 | 412 | 416 | 1.00% |
| North American airports | 1% | 8,000 | 8,080 | 8,161 | 8,242 | 8,325 | 1.00% |
| Middle Eastern airports | 1% | 100 | 101 | 101 | 102 | 102 | 0.50% |
| Asian airports | 2% | 900 | 918 | 936 | 955 | 974 | 2.00% |
| South American airports | 1% | 100 | 101 | 101 | 102 | 102 | 0.50% |
| European Union airports | 1% | 500 | 500 | 500 | 500 | 500 | 0.00% |
| Total | 1.45% | 18,200 | 18,463 | 18,731 | 19,003 | 19,280 | 1.45% |
4.2 Target Market Segment Strategy
[Proprietary and confidential information removed].
4.2.1 Market Needs
The international aviation market has matured over the past 60 odd years to the point where accident rates have stagnated. Admittedly at an admirably low level when compared to an other human transportation endeavor, however the public through the media still see each and every aircraft crash as a graphic catastrophe far worse than the accident rates suggest.
With the growth of International civil aviation forecast to accelerate by upwards of 20% over the next twenty years, this will translate into even more hull losses at the same accident rate. Any practical, cost-efficient flight safety enhancement must be seized by the aviation industry if a real reduction in the accident rate is to be achieved. Weighing aircraft before and after flight is a way of keeping the aircraft operators of toady and tomorrow honest. The fact these Heavy Lifting weigh bridges can also pay for themselves and make money is a revolutionary concept in fight safety.
Over the past decade, ICAO and other World aviation bodies have recognized that to reduce the accident rate the aviation system rather than the individual must be made accountable. Numerous studies have shown and are showing that factors such as corporate culture, national culture and cockpit culture affect flight safety. There is a growing move Airway from the blame the pilot game to one of accountability and responsibility for all aviation system players.
Thus the Chairman, Board of Directors, CEO and management of airlines are required by legislation in many countries to be accountable and responsible for their aircraft, crew and passengers. Similarly, as the result of deficient airport systems leading to fatal aircraft accidents, the owners and operators of airports are increasingly subject to accountability and responsibility laws. In addition, the ICAO’s Universal Safety and Audit Oversight Program is reinforcing this system wide approach to accident rate reduction.
Pressure from the insurance industry, both directly (through premiums) and indirectly (lobbying in government), is also increasingly turning the spotlight on airport and airline operators.
4.2.2 Market Growth
Market growth will depend mainly, in the beginning, on the financial fortunes of International airport companies. For the foreseeable future their financial forecast appear to be good. Growth in international passenger and cargo revenues for the next twenty years is projected by both IATA and ICAO to be in double-digit numbers.
As the product is more widely accepted as being essential to aviation safety and Legislation is introduced Internationally, the market will expand to countries in the developing and under-developed world. The U.N., the World Bank, Asian Development Bank and other trade lending organizations will be quite capable of providing funds for the Heavy Lifting concept implementation in these less-financially-able countries.
The advent of space travel and any other revolutionary personal mass travel systems that involve mass will always have a need to be weighed before and after flight, both as a regulatory requirement and a flight safety enhancement. The user pays philosophy behind the Heavy Lifting concept can contribute to a Global aviation market growth climate in an positive way.
4.3 Service Business Analysis
The U.S. Federal Government de-regulated the airline industry in 1978. Prior to that time the government virtually guaranteed the profitability of the airline industry, at the expense of the consumer. Routes were restricted. Fares were fixed. Costs got out of control. Today some of the major carriers still continue to operate at less than optimum efficiency. This has spawned the success of various “discount” carriers, most notably Southwest, ValuJet, and the new U2 planned by UAL.
Over the intervening years Governments in the U.K., New Zealand, Canada, the European Union and Australia have increasingly de-regulated their aviation markets. This has had many positive and some negative effects when compared with the old regulated aviation industry. First, it has spawned a whole new breed of aircraft operator, some good, some not so good. Second, airports in increasing numbers are being sold to private investors and being managed as airport companies rather than government services. Mostly good so far. Air Traffic Services such as New Zealand’s Airways Corporation operate on a fee-for-profit based structure, even as a monopoly. Maintenance, leasing companies and airport service companies are becoming increasingly globalized and internationally owned and operated.
This liberalization of the international aviation industry has led to the strengthening of national aviation laws and the introduction of strict entry level conditions on aviation industry would-be players. Regulatory safety oversight and audit is the catch phrase today. This has led to a new era of accountability and responsibility.
The aviation industry that Heavy Lifting, Inc. proposes to enter is still highly regulated. This is deemed necessary in the interests of flight safety, security and standards. Aircraft certification is mandatory in 188 contracting States to ICAO. Airport operators have to obtain Airport operators’ certificates. The ICAO USOAP program currently only applies to aircraft operations, personnel licensing and training and aircraft airworthiness requirements. The next phase is to expand the program to include Air Traffic Services, ICAO Annex 11 and Aerodromes ICAO Annex 14.
Over the past 100 years of aviation development (Wright brothers’ first flight, 17 December 1903), aviation flight safety has progressed in a number of different ways and at varying rates. The advent of two world wars accelerated technological aspects of aviation development. Flight safety demands, although conceived as early as 1919 with the formation of the International Civil Aeronautical Navigation (ICAN) organization, didn’t really start to become a major issue until the formation of ICAO in 1944 at the Chicago Convention.
In the early days of jet transport, as with previous technological advances in civil aviation, the innovation brought large loss of human life; major aircraft hull losses were the catalyst for flight safety improvements. Fail-safe part design, engine reliability, improved CBT pilot training and the utilization of computers to improve all manner of navigation, performance, communication and flight control functions all contributed to the reduction in both accident rates enjoyed today.
Amazingly, organizations such as ICAO and IATA saw no need for accurate and independent aircraft weight measuring. Instead, the industry has placed all their eggs in one basket, perhaps blinded by the seeming infallibility of computers, the calculation of aircraft weight by deduction. Aircraft weight calculations use assumptions, and assumptions by their very nature are not always accurate.
An aircraft is physically weighed only a few times in its life: prior to certification flights and after major hangar maintenance. But only the dry operating weight of the aircraft is weighed by means of verifiable, certified, accurate scales placed under the aircraft’s landing wheels in the maintenance case.
After this weight is recorded, all further weight increases are calculated. The dry operating weight includes lubricants, mandatory safety equipment and fixed aircraft fittings such as galley equipment, seats and seat belts but includes no fuel or payload.
To this weight is added the weight of the payload. Hold-stowed baggage, mail and cargo is weighed in the containers or as individual pieces prior to loading on small weighing machines. Carry-on baggage is not weighed but assumed not to exceed approximately 7 kilograms per passenger. This payload weight is added to the dry operating weight and becomes the zero fuel weight.
Next, the weight of fuel added to the aircraft is calculated. This fuel weight is calculated by using a measured volume of loaded fuel of a specific type and converting this volume to a weight by multiplying the volume by the specific gravity of the fuel. The loaded fuel is compared between the ground refueling figures and the aircraft tank measuring system figures. The total now of the zero fuel weight plus the weight of fuel is added to give the gross all-up weight.
From this point on, the aircraft weight is assumed to be correct. No independently verified check of the aircraft weight is carried out. From time to time, regulatory authorities carry out spot checks of various airlines’ weight calculating procedures. Occasionally actual passenger, baggage, mail, cargo and carry-on baggage are individually weighed but this rare and many passengers refuse to disclose their weights to anybody! Essentially the system is given an audit, not the equipment.
Aircraft weight (Mass) is an extremely important aspect of aviation safety. An aircraft’s ability to fly to performance standards, laid out in the detailed certification procedures, is dependent on a known aircraft weight. Fuel consumption, performance at different altitudes and temperatures, all are dependent on a known weight. The demonstrated ability to fly following the loss of a critical engine on take-off or go-around following a missed approach is an essential part of an aircraft’s certification procedure.
During certification, all items placed on the aircraft being certified are accurately weighed. For the rest of the life of that aircraft, this will in all probability be the last time an independently verifiable aircraft weight is known.
Why is the weight of an aircraft critical to flight safety? Put simply, if the aircraft is too heavy it can’t fly or stop in the remaining runway following a rejected take-off (balance field). If it is too heavy to land, it may not be able to stop in the distance available. Realistically, aircraft seldom take off at their maximum allowable weight or land at their maximum allowable landing weight. But sometimes they do. Long haul flights, fuel ferry flights, short cargo flights and adverse wind and temperature conditions all can put an aircraft at or over its maximum allowable take off or landing weight.
Moreover, these allowable weights vary from model to model and type to type. A DC 10-10 and a DC 10-30 have different allowable maximum weights, as do a B747-200 and a B747-400.
Many aircraft of the glass cockpit generation have eight measuring systems on board. These are generally operated by load sensors on the main undercarriage legs and fed to a computer for weight and centre of gravity computation. This hardware is universally either not ordered by the airline operator, or, in other cases, the software that makes the hardware operate is not purchased or activated. Various reasons are given by airline management and aircraft manufacturers as to why this situation exists, such as inaccuracies in windy conditions.
As mentioned in the preceding paragraph, centre of gravity (C of G) is also a critical requirement for successful flight. For example, a too far aft or too far forward C of G on take-off or landing can and has resulted in aircraft crashing out of control, due to lack of flight control whilst airborne. Correct aircraft loading is a very important part of the safety of flight for all aircraft.
The U.S. FAA began investigating the need for a modern method of weight & balance calculation in 1978 and settled for an onboard weight & balance system (OBWBS). This system is recommended to replace the current manifest weight & balance system (MWBS) as the primary WBS. However, the FAA realized that an external check system was needed to check the OBWBS. The requirement for mandatory OBWBS appears to have stalled.
Accident investigators arriving at the scene of a fatal aircraft crash attempt to retrace the steps of the fateful flight back to the start of take-off. The black boxes give them critical information about many parameters, including engine performance and airspeed, “G” loads and other computed data, but nowhere is there an accurate, verifiable or independent weight check provided.
Legally, an aircraft is not allowed to fly in contravention of various operating limits. Weight is one of those limits. If, after an aircraft accident, it was proven that the aircraft was overweight either at start of take-off or at point of landing, the aircraft operator, crew, airport operator, load controller and/or dispatcher could all find themselves liable for being in breach of the most basic rule of all, operating at an illegal weight. With the present calculated system no one really knows for sure what the actual aircraft weight is. Thus, no one can positively state what the aircraft weight was, or more importantly, what the aircraft weight was not. It is still a calculated guess.
Regulators around the world have become increasingly alarmed at the risk associated with the use of the present MWBS in respect to small regular public transport (RPT) aircraft. They have taken action to restrict the use of average weight tables on smaller RPT aircraft. Larger RPT aircraft are assumed to have a lower risk from WBS error but this assumption is challenged by Heavy Lifting, Inc. founder Captain Airway in his thesis paper [proprietary and confidential information removed].
4.3.1 Competition and Buying Patterns
A critical factor as a new entrant into the aviation industry will be regulatory authority awareness and acceptance. As this is a new product, a large amount of effort is needed to promote the product. However as this product is to be sold to a relatively small number of customers a global advertising budget is not needed. Rather industry specific trade shows and flight safety forums are the best way to spread the message of the Heavy Lifting system. An important tool to increase awareness of the need for external weight & balance systems will be a carefully constructed public awareness campaign using the aviation news media. Personal contacts in this regard are part of the assets of the company.
Safety in aviation is always number one. However just saying that does not necessarily mean that in practice that is so. Modern day industry players at all levels practice a large degree of risk management in their day to day businesses. In the case of Heavy Lifting aircraft weight & balance weigh bridge, Heavy Lifting, Inc. is not talking so much about the need to have the product but rather the distinct disadvantages of not having the product.
Airport operators, like aircraft operators are in the business to make money. But there different ways to make money as any good business knows. It appears to us at Heavy Lifting, Inc. that if a way could be found to make money by charging fees for use, that are seen by the users as fair and reasonable then the task would be that much easier. Additionally if it can be shown that as a result of using the new fee based system flight safety can be directly and measurably enhanced then so much the better.
As the general awareness and acceptance of an independently verified aircraft weigh bridge system, such as the Heavy Lifting system, catches on with the traveling public and the authorities, the demand for this service will increase. Airports with the Heavy Lifting weigh bridge verification program will be at the forefront of the travelling public’s trust.
4.3.2 Main Competitors
There currently no direct competitors to the Heavy Lifting, Inc.’s aircraft weighbridge system.
Manufacturers of on-board weight & balance systems, such as Honeywell Inc., are not seen as competitors, but rather as strategic partners.
4.3.3 Business Participants
The international aviation industry has grown to an enormous size. The participants now are also faced with enormous tasks. Huge amounts of money are involved. Airports handle billions of dollars of equipment every day. With all this enormity of scale comes an commensurate increase in accountability and responsibility. The players remain much the same, but the stakes have changed.
Who are the industry players?
- Aircraft manufacturers.
- Aircraft operators.
- Airport operators.
- Insurance companies.
- Regulators.
- Crew, both ground and air.
- Aircraft flight planners and dispatchers.
- Traffic services-passenger handling.
- Loaders-cargo, baggage and mail.
- Maintenance-heavy (Hangar) and line.
- Travel agents and ticket handling staff.
- Freight forwarder and agents.
- Ground equipment manufacturers.
- Aircraft re-fuelers.
- Air Traffic Management providers.
- Customs, immigration and quarantine services.
- Accident Investigators.
- Crash, Fire and para-medic crews.
- Airport facilities and maintenance.
- Security services.
- On-airport retailers.
- Airport ground transport service providers-trains, buses, vans and taxis.
- Global communications, navigation and surveillance providers.
- ICAO.
- IATA.
- IFALPA.
- RAES.
- Flight safety foundations and bodies.
- Aviation training establishments.
- In-flight catering.
- Safety equipment manufacturers.
This is not a complete, list but it does give an impression of all the people and organizations that are affected by a single aircraft hull loss.
Heavy Lifting, Inc.’s aircraft weight and balance weigh bridge offers one small flight safety input that could have a huge impact on accident rates and hull loss numbers, not to mention the cost of human lives saved by timely intervention following the alert of an overweight or out of balance aircraft.
4.3.4 Distributing a Service
Distribution of aviation weight & balance systems at present doesn’t currently have a pattern – there are no comparable products. Initially the order rate will be small, and controllable. However, once the first two (2) Heavy Lifting systems are in service, and airport management and air traffic services realize the benefits to their operations of the Heavy Lifting product, we anticipate that demand will exceed supply very rapidly.
The task will be to be able to produce the product at a consistently high quality level and still meet the market’s demands. Heavy Lifting, Inc. prefers a sustainable growth rate rather than a too rapid implementation of the Heavy Lifting concept into the aviation industry. The planned growth rate is achievable.
To achieve multiple sales in different regions of the world, distribution will have to be de-centralized. We see issuing manufacturers licenses in the state of sale as the only practical way to keep the momentum of construction and installation going. Some elements, say load cells, data transmission hardware and software, can easily and economically be sourced from California.
We will not have long lines of distribution or supply of parts, nor carry large stocks of inventory. Parts will be manufactured for a specific job and on-site contractors will be used wherever possible. The expertise of engineering, data use and system concept will be provided by Heavy Lifting, Inc. from California or one of the company’s future regional offices.
Strategy and Implementation Summary
Heavy Lifting, Inc.’s market presence will be achieved by identifying and serving a specialized industry safety need and introducing an accurate independent and verifiable weight & balance tool to the industry.
- Marketing will be by direct personal contact with the customer, thus saving on advertising and promotion costs.
- Manufacturing operations will be localized and controlled from a Global office. Local offices will be opened for greater productivity as the company matures.
- The pricing/cost structure ensures positive cash flows, after the initial seed capital phase, without the need for borrowing.
- Market penetration is assumed to be 100% in the first year of operations.
- Future borrowing may be required to bring advanced aspects of product manufacturing into the company.
5.1 Value Proposition
Our value proposition here at Heavy Lifting, Inc. is that we will bring our innovative product and service to the aviation industry through the premium airports of the World. Our product will have the unique properties of sustainable revenue generation whilst at the same time providing an incalculable positive benefit to improving flight safety.
5.2 Competitive Edge
Because Heavy Lifting, Inc. is introducing a new concept to the aviation industry, we feel we will have the market edge for at least the first three years. Civil aviation is an industry that traditionally is highly capital intensive. Aircraft and associated equipment is expensive and complex. The safety regulations involved in civil aviation often take years to formulate and implement.
Heavy Lifting, Inc. understands the business and knows the power of public opinion with regard to aircraft accidents and their aftermath. Channelling this power will be one of the keys to our success.
The nature of the safety products and the certification standards that are required to be demonstrated by any new entrant into the civil aviation environment are well understood by Heavy Lifting, Inc. As the creator of this new aviation product, Heavy Lifting, Inc. by default is the world expert, at least for the first ten years. Later, this valuable experience can be used as a mature market competitive edge.
5.3 Marketing Strategy
Marketing is targeted at:
- Specific airports with progressive and profitable managements. These are felt by Heavy Lifting, Inc. to be the targets of greatest opportunity.
- Regulatory authorities. These are felt to be essential customers if the concept is to be accepted by the industry in that state.
- Airline management. Airlines can be shown a number of cost saving benefits arising from the use of the Heavy Lifting system. Cost savings such as fuel, engine maintenance and emission and noise compliance. Of course embracing the Heavy Lifting concept and products ensures flight safety enhancement.
As the customer base grows, we will increase lobbying at National Government level to introduce legislation mandating the use of aircraft weight & balance systems such as the Heavy Lifting system. The ideal marketing situation is to have the product declared mandatory. International organizations such as ICAO, IFALPA and IATA need to be targeted to ensure world-wide exposure to the product and increase the potential for wider mandatory requirements.
The uniqueness of the Heavy Lifting product is a major marketing focus. Current systems are not accurate, independent or verifiable. The emphasis is not on the need for the Heavy Lifting system, but rather on the loss of revenue opportunities from not having the Heavy Lifting system.
Educational Campaigns as Marketing
Heavy Lifting, Inc. believes that education of the civil aviation community about the Heavy Lifting concept is essential. To this end, nonprofit organizations such as IFALPA and other pilot/flight crew representative bodies are encouraged to contact Heavy Lifting, Inc. for free and subsidized services. The pilot in command after all is the one person that traditionally carried the can for over-weight infractions. Hopefully, with the advent of the Heavy Lifting concept, products and system, this will not be the case in the future.
Heavy Lifting, Inc. will offer consumer rights groups and passenger interest groups a range of services and information based on the above mentioned principle.The ability of the organization to pay.
Heavy Lifting, Inc. will offer consultancy services to ICAO regarding the need for an amendment to Annex 6 Chap 5 to include the words, “by verifiable means, such as an aircraft weighbridge.” Heavy Lifting can either:
- Draft an Air Navigation Working Paper (AN-WP).
- Present a paper to ICAO that suggests the need for an amendment to Annex 6.
- Assist as directed by ICAO in any consultative function.
Heavy Lifting, Inc. will offer educational institutions such as flying schools, aviation colleges and University students access to reports, and summaries from Heavy Lifting data services, free of charge on presentation of approved credentials (Student ID).
5.3.1 Positioning Statement
The most important target markets are:
- United States. Mature market with a difficult regulatory climate for new products. Potentially the largest market.
- Australasia. Ease of access due to knowledge base of local Governments and industry.
- Canada. Although a small market by Global standards Canada offers two unique advantages. The ICAO headquarters is located in Montreal and the market is adjacent to the giant US market.
- Europe. New regulatory environment Europe coupled with growth of market through the addition of new EC mergers. Current market of 15 members expected to grow th 25 within the time period of the sales forecast.
- Middle East/Asia/SE Asia. Smaller market but major growth regions for traffic predictions by ICAO and IATA.
- China. China’s expansion of aviation infrastructure due to its land mass and population base is only tempered by its bureaucratic Government system. This potentially huge market is reduced in the marketing sense by the risks involved in this market.
- South America and Africa are the remaining markets that should see sufficient growth to generate sales in the period after 2007.
- Russia is another huge untapped market that may be as large as Asia/SE Asia market.
5.3.2 Pricing Strategy
Pricing for the Deluxe Heavy Lifting Mk I is $1,000,000, in-ground installed, tested and verified accurate.
The Heavy Lifting Mk I weigh bridge includes:
- In-ground installation at the agreed site.
- All electrical work as agreed in the contract, taxi-way lighting, re-routing, etc.
- Display-board weight display for crew and passenger information adjacent to the weigh bridge.
- Data acquisition and transfer to airport operations data link.
- Data acquisition and transfer software and hardware to link ATC to Heavy Lifting for individual flight stamp.
- Ten (10) year full parts and materials warranty against inferior workmanship or engineering design.
- Free inclusion in the international, confidential, Accident Investigation Prevention Data Acquisition Program (AIPDAP).
Additional data acquisition and transfer software and hardware are available from Heavy Lifting, Inc..
Heavy Lifting, Inc. acknowledges that in the beginning the price tag of up to one million American dollars ($1M USD ) per system may be difficult for the industry to accept. To enable a smooth acceleration of sales, Heavy Lifting, Inc. will offer creative financing plans including, lease, lease to buy and sub-lease programs.
The financing of the product opens the door to a subsidiary cash flow business as a money lender. Heavy Lifting Finance, Inc. will be another lucrative cash flow venture for the parent company.
5.3.3 Distribution Strategy
Distribution is by licensed local manufacturer in the first instance. In the event that a market does not have the infrastructure or local weigh bridge manufacturer to meet Heavy Lifting’s high quality standards, the manufacture and installation will be done from our headquarters in California.
For example, the installation in Gold Coast City, CA will be done by local weigh bridge manufacturer [proprietary and confidential information removed] under contract to Heavy Lifting, Inc., and the software and data link hardware will be done by Heavy Lifting, Inc.’s staff.
Similarly, the introduction of the Heavy Lifting products into Europe will be controlled from Dublin, Ireland. After the trial and acceptance of the initial unit at Dublin International Airport local contractors will be utilized for additional units at Schipol International, Amsterdam, Netherlands, Fraport International, Frankfurt Main, Germany and so on.
As the ICAO world headquarters are in Canada, it follows that trial and installation of the first Canadian unit will be in Canada.
5.3.4 Promotion Strategy
The promotion strategy of Heavy Lifting, Inc. is to introduce the first Heavy Lifting products under FAA/CAA trial conditions and then, in coordination with the airport management, launch media and ongoing news items concerning Heavy Lifting’s innovations. Subsequent promotional opportunities will be capitalized upon as and when they arise in the news media. Heavy Lifting has only a small marketing and promotion budget, for press releases and media relations, to generate media interest in the product itself to promote the business. Additionally, media appearances and news releases by the company will generate aviation news through a carefully-constructed strategic media plan.
International industry forums such as trade shows, flight safety seminars, RAES forums and the like will be actively pursued to gain access to present discussion and informative presentations of the Heavy Lifting concept and product. Pilot representative organizations, such as the International Federation of Airline Pilots (IFALPA), aircraft owners groups and industry magazines will be used to promote Heavy Lifting systems.
The primary methods of product promotion will be direct marketing with potential customers, establishing our product as newsworthy to industry media, an educational campaign focusing on consumer groups, and promotions and information provided on the company’s website.
To meet our goals, the following will be essential:
- Obtaining government acceptance of the concept of aircraft weight and balance measuring systems, such as the Heavy Lifting System. Thereafter, to make them a mandatory requirement at all airports for safety, monitoring and compliance with the existing regulations, thereby acknowledging the independence, accuracy and veracity of the Heavy Lifting system.
- The acceptance by airport owners of their responsibility to check aircraft weight compliance of all aircraft carrying passengers, luggage, mail and cargo, for hire or reward, departing and arriving at that airport. The understanding that the Heavy Lifting System of weight and balance measurement is a valuable revenue-generating tool. We will provide airports with advice regarding the number, placement and type of system that is needed at their airport, and offer innovative financial solutions to the ease the burden of cost of Heavy Lifting systems as required.
- The understanding and acceptance by airline management of the flight safety and cost-saving benefits of Heavy Lifting weight and balance systems, specifically, the peace of mind afforded directors and senior management in knowing their aircraft are operating legally with respect to weight and balance, and the fuel, emission and maintenance savings afforded by the Heavy Lifting system.
- The acceptance of the need for operator-specific Heavy Lifting Systems of weight and balance.
- The understanding by the insurance industry of the need for aircraft operators to verify that they are operating their aircraft in compliance with the certified operating weights.
- The acceptance by Air Traffic Service (ATS) providers of the accuracy, independence, verification and reliability of weight data provided by Heavy Lifting Systems for ATS use in customer fee indexing.
- Obtaining ICAO acceptance of the need for aircraft weigh bridges as a critical element of flight safety. Amending Annex 6, & other Annexes as appropriate to create aircraft weighbridge SARPS.
5.3.5 Marketing Programs
Initially the marketing plan will be carried out by the founder executives of Heavy Lifting, Inc. In year one, Captain Airway will be involved in the U.S. Market while simultaneously Mr. B. Freeway will be involved in the EU and U.K. markets. Captain Airway and B. Freeway will both combine their efforts in Germany in the latter half of 2007. By 2008 the staff of Heavy Lifting, Inc. will be increased to cater for projects in Germany, Australia, New Zealand, Europe and Canada, as well as the U.S. 2009 will see the marketing programs expand into additional markets in United Kingdom and SE Asia.
Our marketing program plans are:
To initially approach the major airlines in the U.S., regarding the advantages offered by way of “peace of mind,” reduced fuel and maintenance costs and reduced noise & emissions by the use of Heavy Lifting weight & balance systems. Later, to approach other airlines of the world in a similar manner.
To approach airport owners in the U.S. and the world to offer the Heavy Lifting solution to landing fee problems. Offer a new landing fee paradigm that will generate revenue through yield management.
To approach the Insurance industry with a view to supporting the introduction of the Heavy Lifting weight & balance system concept to International civil aviation by way of premium discounts and other incentives.
To approach legal firms involved in aircraft accident litigation to offer factual weight & balance data and expert witness services.
To approach the major aircraft manufacturers such as Boeing Aeroplane Company and Airbus, with a view to creating service partnerships between Heavy Lifting, Inc. and the manufacturer in the interests of flight safety and sales of on board weight & balance systems.
Provide consultant services to airport owners, aircraft operators, insurance industry members and aircraft manufacturers regarding the installation, operation, maintenance, compliance and verification features and revenue earning potential of the Heavy Lifting system.
5.4 Sales Strategy
Heavy Lifting, Inc.’s sales strategy is to accurately plan and implement each and every projected sale as identified by marketing. Thus, when a customer says they are interested in our product, we will be able to provide them with an accurate and reliable timetable for completion of the project.
Customers will be consulted at every step of the sales process from taking the order, customizing the product, installing and testing the product, and finally handing over the product to the customer on time and with promised performance and reliability.
There will be no bonuses for early completion, as quality assurance and long-term reliability are too important to rush. We would rather get it right than get it done early.
Work on any product does not commence until details of the agreed method of payment are received and approved by Heavy Lifting, Inc.’s CEO.
5.4.1 Sales Forecast
The company is forecasting sales of $4,000,000 in year one of operations – half of this will come from the sale of the prototypes, listed in the first month of the plan, below. Year two will reach $22,000,000, year three $64,000,000, year four $126,000,000 and year five $240,000,000. This is from sales primarily in three main markets: North America, Australasia, and Europe.
Following the trial and acceptance of Heavy Lifting systems by Irish Aviation Authority (IAA) at Dublin International Airport, Ireland, a branch office will be opened there to handle Europe’s marketing and sales.
Year three, following the successful acceptance by Transport Canada of the Heavy Lifting system will see the planned opening of our office in Toronto, Canada.
Following the successful introduction and acceptance of the Heavy Lifting system in Asia and South East Asia a regional office will be opened in possibly Bangkok, Thailand (Regional home of ICAO) or Singapore.
The fifth year of Global sales may necessitate the opening of branch offices in South America. The need for this office will be dictated by Government assistance and state infrastructure.
The forecasts are for Heavy Lifting Mk I units of three model types:
- Deluxe
- Standard
- Basic
No account has been taken of the flow on financial benefits from additional product enhancements or revenues from finance services. Like wise no account has been taken of special customization needs nor of additional regulatory authority data fees. Research and development costs have been assumed to have been recouped in the first year of operations. Subsequent R & D will be budgeted for as the company and markets mature.
The direct costs listed in the table, below, cover the inventory necessary to manufacture the weigh bridges. After the prototypes are tested, we will contract out the manufacturing of subsequent weigh bridges to reputable local companies – we are currently examining five possible manufacturers with the expertise and facilities necessary to produce and deliver future weigh bridges. Costs for the manufacturing labor are listed in the Profit and Loss table, under “manufacturing costs.”
All sales are cash-basis except consultant fees, which are not predictable and are therefore billed on terms of net 60 days.


| Sales Forecast | |||||
| Year 1 | Year 2 | Year 3 | Year 4 | Year 5 | |
| Sales | |||||
| Consulting | $6,000 | $50,000 | $70,000 | $130,000 | $250,000 |
| Weigh Bridge Deposit | $1,000,000 | $23,500,000 | $32,000,000 | $63,000,000 | $120,000,000 |
| Weigh Bridge Balance | $3,000,000 | $23,500,000 | $32,000,000 | $63,000,000 | $120,000,000 |
| Total Sales | $4,006,000 | $47,050,000 | $64,070,000 | $126,130,000 | $240,250,000 |
| Direct Cost of Sales | Year 1 | Year 2 | Year 3 | Year 4 | Year 5 |
| Materials/Construction | $2,602,600 | $35,250,000 | $41,645,500 | $81,900,000 | $156,000,000 |
| Other | $0 | $0 | $0 | $0 | $0 |
| Subtotal Direct Cost of Sales | $2,602,600 | $35,250,000 | $41,645,500 | $81,900,000 | $156,000,000 |
5.4.2 Sales Programs
In year one Captain Airway and Mr. B. Freeway will be working full time in the U.S. and Dublin to achieve the first six (6) inaugural installations. In year two (2) the staff will have to be expanded to allow for six project managers. In addition to the two (2) principals, C. Highway will be involved in projects in the Europe and Australia. It is envisaged that by year three (3) and four (4), six (6) full time project managers will be employed.
5.5 Strategic Alliances
The company plans to establish strategic alliances in two important areas of operation:
- With aircraft manufacturers. Safety systems approach to aviation as a common objective.
- With local weigh bridge manufacturers. Company X sees this as an effective method to reduce competition and/or use competition as a licensing source of revenue.
5.6 Milestones
The following table lists important program milestones, with dates and managers in charge and budgets for each. The milestone schedule indicates our emphasis on planning for implementation.
Management expects that the current regulatory climate in the U.S., New Zealand, Australia and Europe favors a systems approach to flight safety and that this is an ideal time to introduce a new safety concept and product line. 2005, with a Global return to growth in the airline industry, is an opportune time to start our company.
The cost of producing each Heavy Lifting weigh bridge should reduce as R & D costs are absorbed.
Calibration costs can be reduced the more units that are installed at one location. For example, the concrete weight measurement loads can be shared, and thus capital and operating costs can be reduced.

| Milestones | |||||
| Milestone | Start Date | End Date | Budget | Manager | Department |
| Seed Financing | 3/1/2005 | 3/31/2005 | $4,000 | Founder Memebers | Executive |
| Incorporation | 3/15/2005 | 3/31/2005 | $2,000 | Legal Serv. Dir. | Executive |
| Initial PA Office Manager hiring | 3/31/2005 | 3/31/2005 | $500 | CEO | Executive |
| Engineering R & D | 3/31/2005 | 6/30/2005 | $100,000 | CEO/Tech Director | Executive |
| CAA test and trials. | 6/30/2005 | 12/31/2005 | $750,000 | CEO/Tech DIR | Executive |
| Sales drive | 3/31/2005 | 3/31/2006 | $50,000 | CEO/Tech. Dir. | Executive |
| PA Office manager person. | 3/31/2005 | 3/31/2006 | $75,000 | CEO | Executive |
| Office lease 2004-05 | 3/31/2005 | 3/31/2006 | $50,000 | CEO | Executive |
| International Lobbying | 3/31/2005 | 3/31/2006 | $50,000 | CEO | Executive |
| IAA lobbying, test and trials | 1/1/2006 | 6/30/2006 | $500,000 | CEO/Tech. Dir. | Executive |
| Engineering overseas logistics | 3/31/2006 | 6/30/2006 | $12,000 | Software Engineer | Executive |
| Totals | $1,593,500 | ||||
Management Summary
Heavy Lifting, Inc. has an experienced Management team consisting of:
Captain A. Airway: CEO, inventor, principal shareholder and owner of the Heavy Lifting trade mark, name and patent. Captain Airway retired from full-time flying after over forty years in aviation, with 22,000 safe flying hours, in August 2004.
B. Freeway: Technical Director, founding shareholder and previous owner of Company X, the largest manufacturer of weighing machines in the U.S.
C. Highway: Project Director, founding shareholder and principal consultant, former helicopter pilot and current Professor of Aviation Management at PDQ University.
D. Byway, J.D.: Legal Services Director, founding shareholder and principal partner of Company Z, CA specializing in property and investment legal advise.
The management of Heavy Lifting, Inc. brings with it not just nearly 75 years in aviation and engineering experience, but also close personal relationships. A. Airway and E. Expressway are friends and neighbors. E has had over twenty years of experience in the marketing of food processing equipment globally. He has been intimately involved in the launch of new and innovative products.
A. Airway approached C. Highway with the Heavy Lifting idea and was immediately taken with C.’s enthusiastic and positive support for the concept. C. Highway’s involvement with the company began due to the fact that C. was A.’s Professor of project management at UCLA. C. Highway runs his own successful international aviation consultancy. Highway is an expert in project management and also brings a wealth of experience and contacts in international aviation at a high government level.
B. Freeway, after a lifetime of involvement in the weighing machine business, recently sold his shares in Company X, and is keen to become involved in a new business with tremendous potential, like Heavy Lifting, Inc. Apart from his wealth of technical knowledge, skill, and experience in his industry, B. Freeway has the contacts in engineering licensing and software engineering that make him an excellent choice for Technical Director.
D. Byway’s past work is a perfect fit for Heavy Lifting, Inc. D. is involved in new product sales and installation in markets from Indonesia to India. His engineering and marketing background make him a valuable asset to the company.
E. Expressway comes to Heavy Lifting, Inc. by way of personal recommendation from close confidant and property colleague, L. Longway. L. has had a lifetime of business involvement in California as a respected and capable commercial, property, and land development lawyer and principal partner of Company Y. E. also has contracts with overseas investors for legal services.
A. Airway has had this idea (Heavy Lifting) for a number of years but has never found the right time to process the idea. That time is now. A., although being primarily an international pilot, has also had many successful small business ventures over the past 30 years. All these businesses involved the introduction of new ideas or products to the market place. In addition he has had over six (6) years involvement in the aviation industry in California [proprietary and confidential information removed].
C. Highway has been running his own highly successful international aviation consultancy [proprietary and confidential information removed] whilst at the same time gaining considerable academic achievements in aviation management. He has a Master of Aviation Management, and is a professor of project management.
6.1 Organizational Structure
The company will be organized into nine (9) major operational areas:
- Marketing and Sales.
- Engineering and Manufacturing hardware and software.
- Project Management.
- Customer Service.
- Legal and Administration Services.
- Financial and Information Systems.
- Research and Development.
- Business Development.
- Quality Assurance.
6.2 Personnel Plan
The following table illustrates personnel needs and growth plans for both key executives and category needs by group.
All full time employees can expect fair and friendly contract negotiations, and high salary and benefits packages, including:
- Health care insurance
- Term life insurance
- Pension plan
- Sick leave
- Annual vacation
It is expected that all key executives will participate in the company’s stock option plan as well.
| Personnel Plan | |||||
| Year 1 | Year 2 | Year 3 | Year 4 | Year 5 | |
| Chief Executive Officer | $199,992 | $200,000 | $200,000 | $200,000 | $200,000 |
| Technical Director | $150,000 | $200,000 | $200,000 | $200,000 | $200,000 |
| Project Director | $127,500 | $200,000 | $200,000 | $200,000 | $200,000 |
| Office Manager/PA to CEO | $75,000 | $75,000 | $75,000 | $75,000 | $75,000 |
| Legal Services Director | $120,000 | $180,000 | $180,000 | $180,000 | $180,000 |
| Software Engineer | $99,996 | $100,000 | $100,000 | $100,000 | $100,000 |
| Corporate Services | $150,000 | $0 | $0 | $0 | $0 |
| Total People | 9 | 9 | 9 | 9 | 9 |
| Total Payroll | $922,488 | $955,000 | $955,000 | $955,000 | $955,000 |
Financial Plan
The business is expected to grow annually at 100-200%. The growth is self-funding after the initial period gaining Government approval by FAA US. The growth rate is restricted by the need to maintain quality of product.
7.1 Valuation
For an initial investment of $1,000,000, an outside investor will receive 20% of the initial shares of Heaving Lifting, Inc., substantial dividends by 2010, and a buy-out option when the company goes public (in 2010 or 2011). We project a sales-based valuation of the company over $480,000,000 in 2010. This number could be substantially higher if the consumer demand for mandatory weigh bridges on all commercial flights in Asia and Europe matches the likely demand in the U.S. With an ending valuation on the initial outside investment of $96.1 Million, this represents an IRR of 91%.
| Investment Analysis | ||||||
| Start | Year 1 | Year 2 | Year 3 | Year 4 | Year 5 | |
| Initial Investment | ||||||
| Investment | $1,000,000 | $0 | $0 | $0 | $0 | $0 |
| Dividends | $0 | $0 | $0 | $7,000,000 | $15,000,000 | $25,000,000 |
| Ending Valuation | $0 | $0 | $0 | $0 | $0 | $96,160,000 |
| Combination as Income Stream | ($1,000,000) | $0 | $0 | $7,000,000 | $15,000,000 | $121,160,000 |
| Percent Equity Acquired | 20% | |||||
| Net Present Value (NPV) | $3,872,003 | |||||
| Internal Rate of Return (IRR) | 91% | |||||
| Assumptions | ||||||
| Discount Rate | 10.00% | |||||
| Valuation Earnings Multiple | 10 | 10 | 10 | 10 | 10 | |
| Valuation Sales Multiple | 2 | 2 | 2 | 2 | 2 | |
| Investment (calculated) | $2,000,000 | $0 | $0 | $0 | $0 | $0 |
| Dividends | $0 | $0 | $7,000,000 | $15,000,000 | $25,000,000 | |
| Calculated Earnings-based Valuation | $880,000 | $57,020,000 | $122,240,000 | $248,520,000 | $480,800,000 | |
| Calculated Sales-based Valuation | $8,010,000 | $94,100,000 | $128,140,000 | $252,260,000 | $480,500,000 | |
| Calculated Average Valuation | $4,445,000 | $75,560,000 | $125,190,000 | $250,390,000 | $480,650,000 | |
7.2 Important Assumptions
The financial plan depends on important assumptions, most of which are shown in the following table. They key underlying assumptions are:
- Growth of 100-200% per annum.
- Marketing coup by product uniqueness and speed of entry.
- Limited initial competition.
- Stable costs.
| General Assumptions | |||||
| Year 1 | Year 2 | Year 3 | Year 4 | Year 5 | |
| Plan Month | 1 | 2 | 3 | 4 | 5 |
| Current Interest Rate | 10.00% | 10.00% | 10.00% | 10.00% | 10.00% |
| Long-term Interest Rate | 9.17% | 0.00% | 10.00% | 10.00% | 10.00% |
| Tax Rate | 33.00% | 33.00% | 33.00% | 33.00% | 33.00% |
| Sales Tax | 9 | 0 | 0 | 0 | 9 |
7.3 Break-even Analysis
In the start-up period we will build up to two (2) Heavy Lifting weigh bridges. The first two (2) units, in CA and Dublin will be used for trial as well as operational purposes. The Heavy Lifting systems will be at:
- San Diego International Airport (1)
- Dublin, Ireland (1)
These two, along with two Heavy Lifting outside-manufactured weigh bridges, will be sold in the first year. The Break-even table, below, reflects the fact that we do not expect to be profitable until the second year.

| Break-even Analysis | |
| Monthly Revenue Break-even | $236,541 |
| Assumptions: | |
| Average Percent Variable Cost | 65% |
| Estimated Monthly Fixed Cost | $82,866 |
7.4 Projected Profit and Loss
Profits are expected to be in line with sales forecasts, per annum, after the first year of operations (2 years from start-up). This profit level relies on an expanding market and increasing sales. We are confident that we will meet these high sales goals after the first year, as publicity about our first weigh bridges brings us new customers and initiates a public safety (and international security) debate about aircraft weight laws and enforcement.
Overhead costs for the first year of operations consists of:
- Office space based on current property leasing rates. Office space sufficient for CEO office, Office manager office, Board room, Communications and printing room, Project manager office space, and tea and coffee making facilities.
- CEO salary package including executive health insurance, term life insurance ($250,000) and comprehensive world travel insurance $200,000 plus travel (Flight and rental car), accommodation (Marriott/Hyatt or equivalent hotels and food expenses. Estimate based on two business class flights to San Diego per month, accommodation for up to 10 days per month and food at $100 per day. Domestic travel (Flight and rental car), accommodation Marriott Hotels or equivalent) and food ($100 per day).
- Technical director expenses. Travel (Flight and rental car costs), accommodation (Marriott or equivalent) and food expenses as required. Estimate based on one business class flight between Gold Coast City and San Diego per month, accommodation for up to 10 days per month and food at $100 per day. Domestic business class travel (Flight cost), accommodation costs (Marriott Hotel or equivalent) and food costs (100 per day) in San Diego estimated at up to 5 days per month.
- Project director fees charged on a consultant basis at cost plus expenses.
- Legal services director fees charged on an advisory basis at cost plus expenses.
- Research & Development costs for software development.
- Office staff consisting of Office manager based on current salaries in Gold Coast City, $75,000 plus benefits: Medi bank private; parking and pension plan (Over ten years service).
- Software engineer at $100,000/year.
- Office equipment consisting of furniture and furnishings, computer equipment, office equipment including, scanner, copier, printer, facsimile phone system and office computer network.
- Office cubicle space for project management, technical management and software engineer.
- Tea and coffee making facilities.
- Stationery and office supplies sufficient for annual production of reports, letters, papers, power point presentations, regulations library (Digital), technical data library (Digital) and online conferences and presentations.
- Heavy Lifting database server and mass storage equipment including secure backup and power loss system.
- Office security system (Response alarm).


| Pro Forma Profit and Loss | |||||
| Year 1 | Year 2 | Year 3 | Year 4 | Year 5 | |
| Sales | $4,006,000 | $47,050,000 | $64,070,000 | $126,130,000 | $240,250,000 |
| Direct Cost of Sales | $2,602,600 | $35,250,000 | $41,645,500 | $81,900,000 | $156,000,000 |
| Manufacturing costs | $192,000 | $2,256,000 | $3,072,000 | $6,040,000 | $11,400,000 |
| Total Cost of Sales | $2,794,600 | $37,506,000 | $44,717,500 | $87,940,000 | $167,400,000 |
| Gross Margin | $1,211,400 | $9,544,000 | $19,352,500 | $38,190,000 | $72,850,000 |
| Gross Margin % | 30.24% | 20.28% | 30.21% | 30.28% | 30.32% |
| Expenses | |||||
| Payroll | $922,488 | $955,000 | $955,000 | $955,000 | $955,000 |
| Sales and Marketing and Other Expenses | $20,400 | $20,000 | $20,000 | $20,000 | $20,000 |
| Depreciation | $36,000 | $36,000 | $36,000 | $36,000 | $36,000 |
| Leased Equipment | $5,004 | $5,000 | $5,000 | $5,000 | $5,000 |
| Rent and Utilities | $10,500 | $18,000 | $18,000 | $18,000 | $18,000 |
| Payroll Taxes | $0 | $0 | $0 | $0 | $0 |
| Other | $0 | $0 | $0 | $0 | $0 |
| Total Operating Expenses | $994,392 | $1,034,000 | $1,034,000 | $1,034,000 | $1,034,000 |
| Profit Before Interest and Taxes | $217,008 | $8,510,000 | $18,318,500 | $37,156,000 | $71,816,000 |
| EBITDA | $253,008 | $8,546,000 | $18,354,500 | $37,192,000 | $71,852,000 |
| Interest Expense | $86,263 | $0 | $74,155 | $64,155 | $54,155 |
| Taxes Incurred | $43,146 | $2,808,300 | $6,020,634 | $12,240,309 | $23,681,409 |
| Net Profit | $87,599 | $5,701,700 | $12,223,711 | $24,851,536 | $48,080,436 |
| Net Profit/Sales | 2.19% | 12.12% | 19.08% | 19.70% | 20.01% |
7.5 Projected Cash Flow
This business plan cash flows positively due to the fact that customers pay 50% of the price in advance. The balance is payable on completion, net 30 days.
As the contractors are paid progress payments for work completed, the cash flow will always remain positive without the need for borrowing.
For those sales subject to finance, a separate business plan is required.

| Pro Forma Cash Flow | |||||
| Year 1 | Year 2 | Year 3 | Year 4 | Year 5 | |
| Cash Received | |||||
| Cash from Operations | |||||
| Cash Sales | $3,000,000 | $47,000,000 | $64,000,000 | $126,000,000 | $240,000,000 |
| Cash from Receivables | $1,004,000 | $51,901 | $69,961 | $129,880 | $249,762 |
| Subtotal Cash from Operations | $4,004,000 | $47,051,901 | $64,069,960 | $126,129,881 | $240,249,761 |
| Additional Cash Received | |||||
| Sales Tax, VAT, HST/GST Received | $0 | $0 | $0 | $0 | $0 |
| New Current Borrowing | $0 | $0 | $0 | $0 | $0 |
| New Other Liabilities (interest-free) | $0 | $0 | $0 | $0 | $0 |
| New Long-term Liabilities | $0 | $0 | $0 | $0 | $0 |
| Sales of Other Current Assets | $0 | $0 | $0 | $0 | $0 |
| Sales of Long-term Assets | $0 | $0 | $0 | $0 | $0 |
| New Investment Received | $0 | $0 | $0 | $0 | $0 |
| Subtotal Cash Received | $4,004,000 | $47,051,901 | $64,069,960 | $126,129,881 | $240,249,761 |
| Expenditures | Year 1 | Year 2 | Year 3 | Year 4 | Year 5 |
| Expenditures from Operations | |||||
| Cash Spending | $922,488 | $955,000 | $955,000 | $955,000 | $955,000 |
| Bill Payments | $2,937,634 | $37,087,541 | $49,992,440 | $96,224,545 | $183,708,062 |
| Subtotal Spent on Operations | $3,860,122 | $38,042,541 | $50,947,440 | $97,179,545 | $184,663,062 |
| Additional Cash Spent | |||||
| Sales Tax, VAT, HST/GST Paid Out | $0 | $0 | $0 | $0 | $0 |
| Principal Repayment of Current Borrowing | $0 | $0 | $0 | $0 | $0 |
| Other Liabilities Principal Repayment | $0 | $0 | $0 | $0 | $0 |
| Long-term Liabilities Principal Repayment | $99,000 | $100,000 | $100,000 | $100,000 | $100,000 |
| Purchase Other Current Assets | $0 | $0 | $0 | $0 | $0 |
| Purchase Long-term Assets | $0 | $0 | $0 | $0 | $0 |
| Dividends | $0 | $0 | $7,000,000 | $15,000,000 | $25,000,000 |
| Subtotal Cash Spent | $3,959,122 | $38,142,541 | $58,047,440 | $112,279,545 | $209,763,062 |
| Net Cash Flow | $44,878 | $8,909,360 | $6,022,520 | $13,850,335 | $30,486,699 |
| Cash Balance | $2,344,878 | $11,254,238 | $17,276,758 | $31,127,093 | $61,613,792 |
7.6 Projected Balance Sheet
The table below presents the balance sheet for Heavy Lifting, Inc. This table reflects a positive cash position throughout the period of this financial plan and dramatic growth in net worth.
| Pro Forma Balance Sheet | |||||
| Year 1 | Year 2 | Year 3 | Year 4 | Year 5 | |
| Assets | |||||
| Current Assets | |||||
| Cash | $2,344,878 | $11,254,238 | $17,276,758 | $31,127,093 | $61,613,792 |
| Accounts Receivable | $2,000 | $99 | $139 | $259 | $497 |
| Other Current Assets | $250,000 | $250,000 | $250,000 | $250,000 | $250,000 |
| Total Current Assets | $2,596,878 | $11,504,338 | $17,526,897 | $31,377,352 | $61,864,289 |
| Long-term Assets | |||||
| Long-term Assets | $400,000 | $400,000 | $400,000 | $400,000 | $400,000 |
| Accumulated Depreciation | $36,000 | $72,000 | $108,000 | $144,000 | $180,000 |
| Total Long-term Assets | $364,000 | $328,000 | $292,000 | $256,000 | $220,000 |
| Total Assets | $2,960,878 | $11,832,338 | $17,818,897 | $31,633,352 | $62,084,289 |
| Liabilities and Capital | Year 1 | Year 2 | Year 3 | Year 4 | Year 5 |
| Current Liabilities | |||||
| Accounts Payable | $47,279 | $3,317,038 | $4,179,887 | $8,242,805 | $15,713,307 |
| Current Borrowing | $0 | $0 | $0 | $0 | $0 |
| Other Current Liabilities | $0 | $0 | $0 | $0 | $0 |
| Subtotal Current Liabilities | $47,279 | $3,317,038 | $4,179,887 | $8,242,805 | $15,713,307 |
| Long-term Liabilities | $891,550 | $791,550 | $691,550 | $591,550 | $491,550 |
| Total Liabilities | $938,829 | $4,108,588 | $4,871,437 | $8,834,355 | $16,204,857 |
| Paid-in Capital | $2,000,000 | $2,000,000 | $2,000,000 | $2,000,000 | $2,000,000 |
| Retained Earnings | ($65,550) | $22,049 | ($1,276,251) | ($4,052,540) | ($4,201,003) |
| Earnings | $87,599 | $5,701,700 | $12,223,711 | $24,851,536 | $48,080,436 |
| Total Capital | $2,022,049 | $7,723,749 | $12,947,460 | $22,798,997 | $45,879,433 |
| Total Liabilities and Capital | $2,960,878 | $11,832,338 | $17,818,897 | $31,633,352 | $62,084,289 |
| Net Worth | $2,022,049 | $7,723,749 | $12,947,460 | $22,798,997 | $45,879,433 |
7.7 Business Ratios
The following table outlines some of the more important ratios from the Other Airport Operations industry. The final column, Industry Profile, details specific ratios based on the industry as it is classified by the NAICS Industry Classification code, 488119.
| Ratio Analysis | ||||||
| Year 1 | Year 2 | Year 3 | Year 4 | Year 5 | Industry Profile | |
| Sales Growth | 0.00% | 1074.49% | 36.17% | 96.86% | 90.48% | 11.53% |
| Percent of Total Assets | ||||||
| Accounts Receivable | 0.07% | 0.00% | 0.00% | 0.00% | 0.00% | 20.03% |
| Other Current Assets | 8.44% | 2.11% | 1.40% | 0.79% | 0.40% | 28.06% |
| Total Current Assets | 87.71% | 97.23% | 98.36% | 99.19% | 99.65% | 52.69% |
| Long-term Assets | 12.29% | 2.77% | 1.64% | 0.81% | 0.35% | 47.31% |
| Total Assets | 100.00% | 100.00% | 100.00% | 100.00% | 100.00% | 100.00% |
| Current Liabilities | 1.60% | 28.03% | 23.46% | 26.06% | 25.31% | 27.08% |
| Long-term Liabilities | 30.11% | 6.69% | 3.88% | 1.87% | 0.79% | 21.42% |
| Total Liabilities | 31.71% | 34.72% | 27.34% | 27.93% | 26.10% | 48.50% |
| Net Worth | 68.29% | 65.28% | 72.66% | 72.07% | 73.90% | 51.50% |
| Percent of Sales | ||||||
| Sales | 100.00% | 100.00% | 100.00% | 100.00% | 100.00% | 100.00% |
| Gross Margin | 30.24% | 20.28% | 30.21% | 30.28% | 30.32% | 44.67% |
| Selling, General & Administrative Expenses | 0.00% | 85.78% | 76.98% | 0.00% | 0.00% | 24.70% |
| Advertising Expenses | 0.00% | 62.07% | 52.09% | 0.00% | 0.00% | 0.44% |
| Profit Before Interest and Taxes | 5.42% | 18.09% | 28.59% | 29.46% | 29.89% | 0.57% |
| Main Ratios | ||||||
| Current | 54.93 | 3.47 | 4.19 | 3.81 | 3.94 | 1.65 |
| Quick | 54.93 | 3.47 | 4.19 | 3.81 | 3.94 | 1.32 |
| Total Debt to Total Assets | 31.71% | 34.72% | 27.34% | 27.93% | 26.10% | 65.98% |
| Pre-tax Return on Net Worth | 6.47% | 110.18% | 140.91% | 162.69% | 156.41% | 0.78% |
| Pre-tax Return on Assets | 4.42% | 71.92% | 102.39% | 117.26% | 115.59% | 2.29% |
| Additional Ratios | Year 1 | Year 2 | Year 3 | Year 4 | Year 5 | |
| Net Profit Margin | 2.19% | 12.12% | 19.08% | 19.70% | 20.01% | n.a |
| Return on Equity | 4.33% | 73.82% | 94.41% | 109.00% | 104.80% | n.a |
| Activity Ratios | ||||||
| Accounts Receivable Turnover | 502.88 | 502.88 | 502.88 | 502.88 | 502.88 | n.a |
| Collection Days | 60 | 8 | 1 | 1 | 1 | n.a |
| Accounts Payable Turnover | 62.61 | 12.17 | 12.17 | 12.17 | 12.17 | n.a |
| Payment Days | 31 | 15 | 27 | 23 | 23 | n.a |
| Total Asset Turnover | 1.35 | 3.98 | 3.60 | 3.99 | 3.87 | n.a |
| Debt Ratios | ||||||
| Debt to Net Worth | 0.46 | 0.53 | 0.38 | 0.39 | 0.35 | n.a |
| Current Liab. to Liab. | 0.05 | 0.81 | 0.86 | 0.93 | 0.97 | n.a |
| Liquidity Ratios | ||||||
| Net Working Capital | $2,549,599 | $8,187,299 | $13,347,010 | $23,134,547 | $46,150,983 | n.a |
| Interest Coverage | 2.52 | 0.00 | 247.03 | 579.16 | 1,326.12 | n.a |
| Additional Ratios | ||||||
| Assets to Sales | 0.74 | 0.25 | 0.28 | 0.25 | 0.26 | n.a |
| Current Debt/Total Assets | 2% | 28% | 23% | 26% | 25% | n.a |
| Acid Test | 54.88 | 3.47 | 4.19 | 3.81 | 3.94 | n.a |
| Sales/Net Worth | 1.98 | 6.09 | 4.95 | 5.53 | 5.24 | n.a |
| Dividend Payout | 0.00 | 0.00 | 0.57 | 0.60 | 0.52 | n.a |
Appendix
| Sales Forecast | |||||||||||||
| Month 1 | Month 2 | Month 3 | Month 4 | Month 5 | Month 6 | Month 7 | Month 8 | Month 9 | Month 10 | Month 11 | Month 12 | ||
| Sales | |||||||||||||
| Consulting | 0% | $0 | $0 | $2,000 | $0 | $0 | $0 | $0 | $2,000 | $0 | $0 | $2,000 | $0 |
| Weigh Bridge Deposit | 0% | $0 | $0 | $0 | $0 | $500,000 | $0 | $500,000 | $0 | $0 | $0 | $0 | $0 |
| Weigh Bridge Balance | 0% | $2,000,000 | $0 | $0 | $0 | $0 | $0 | $0 | $0 | $500,000 | $0 | $500,000 | $0 |
| Total Sales | $2,000,000 | $0 | $2,000 | $0 | $500,000 | $0 | $500,000 | $2,000 | $500,000 | $0 | $502,000 | $0 | |
| Direct Cost of Sales | Month 1 | Month 2 | Month 3 | Month 4 | Month 5 | Month 6 | Month 7 | Month 8 | Month 9 | Month 10 | Month 11 | Month 12 | |
| Materials/Construction | 65% | $1,300,000 | $0 | $0 | $0 | $0 | $0 | $0 | $0 | $650,000 | $0 | $652,600 | $0 |
| Other | $0 | $0 | $0 | $0 | $0 | $0 | $0 | $0 | $0 | $0 | $0 | $0 | |
| Subtotal Direct Cost of Sales | $1,300,000 | $0 | $0 | $0 | $0 | $0 | $0 | $0 | $650,000 | $0 | $652,600 | $0 | |
| Personnel Plan | |||||||||||||
| Month 1 | Month 2 | Month 3 | Month 4 | Month 5 | Month 6 | Month 7 | Month 8 | Month 9 | Month 10 | Month 11 | Month 12 | ||
| Chief Executive Officer | 0% | $16,666 | $16,666 | $16,666 | $16,666 | $16,666 | $16,666 | $16,666 | $16,666 | $16,666 | $16,666 | $16,666 | $16,666 |
| Technical Director | 0% | $12,500 | $12,500 | $12,500 | $12,500 | $12,500 | $12,500 | $12,500 | $12,500 | $12,500 | $12,500 | $12,500 | $12,500 |
| Project Director | 0% | $10,000 | $10,000 | $10,000 | $10,000 | $10,000 | $10,000 | $10,000 | $10,000 | $10,000 | $12,500 | $12,500 | $12,500 |
| Office Manager/PA to CEO | 0% | $6,250 | $6,250 | $6,250 | $6,250 | $6,250 | $6,250 | $6,250 | $6,250 | $6,250 | $6,250 | $6,250 | $6,250 |
| Legal Services Director | 0% | $10,000 | $10,000 | $10,000 | $10,000 | $10,000 | $10,000 | $10,000 | $10,000 | $10,000 | $10,000 | $10,000 | $10,000 |
| Software Engineer | 0% | $8,333 | $8,333 | $8,333 | $8,333 | $8,333 | $8,333 | $8,333 | $8,333 | $8,333 | $8,333 | $8,333 | $8,333 |
| Corporate Services | 0% | $12,500 | $12,500 | $12,500 | $12,500 | $12,500 | $12,500 | $12,500 | $12,500 | $12,500 | $12,500 | $12,500 | $12,500 |
| Total People | 3 | 3 | 3 | 3 | 3 | 6 | 6 | 6 | 6 | 6 | 6 | 9 | |
| Total Payroll | $76,249 | $76,249 | $76,249 | $76,249 | $76,249 | $76,249 | $76,249 | $76,249 | $76,249 | $78,749 | $78,749 | $78,749 | |
| General Assumptions | |||||||||||||
| Month 1 | Month 2 | Month 3 | Month 4 | Month 5 | Month 6 | Month 7 | Month 8 | Month 9 | Month 10 | Month 11 | Month 12 | ||
| Plan Month | 1 | 2 | 3 | 4 | 5 | 6 | 7 | 8 | 9 | 10 | 11 | 12 | |
| Current Interest Rate | 10.00% | 10.00% | 10.00% | 10.00% | 10.00% | 10.00% | 10.00% | 10.00% | 10.00% | 10.00% | 10.00% | 10.00% | |
| Long-term Interest Rate | 10.00% | 10.00% | 10.00% | 10.00% | 10.00% | 10.00% | 10.00% | 10.00% | 10.00% | 10.00% | 10.00% | 0.00% | |
| Tax Rate | 33.00% | 33.00% | 33.00% | 33.00% | 33.00% | 33.00% | 33.00% | 33.00% | 33.00% | 33.00% | 33.00% | 33.00% | |
| Sales Tax | 9 | 9 | 9 | 9 | 9 | 9 | 9 | 9 | 9 | 9 | 9 | 9 | |
| Pro Forma Profit and Loss | |||||||||||||
| Month 1 | Month 2 | Month 3 | Month 4 | Month 5 | Month 6 | Month 7 | Month 8 | Month 9 | Month 10 | Month 11 | Month 12 | ||
| Sales | $2,000,000 | $0 | $2,000 | $0 | $500,000 | $0 | $500,000 | $2,000 | $500,000 | $0 | $502,000 | $0 | |
| Direct Cost of Sales | $1,300,000 | $0 | $0 | $0 | $0 | $0 | $0 | $0 | $650,000 | $0 | $652,600 | $0 | |
| Manufacturing costs | $16,000 | $16,000 | $16,000 | $16,000 | $16,000 | $16,000 | $16,000 | $16,000 | $16,000 | $16,000 | $16,000 | $16,000 | |
| Total Cost of Sales | $1,316,000 | $16,000 | $16,000 | $16,000 | $16,000 | $16,000 | $16,000 | $16,000 | $666,000 | $16,000 | $668,600 | $16,000 | |
| Gross Margin | $684,000 | ($16,000) | ($14,000) | ($16,000) | $484,000 | ($16,000) | $484,000 | ($14,000) | ($166,000) | ($16,000) | ($166,600) | ($16,000) | |
| Gross Margin % | 34.20% | 0.00% | -700.00% | 0.00% | 96.80% | 0.00% | 96.80% | -700.00% | -33.20% | 0.00% | -33.19% | 0.00% | |
| Expenses | |||||||||||||
| Payroll | $76,249 | $76,249 | $76,249 | $76,249 | $76,249 | $76,249 | $76,249 | $76,249 | $76,249 | $78,749 | $78,749 | $78,749 | |
| Sales and Marketing and Other Expenses | $1,700 | $1,700 | $1,700 | $1,700 | $1,700 | $1,700 | $1,700 | $1,700 | $1,700 | $1,700 | $1,700 | $1,700 | |
| Depreciation | $3,000 | $3,000 | $3,000 | $3,000 | $3,000 | $3,000 | $3,000 | $3,000 | $3,000 | $3,000 | $3,000 | $3,000 | |
| Leased Equipment | $417 | $417 | $417 | $417 | $417 | $417 | $417 | $417 | $417 | $417 | $417 | $417 | |
| Rent and Utilities | $0 | $0 | $0 | $0 | $0 | $1,500 | $1,500 | $1,500 | $1,500 | $1,500 | $1,500 | $1,500 | |
| Payroll Taxes | 25% | $0 | $0 | $0 | $0 | $0 | $0 | $0 | $0 | $0 | $0 | $0 | $0 |
| Other | $0 | $0 | $0 | $0 | $0 | $0 | $0 | $0 | $0 | $0 | $0 | $0 | |
| Total Operating Expenses | $81,366 | $81,366 | $81,366 | $81,366 | $81,366 | $82,866 | $82,866 | $82,866 | $82,866 | $85,366 | $85,366 | $85,366 | |
| Profit Before Interest and Taxes | $602,634 | ($97,366) | ($95,366) | ($97,366) | $402,634 | ($98,866) | $401,134 | ($96,866) | ($248,866) | ($101,366) | ($251,966) | ($101,366) | |
| EBITDA | $605,634 | ($94,366) | ($92,366) | ($94,366) | $405,634 | ($95,866) | $404,134 | ($93,866) | ($245,866) | ($98,366) | ($248,966) | ($98,366) | |
| Interest Expense | $8,186 | $8,117 | $8,048 | $7,980 | $7,911 | $7,842 | $7,773 | $7,705 | $7,636 | $7,567 | $7,498 | $0 | |
| Taxes Incurred | $196,168 | ($34,809) | ($34,127) | ($34,764) | $130,259 | ($35,214) | $129,809 | ($34,508) | ($84,646) | ($35,948) | ($85,623) | ($33,451) | |
| Net Profit | $398,280 | ($70,674) | ($69,288) | ($70,582) | $264,465 | ($71,494) | $263,552 | ($70,062) | ($171,856) | ($72,985) | ($173,841) | ($67,915) | |
| Net Profit/Sales | 19.91% | 0.00% | -3464.38% | 0.00% | 52.89% | 0.00% | 52.71% | -3503.11% | -34.37% | 0.00% | -34.63% | 0.00% | |
| Pro Forma Cash Flow | |||||||||||||
| Month 1 | Month 2 | Month 3 | Month 4 | Month 5 | Month 6 | Month 7 | Month 8 | Month 9 | Month 10 | Month 11 | Month 12 | ||
| Cash Received | |||||||||||||
| Cash from Operations | |||||||||||||
| Cash Sales | $1,000,000 | $0 | $0 | $0 | $500,000 | $0 | $500,000 | $0 | $500,000 | $0 | $500,000 | $0 | |
| Cash from Receivables | $0 | $33,333 | $966,667 | $0 | $2,000 | $0 | $0 | $0 | $0 | $2,000 | $0 | $0 | |
| Subtotal Cash from Operations | $1,000,000 | $33,333 | $966,667 | $0 | $502,000 | $0 | $500,000 | $0 | $500,000 | $2,000 | $500,000 | $0 | |
| Additional Cash Received | |||||||||||||
| Sales Tax, VAT, HST/GST Received | 0.00% | $0 | $0 | $0 | $0 | $0 | $0 | $0 | $0 | $0 | $0 | $0 | $0 |
| New Current Borrowing | $0 | $0 | $0 | $0 | $0 | $0 | $0 | $0 | $0 | $0 | $0 | $0 | |
| New Other Liabilities (interest-free) | $0 | $0 | $0 | $0 | $0 | $0 | $0 | $0 | $0 | $0 | $0 | $0 | |
| New Long-term Liabilities | $0 | $0 | $0 | $0 | $0 | $0 | $0 | $0 | $0 | $0 | $0 | $0 | |
| Sales of Other Current Assets | $0 | $0 | $0 | $0 | $0 | $0 | $0 | $0 | $0 | $0 | $0 | $0 | |
| Sales of Long-term Assets | $0 | $0 | $0 | $0 | $0 | $0 | $0 | $0 | $0 | $0 | $0 | $0 | |
| New Investment Received | $0 | $0 | $0 | $0 | $0 | $0 | $0 | $0 | $0 | $0 | $0 | $0 | |
| Subtotal Cash Received | $1,000,000 | $33,333 | $966,667 | $0 | $502,000 | $0 | $500,000 | $0 | $500,000 | $2,000 | $500,000 | $0 | |
| Expenditures | Month 1 | Month 2 | Month 3 | Month 4 | Month 5 | Month 6 | Month 7 | Month 8 | Month 9 | Month 10 | Month 11 | Month 12 | |
| Expenditures from Operations | |||||||||||||
| Cash Spending | $76,249 | $76,249 | $76,249 | $76,249 | $76,249 | $76,249 | $76,249 | $76,249 | $76,249 | $78,749 | $78,749 | $78,749 | |
| Bill Payments | $75,749 | $1,463,146 | ($16,251) | ($16,363) | ($3,169) | $143,322 | ($2,256) | $144,773 | $12,806 | $564,090 | $11,331 | $560,455 | |
| Subtotal Spent on Operations | $151,998 | $1,539,395 | $59,998 | $59,886 | $73,080 | $219,571 | $73,993 | $221,022 | $89,055 | $642,839 | $90,080 | $639,204 | |
| Additional Cash Spent | |||||||||||||
| Sales Tax, VAT, HST/GST Paid Out | $0 | $0 | $0 | $0 | $0 | $0 | $0 | $0 | $0 | $0 | $0 | $0 | |
| Principal Repayment of Current Borrowing | $0 | $0 | $0 | $0 | $0 | $0 | $0 | $0 | $0 | $0 | $0 | $0 | |
| Other Liabilities Principal Repayment | $0 | $0 | $0 | $0 | $0 | $0 | $0 | $0 | $0 | $0 | $0 | $0 | |
| Long-term Liabilities Principal Repayment | $8,250 | $8,250 | $8,250 | $8,250 | $8,250 | $8,250 | $8,250 | $8,250 | $8,250 | $8,250 | $8,250 | $8,250 | |
| Purchase Other Current Assets | $0 | $0 | $0 | $0 | $0 | $0 | $0 | $0 | $0 | $0 | $0 | $0 | |
| Purchase Long-term Assets | $0 | $0 | $0 | $0 | $0 | $0 | $0 | $0 | $0 | $0 | $0 | $0 | |
| Dividends | $0 | $0 | $0 | $0 | $0 | $0 | $0 | $0 | $0 | $0 | $0 | $0 | |
| Subtotal Cash Spent | $160,248 | $1,547,645 | $68,248 | $68,136 | $81,330 | $227,821 | $82,243 | $229,272 | $97,305 | $651,089 | $98,330 | $647,454 | |
| Net Cash Flow | $839,752 | ($1,514,312) | $898,419 | ($68,136) | $420,670 | ($227,821) | $417,757 | ($229,272) | $402,695 | ($649,089) | $401,669 | ($647,454) | |
| Cash Balance | $3,139,752 | $1,625,440 | $2,523,858 | $2,455,723 | $2,876,393 | $2,648,572 | $3,066,329 | $2,837,057 | $3,239,752 | $2,590,663 | $2,992,332 | $2,344,878 | |
| Pro Forma Balance Sheet | |||||||||||||
| Month 1 | Month 2 | Month 3 | Month 4 | Month 5 | Month 6 | Month 7 | Month 8 | Month 9 | Month 10 | Month 11 | Month 12 | ||
| Assets | Starting Balances | ||||||||||||
| Current Assets | |||||||||||||
| Cash | $2,300,000 | $3,139,752 | $1,625,440 | $2,523,858 | $2,455,723 | $2,876,393 | $2,648,572 | $3,066,329 | $2,837,057 | $3,239,752 | $2,590,663 | $2,992,332 | $2,344,878 |
| Accounts Receivable | $0 | $1,000,000 | $966,667 | $2,000 | $2,000 | $0 | $0 | $0 | $2,000 | $2,000 | $0 | $2,000 | $2,000 |
| Other Current Assets | $250,000 | $250,000 | $250,000 | $250,000 | $250,000 | $250,000 | $250,000 | $250,000 | $250,000 | $250,000 | $250,000 | $250,000 | $250,000 |
| Total Current Assets | $2,550,000 | $4,389,752 | $2,842,107 | $2,775,858 | $2,707,723 | $3,126,393 | $2,898,572 | $3,316,329 | $3,089,057 | $3,491,752 | $2,840,663 | $3,244,332 | $2,596,878 |
| Long-term Assets | |||||||||||||
| Long-term Assets | $400,000 | $400,000 | $400,000 | $400,000 | $400,000 | $400,000 | $400,000 | $400,000 | $400,000 | $400,000 | $400,000 | $400,000 | $400,000 |
| Accumulated Depreciation | $0 | $3,000 | $6,000 | $9,000 | $12,000 | $15,000 | $18,000 | $21,000 | $24,000 | $27,000 | $30,000 | $33,000 | $36,000 |
| Total Long-term Assets | $400,000 | $397,000 | $394,000 | $391,000 | $388,000 | $385,000 | $382,000 | $379,000 | $376,000 | $373,000 | $370,000 | $367,000 | $364,000 |
| Total Assets | $2,950,000 | $4,786,752 | $3,236,107 | $3,166,858 | $3,095,723 | $3,511,393 | $3,280,572 | $3,695,329 | $3,465,057 | $3,864,752 | $3,210,663 | $3,611,332 | $2,960,878 |
| Liabilities and Capital | Month 1 | Month 2 | Month 3 | Month 4 | Month 5 | Month 6 | Month 7 | Month 8 | Month 9 | Month 10 | Month 11 | Month 12 | |
| Current Liabilities | |||||||||||||
| Accounts Payable | $25,000 | $1,471,722 | $0 | $8,289 | $15,986 | $175,441 | $24,364 | $183,820 | $31,860 | $611,661 | $38,807 | $621,568 | $47,279 |
| Current Borrowing | $0 | $0 | $0 | $0 | $0 | $0 | $0 | $0 | $0 | $0 | $0 | $0 | $0 |
| Other Current Liabilities | $0 | $0 | $0 | $0 | $0 | $0 | $0 | $0 | $0 | $0 | $0 | $0 | $0 |
| Subtotal Current Liabilities | $25,000 | $1,471,722 | $0 | $8,289 | $15,986 | $175,441 | $24,364 | $183,820 | $31,860 | $611,661 | $38,807 | $621,568 | $47,279 |
| Long-term Liabilities | $990,550 | $982,300 | $974,050 | $965,800 | $957,550 | $949,300 | $941,050 | $932,800 | $924,550 | $916,300 | $908,050 | $899,800 | $891,550 |
| Total Liabilities | $1,015,550 | $2,454,022 | $974,050 | $974,089 | $973,536 | $1,124,741 | $965,414 | $1,116,620 | $956,410 | $1,527,961 | $946,857 | $1,521,368 | $938,829 |
| Paid-in Capital | $2,000,000 | $2,000,000 | $2,000,000 | $2,000,000 | $2,000,000 | $2,000,000 | $2,000,000 | $2,000,000 | $2,000,000 | $2,000,000 | $2,000,000 | $2,000,000 | $2,000,000 |
| Retained Earnings | ($65,550) | ($65,550) | ($65,550) | ($65,550) | ($65,550) | ($65,550) | ($65,550) | ($65,550) | ($65,550) | ($65,550) | ($65,550) | ($65,550) | ($65,550) |
| Earnings | $0 | $398,280 | $327,607 | $258,319 | $187,737 | $452,202 | $380,708 | $644,259 | $574,197 | $402,341 | $329,356 | $155,514 | $87,599 |
| Total Capital | $1,934,450 | $2,332,730 | $2,262,057 | $2,192,769 | $2,122,187 | $2,386,652 | $2,315,158 | $2,578,709 | $2,508,647 | $2,336,791 | $2,263,806 | $2,089,964 | $2,022,049 |
| Total Liabilities and Capital | $2,950,000 | $4,786,752 | $3,236,107 | $3,166,858 | $3,095,723 | $3,511,393 | $3,280,572 | $3,695,329 | $3,465,057 | $3,864,752 | $3,210,663 | $3,611,332 | $2,960,878 |
| Net Worth | $1,934,450 | $2,332,730 | $2,262,057 | $2,192,769 | $2,122,187 | $2,386,652 | $2,315,158 | $2,578,709 | $2,508,647 | $2,336,791 | $2,263,806 | $2,089,964 | $2,022,049 |

