
Lansing Aviation
Executive Summary
Introduction
Lansing Aviation is being formed as a private company offering services to student pilots. Lansing Aviation will offer well-maintained aircraft for individual rental and for flight training. Lansing Aviation will also provide primary and advanced flight instruction through the use of independent flight instructors possessing corporate and airline backgrounds. Lansing Aviation will offer professional aviation consulting for corporate, airline, and individual aviation needs.
The Company
Lansing Aviation, LLC has been created and legally organized as a Michigan Limited Liability Company based in Lansing, Michigan. The principle investors and operators will be responsible for all airplane acquisitions and company decisions.
Lansing Aviation will operate its aircraft out of Capital City Airport (LAN) in Lansing, Michigan. The aircraft records, scheduling, and office will be located at an off-airport location 15 miles north of Capital City Airport.
Services
Lansing Aviation offers services in three primary areas; aircraft rental, flight instruction, and aviation consulting. In order to do so, Lansing Aviation will maintain a Cessna 172 Skyhawk updated with the latest avionics.
Our competitive differences include professionally maintained aircraft, renter/instructor insurance, and our 24-hour scheduling service that will allow greater flexibility of our aircraft flight times.
In the future, Lansing Aviation plans to enhance their aircraft rental position by acquiring complex, high-performance, single and multi-engine aircraft for commercial and airline transport pilot training and rental. We also plan to conduct up-to-the-minute aircraft scheduling through the use of the Internet and an online business website.
The Market
The airline pilot shortage has created an immense demand for increased pilot training. The previous aircraft rental company in Lansing ended up needing additional aircraft to meet the increased demands of new students in the area. Mackinac-Great Lakes Airlines Systems is the largest employer in Lansing, with 19,000 employees, and we feel that these employees are aware of the excellent careers held by M-GLAS pilots. We hope this awareness will generate interest in flying. Additionally, many M-GLAS pilots and M-GLAS mechanics fly small airplanes for fun and to transport their families to vacation spots.
There are several students currently flying at Capital City Airport that are unhappy with either the quality of their current instruction or the poorly maintained aircraft they are renting. A flight with our instructors in our well-equipped Cessna 172 Skyhawk will confirm their displeasure with our competition and generate new business for us.
Lansing Aviation will be focusing initially on students interested in obtaining their private pilot certificate. These students will primarily come from word-of-mouth-advertising from our instructors, students, and other contacts at Mackinac-Great Lakes Airlines System (M-GLAS). We will attempt to continue teaching these students through their instrument rating course with us, upon completion of their private pilot package.

1.1 Objectives
- Form a Limited Liability Corporation (LLC) for liability protection of personal and company assets.
- Acquire a Cessna 172 Skyhawk aircraft for rental and flight instruction.
- Operate the aircraft for at least 50 revenue flight hours per month.
- Aircraft revenue to exceed hangar, insurance, fuel, maintenance upkeep and loan expenses resulting in a net income/profit.
1.2 Keys to Success
- A 24-hour aircraft schedule will provide students and renters with better schedule planning.
- Marketing the aircraft to the 2,100 Mackinac-Great Lakes Airlines System airline pilots, their familes, friends, and neighbors in Lansing to generate more exposure and word-of-mouth advertising resulting in more revenue flights.
- Preventative aircraft maintenance to eliminate aircraft downtime.
- Thorough and safe training of students and selective aircraft checkouts for rental customers to insure the aircraft is operated carefully, safely, and respectfully.
1.3 Mission
Lansing Aviation offers an affordable, professionally-maintained aircraft for rental and flight instruction. We will provide a safe and effective learning situation for our students while adhering to safe practice and to applicable federal and state aviation regulations. Lansing Aviation will provide students with an excellent aircraft for flight training and an aircraft to fly upon successful completion of their training.
Company Summary
Lansing Aviation is a new company that provides aircraft rental for general aviation enthusiasts, flight instruction, and a dependable aircraft to build flight hours. We will focus on aircraft rental for registered pilots and rental for beginning and advanced flight training. Initially we will be marketing our new business with aircraft specifications which include:
- Clean, safe, and nice-looking aircraft readily available.
- Professionally maintained by certified aviation technicians.
- Continuously updated with leading-edge avionics.
2.1 Company Ownership
Lansing Aviation, LLC has been created and legally organized as a Michigan Limited Liability Company based in Lansing, Michigan. The principle investors and operators will be responsible for all airplane acquisitions and company decisions.
2.2 Start-up Summary
The start-up costs of Lansing Aviation, LLC include:
- An aircraft down payment.
- Office expenses.
- Down payment on aircraft renter’s and flight instructor’s insurance.
- Hangar deposit and first month’s rent.
- Aircraft loan application fees.
- ADF radio purchase.
- A small cash reserve.
- Legal costs.
These are detailed on the following chart and table.

| Start-up | |
| Requirements | |
| Start-up Expenses | |
| Legal — Attorney Fees | $400 |
| Office Supplies / Expenses | $200 |
| Consultants | $0 |
| Aircraft Insurance Down Payment | $925 |
| Expensed Equipment | $0 |
| Hanger Down Payment + 1st Mo. Rent | $600 |
| New ADF Radio | $575 |
| Aircraft 10% Down Payment | $3,600 |
| MBNA Loan Origination Fee | $250 |
| Total Start-up Expenses | $6,550 |
| Start-up Assets | |
| Cash Required | $300 |
| Other Current Assets | $0 |
| Long-term Assets | $36,000 |
| Total Assets | $36,300 |
| Total Requirements | $42,850 |
| Start-up Funding | |
| Start-up Expenses to Fund | $6,550 |
| Start-up Assets to Fund | $36,300 |
| Total Funding Required | $42,850 |
| Assets | |
| Non-cash Assets from Start-up | $36,000 |
| Cash Requirements from Start-up | $300 |
| Additional Cash Raised | $0 |
| Cash Balance on Starting Date | $300 |
| Total Assets | $36,300 |
| Liabilities and Capital | |
| Liabilities | |
| Current Borrowing | $0 |
| Long-term Liabilities | $32,400 |
| Accounts Payable (Outstanding Bills) | $0 |
| Other Current Liabilities (interest-free) | $0 |
| Total Liabilities | $32,400 |
| Capital | |
| Planned Investment | |
| Michael J. Zorn – president | $10,450 |
| Investor | $0 |
| Other | $0 |
| Additional Investment Requirement | $0 |
| Total Planned Investment | $10,450 |
| Loss at Start-up (Start-up Expenses) | ($6,550) |
| Total Capital | $3,900 |
| Total Capital and Liabilities | $36,300 |
| Total Funding | $42,850 |
2.3 Company Locations and Facilities
Lansing Aviation will operate its aircraft out of Capital City Airport (LAN) in Lansing, Michigan. The aircraft will be hangared on the airport located just north of the I-96 Expressway and Airport Road exit. Students, renters, and instructors will be given full access to the hangar facilities. The aircraft records, scheduling, and office will be located at an off-airport location 15 miles north of Capital City Airport.
Services
Lansing Aviation will provide students, instructors, and pilots with a well-maintained aircraft for individual rental and instruction. Additionally, we will provide professional and accurate aviation consulting.
3.1 Service Description
- Aircraft Rental: We will offer a rental aircraft clear of maintenance discrepancies to students, instructors, and individual renters.
- Flight Instruction: We will provide prospective students with a qualified and professional selection of independent, certified flight instructors capable of helping students obtain their desired flight ratings.
- Aviation Consulting: We will offer individual advice in the aviation industry including airline, corporate, and military recommendations. Additionally, we will attempt to aid our customers with job leads and references in their desired fields.
3.2 Competitive Comparison
The competitive differences are:
- Our aircraft will be professionally maintained to the highest standards and regulations. Flying the aircraft with broken, deferred, or damaged components will not be acceptable. Our students, renters, and instructors will not have to fly aircraft that aren’t properly maintained.
- We will provide renter and instructor insurance for our clients.
- Our 24-hour paging service will be used for aircraft scheduling and will give us a competitive edge over other aircraft rental and instruction operators that open and close according to a fixed schedule.
3.3 Sales Literature
The company will advertise its rental aircraft and flight instruction position in the Mackinac-Great Lakes Airlines System airlines pilot union newspaper, the “ALPA Times.” Additionally, brochures describing the aircraft and rental charges will also be positioned in the M-GLAS airlines’ union headquarters in Lansing, Michigan. All other initial advertising will be through word of mouth from current instructors, renters, and students.

3.4 Technology
Lansing Aviation will maintain an updated Cessna 172 Skyhawk.
- The aircraft will have at least two 720-channel radios for legal and practical navigation and communication purposes.
- The aircraft will have the required equipment and certification necessary to conduct instrument training and actual instrument flight.
- The aircraft will be continuously upgraded with M-GLAS Aviation Technology (M-GLAS-AT) avionics.
3.5 Future Services
In the future, Lansing Aviation will enhance their aircraft rental position by acquiring complex, high-performance, single and multi-engine aircraft for commercial and airline transport pilot training and rental.
We also hope to conduct up-to-the-minute aircraft scheduling through the use of the Internet and an online business website.
Market Analysis Summary
Lansing Aviation will be focusing initially on students interested in obtaining their private pilot certificate. These students will primarily come from word-of-mouth-advertising from our instructors, students, and other contacts at Mackinac-Great Lakes Airlines System. We will attempt to continue teaching these students through their instrument rating course with us, upon completion of their private pilot package.
We feel that our well-maintained aircraft, combined with our personable and enthusiastic flight instructors, will generate repeat business from our private pilot students returning for their instrument ratings.
4.1 Market Segmentation
- Unsatisfied Students: We hope to obtain students and renters that are dissatisfied with their current instructors or aircraft from our competition before they become so frustrated that they cease flying.
- M-GLAS Employees: Our largest group of new students will hopefully come from Mackinac-Great Lakes Airlines System employees looking to start an aviation career. However, the M-GLAS pilots, M-GLAS mechanics with pilots licenses, and their children will also serve as a strong target market for us.
- Curious Flyers: The unrealized group of students that have “always wanted to learn to fly” is another market segment that we intend to develop.
- Other Flights/Miscellaneous Rental: Sight-seeing flights, color tours, real-estate surveying, Air Force training, and traffic watch will also be targeted.

| Market Analysis | |||||||
| Year 1 | Year 2 | Year 3 | Year 4 | Year 5 | |||
| Potential Customers | Growth | CAGR | |||||
| Curious / Interested Future Pilots | 20% | 15 | 18 | 22 | 26 | 31 | 19.90% |
| M-GLAS Pilots, Friends, Neighbors | 30% | 10 | 13 | 17 | 22 | 29 | 30.50% |
| Other Schools Unhappy Students | 1% | 1 | 1 | 1 | 1 | 1 | 0.00% |
| Other Flights / Misc. Rentals | 15% | 5 | 6 | 7 | 8 | 9 | 15.83% |
| Total | 22.58% | 31 | 38 | 47 | 57 | 70 | 22.58% |
4.2 Target Market Segment Strategy
We will focus our marketing to prospective students that are looking for fun, qualified instructors and a well-maintained and well-equipped aircraft. The aircraft must fly several hours each month, so we will continuously urge interested students to call our list of qualified instructors. Each prospective pilot that contacts Lansing Aviation for information will be sent a private pilot price sheet with approximate costs and a free 6-month subscription to AOPA Flight Training magazine.
4.2.1 Market Trends
The airline shortage has created an immense demand for increased pilot training. The previous aircraft rental company in Lansing ended up needing additional aircraft to meet the increased demands of new students in the area.
There are rising numbers of students and renters that are looking for a professionally-maintained and well-equipped aircraft for training and renting.
4.2.2 Market Needs
There are several students currently flying at Capital City Airport that are unhappy with either the quality of their current instruction or the poorly maintained aircraft they are renting. A flight with our instructors in our well-equipped Cessna 172 Skyhawk will confirm their displeasure with our competition and generate new business for us.
Mackinac-Great Lakes Airlines Systems is the largest employer in Lansing, with 19,000 employees, and we feel that these employees are aware of the excellent careers held by M-GLAS pilots. We hope this awareness will generate interest in flying. Additionally, many M-GLAS pilots and M-GLAS mechanics fly small airplanes for fun and to transport their families to vacation spots.
4.2.3 Market Growth
The rental aircraft in the Lansing area are averaging over 50 hours of revenue flying per month. This indicates a very solid number of new students, additional ratings for current students, and more disposable income being used to obtain the long-time personal dream of obtaining a pilot’s license. Lugnut Flying Aviation, a flight school that ceased operation, was averaging over 70 hours of revenue flying per month and produced a net profit in the first year of operation.
4.3 Service Business Analysis
Our consulting will be a very valuable asset to people of the community who are interested in flying or choosing flying as a career. Many parents have questions regarding the “correct” path for their children with regard to a career as a pilot in the airline industry. These would include flight training, colleges and college curricula, and most importantly, costs. Our goal is to advise them of the best possible options to their questions, using our own personal experience.
4.3.1 Competition and Buying Patterns
In the flight instruction business, word-of-mouth advertising and personal marketing are the main reason that students choose one flight school over another. Many students begin flying after coincidentally meeting a certified flight instructor and discussing their dream of flying. Through these discussions, students participate in an introductory flight and decide whether or not they enjoyed the experience and whether or not the training will be affordable.
Occassionally, a student will have a personality conflict with his or her instructor and may choose to try a new instructor. We intend to capitalize on some of these unfortunate conflicts at Capital City Airport and attract their business with our professional, enthusiastic, and qualified instructor group.
Our reputation of maintaining a nice-looking and well-maintained aircraft at an affordable price will be our final and most respected selling medium.
4.3.2 Main Competitors
Spartan Wings:
Strengths: They have several different rental aircraft from which to choose, and excellent marketing in the field. Because of an all-female management team and ownership, their exposure to women in aviation is enormous.
Weaknesses: Their flight instructors are only instructing to build flight time in order to obtain an airline or corporate job. Male students have complained of special treatment and training for female students. Aircraft are not well-maintained, and the pilot-product of their school has not been strong.
Wolverine Aviation:
Strengths: They provide competition to Spartan Wings, which gives an alternative for unhappy students at Spartan Wings. They have several rental airplanes to choose from for instruction, and ample room for teaching.
Weaknesses: They have poor community exposure and advertising, poor reputation of flight instructors, and high aircraft rental rates.
4.3.3 Business Participants
There are currently two flight schools operating at Capital City Airport. These schools will be our competition; however, we will not be a “formal” flight school. Lansing Aviation will have several independent flight instructors that will bring in their own students and will work independently from Lansing Aviation, while renting our aircraft. All instructors from the defunct Lugnut Flying Aviation have verbally committed to bringing all of their business to Lansing Aviation upon its acquisition of an aircraft.
Strategy and Implementation Summary
Lansing Aviation will be focusing initially on students interested in obtaining their private pilot certificate. These students will primarily come from word-of-mouth-advertising from our instructors, students, and other contacts at Mackinac-Great Lakes Airlines System (M-GLAS). We will attempt to continue teaching these students through their instrument rating course with us, upon completion of their private pilot package.
In order to attract larger sums of money, we will offer a 10-hour block of aircraft rental for $730 ($73/hour) which is reduced from our normal rental rate of $75 per hour. Additionally, we will offer M-GLAS employees the same $73 per hour rate for block or non-block rentals.
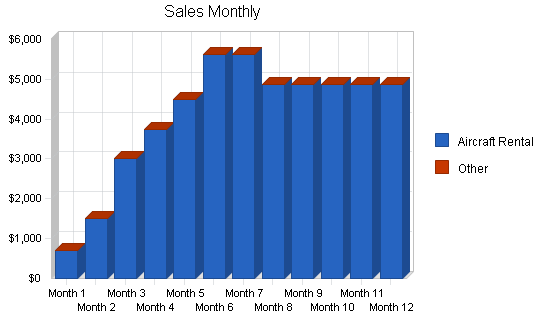
5.1 Sales Forecast
Our Sales Forecast tables shows our estimated aircraft rental revenue. This monthly breakdown can be seen in the appendix. Estimated operating expenses and other charges are listed in the Profit and Loss table.

| Sales Forecast | |||||
| Year 1 | Year 2 | Year 3 | Year 4 | Year 5 | |
| Sales | |||||
| Aircraft Rental | $49,068 | $54,007 | $55,392 | $50,776 | $60,931 |
| Other | $0 | $0 | $0 | $0 | $0 |
| Total Sales | $49,068 | $54,007 | $55,392 | $50,776 | $60,931 |
| Direct Cost of Sales | Year 1 | Year 2 | Year 3 | Year 4 | Year 5 |
| Aircraft Rental | $0 | $0 | $0 | $0 | $0 |
| Other | $0 | $0 | $0 | $0 | $0 |
| Subtotal Direct Cost of Sales | $0 | $0 | $0 | $0 | $0 |
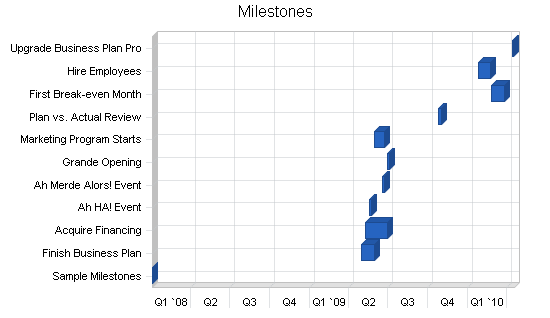
5.2 Milestones
Sample Milestones topic text.
The milestones table and chart show the specific detail about actual program activities that should be taking place during the year. Each one has its manager, starting date, ending date, and budget. During the year we will be keeping track of implementation against plan, with reports on the timely completion of these activities as planned.
| Milestones | |||||
| Milestone | Start Date | End Date | Budget | Manager | Department |
| Sample Milestones | 1/4/2008 | 1/4/2008 | $0 | ABC | Department |
| Finish Business Plan | 4/29/2009 | 5/29/2009 | $100 | Dude | Boss |
| Acquire Financing | 5/9/2009 | 6/28/2009 | $200 | Dudette | Legumers |
| Ah HA! Event | 5/19/2009 | 5/24/2009 | $60 | Marianne | Bosses |
| Ah Merde Alors! Event | 6/18/2009 | 6/23/2009 | $250 | Marionette | Bouc émissaire |
| Grande Opening | 6/28/2009 | 7/3/2009 | $500 | Gloworm | Nobs |
| Marketing Program Starts | 5/29/2009 | 6/23/2009 | $1,000 | Glower | Marketeers |
| Plan vs. Actual Review | 10/24/2009 | 10/31/2009 | $0 | Galore | Alles |
| First Break-even Month | 2/25/2010 | 3/27/2010 | $0 | Bouys | Salers |
| Hire Employees | 1/24/2010 | 2/23/2010 | $150 | Gulls | HRM |
| Upgrade Business Plan Pro | 4/14/2010 | 4/16/2010 | $100 | Brass | Bossies |
| Totals | $2,360 | ||||
Management Summary
The initial organizer of Lansing Aviation, LLC is Michael J. Zorn. In order to maintain legal requirements of an LLC, there is one other member of the company. At the current time, there is only the need for two members in the organizational structure.
Lansing Aviation will rely on the member(s) of the LLC for decision making and financial investing when needed. The ultimate responsibilities of the entire LLC will be given to the member(s).
6.1 Management Team
Lansing Aviation is not departmentalized. The owner and organizer, Michael J. Zorn, is also the CEO, CFO, and planner. All decisions will be based upon the company mission statement.
The collegiate advertising and marketing background, combined with the current airline pilot experience of the CEO, will provide for timely, accurate, and professional decisions.
6.2 Personnel Plan
Lansing Aviation will employ no one. All flight instructors will be independent contractors responsible for their own payroll. The company will not collect any funds from the instructors for their time, but solely from the rental of the company’s aircraft. The owner will be paid a nominal stipend.
| Personnel Plan | |||||
| Year 1 | Year 2 | Year 3 | Year 4 | Year 5 | |
| Owner | $7,833 | $12,000 | $0 | $0 | $0 |
| Name or title | $0 | $0 | $0 | $0 | $0 |
| Name or title | $0 | $0 | $0 | $0 | $0 |
| Other | $0 | $0 | $0 | $0 | $0 |
| Total People | 0 | 0 | 0 | 0 | 0 |
| Total Payroll | $7,833 | $12,000 | $0 | $0 | $0 |
Financial Plan
- We want to finance our aircraft loan through cash flow from our aircraft rental.
- We want to pay for our engine overhaul at the recommended TBO through cash savings acquired during our aircraft rental.
- In order to attract larger sums of money, we will offer a 10-hour block of aircraft rental for $730 ($73/hour) which is reduced from our normal rental rate of $75 per hour. Additionally, we will offer M-GLAS employees the same $73 per hour rate for block or non-block rentals.
7.1 Important Assumptions
The financial plan depends on the number of revenue hours flown each month in our aircraft.
The most important assumptions crucial to our success are:
- The aircraft will maintain flying status other than routine, required inspections lasting a day or two.
- We will not have any major aircraft accidents or incidents that will result in major downtime.
- We also assume that student pilot starts will continue to increase and the demand for pilots will continue.
| General Assumptions | |||||
| Year 1 | Year 2 | Year 3 | Year 4 | Year 5 | |
| Plan Month | 1 | 2 | 3 | 4 | 5 |
| Current Interest Rate | 10.00% | 10.00% | 10.00% | 10.00% | 10.00% |
| Long-term Interest Rate | 10.00% | 10.00% | 10.00% | 10.00% | 10.00% |
| Tax Rate | 28.17% | 28.00% | 28.17% | 28.00% | 28.17% |
| Other | 0 | 0 | 0 | 0 | 0 |
7.2 Break-even Analysis
Breaking down our monthly fixed costs enables us to calculate how much the aircraft needs to be flown each month to maintain profitability. Our monthly fixed costs include:
- Hangar rental.
- Aircraft insurance.
- Engine overhaul fund.
- Aircraft loan payments.
- Routine aircraft maintenance and inspection costs.
- Estimated monthly fuel costs.
The following chart and table summarizes our break-even analysis.

| Break-even Analysis | |
| Monthly Revenue Break-even | $3,447 |
| Assumptions: | |
| Average Percent Variable Cost | 0% |
| Estimated Monthly Fixed Cost | $3,447 |
7.3 Projected Profit and Loss
With monthly fixed costs of hangar rent, renter and instructor insurance, an engine overhaul fund, aircraft loan, planned maintenance and inspections, and fuel, we can actively market our aircraft to obtain the correct number of students to exceed our expenses while making the aircraft convenient for the students to schedule for training and rental.
A loss is expected for the first few months while a student base is carefully chosen and constructed. We hope to increase our number of flight hours flown each month by 25% until the break-even point is reached. At that time, we will assess the number of students and the number of hours being flown to determine how many more students and renters we want to increase our profits and maintain good aircraft availability.
NOTE: You will notice in the year 2003 that the company is showing a net loss for the year. This is the year that we estimate the aircraft engine will require a factory overhaul. This expense ranges from $13,000 to $20,000, depending on several variables. Therefore, we have chosen to show an overhaul expense of $15,000 for that year. However, this was only shown to demonstrate the effect of not properly saving for the overhaul expense. We have allocated a certain percentage of each flight hour toward the engine overhaul savings fund which will cover all of our expenses, thus, hopefully returning Lansing Aviation to a net profit for 2003.


| Pro Forma Profit and Loss | |||||
| Year 1 | Year 2 | Year 3 | Year 4 | Year 5 | |
| Sales | $49,068 | $54,007 | $55,392 | $50,776 | $60,931 |
| Direct Cost of Sales | $0 | $0 | $0 | $0 | $0 |
| Other | $0 | $0 | $0 | $0 | $0 |
| Total Cost of Sales | $0 | $0 | $0 | $0 | $0 |
| Gross Margin | $49,068 | $54,007 | $55,392 | $50,776 | $60,931 |
| Gross Margin % | 100.00% | 100.00% | 100.00% | 100.00% | 100.00% |
| Expenses | |||||
| Payroll | $7,833 | $12,000 | $0 | $0 | $0 |
| Sales and Marketing and Other Expenses | $0 | $0 | $0 | $0 | $0 |
| Depreciation | $3,300 | $3,600 | $3,600 | $3,600 | $3,600 |
| Fixed Operations Costs | $27,530 | $27,530 | $27,530 | $27,530 | $27,530 |
| Leased Equipment | $0 | $0 | $0 | $0 | $0 |
| Utilities | $0 | $0 | $0 | $0 | $0 |
| Insurance | $0 | $0 | $0 | $0 | $0 |
| Payroll Taxes | $0 | $0 | $0 | $0 | $0 |
| Aircraft Upgrades | $1,500 | $0 | $0 | $0 | $0 |
| Mainenance and Repairs | $1,200 | $0 | $0 | $15,000 | $0 |
| Total Operating Expenses | $41,363 | $43,130 | $31,130 | $46,130 | $31,130 |
| Profit Before Interest and Taxes | $7,705 | $10,877 | $24,262 | $4,646 | $29,801 |
| EBITDA | $11,005 | $14,477 | $27,862 | $8,246 | $33,401 |
| Interest Expense | $3,188 | $2,791 | $2,413 | $2,035 | $1,657 |
| Taxes Incurred | $1,273 | $2,264 | $6,154 | $731 | $7,927 |
| Net Profit | $3,244 | $5,822 | $15,695 | $1,880 | $20,217 |
| Net Profit/Sales | 6.61% | 10.78% | 28.33% | 3.70% | 33.18% |
7.4 Projected Cash Flow
The following cash flow projections show the amounts anticipated from the first few months during the student accumulation period through the company’s rental saturation.
Cash flow is critical to our success, for payment of the insurance and aircraft loan payments as well as the fuel costs required to operate and the hangar to house the airplane.

| Pro Forma Cash Flow | |||||
| Year 1 | Year 2 | Year 3 | Year 4 | Year 5 | |
| Cash Received | |||||
| Cash from Operations | |||||
| Cash Sales | $49,068 | $54,007 | $55,392 | $50,776 | $60,931 |
| Subtotal Cash from Operations | $49,068 | $54,007 | $55,392 | $50,776 | $60,931 |
| Additional Cash Received | |||||
| Sales Tax, VAT, HST/GST Received | $0 | $0 | $0 | $0 | $0 |
| New Current Borrowing | $0 | $0 | $0 | $0 | $0 |
| New Other Liabilities (interest-free) | $0 | $0 | $0 | $0 | $0 |
| New Long-term Liabilities | $0 | $0 | $0 | $0 | $0 |
| Sales of Other Current Assets | $0 | $0 | $0 | $0 | $0 |
| Sales of Long-term Assets | $0 | $0 | $0 | $0 | $0 |
| New Investment Received | $0 | $0 | $0 | $0 | $0 |
| Subtotal Cash Received | $49,068 | $54,007 | $55,392 | $50,776 | $60,931 |
| Expenditures | Year 1 | Year 2 | Year 3 | Year 4 | Year 5 |
| Expenditures from Operations | |||||
| Cash Spending | $7,833 | $12,000 | $0 | $0 | $0 |
| Bill Payments | $31,725 | $32,873 | $35,808 | $44,540 | $37,787 |
| Subtotal Spent on Operations | $39,558 | $44,873 | $35,808 | $44,540 | $37,787 |
| Additional Cash Spent | |||||
| Sales Tax, VAT, HST/GST Paid Out | $0 | $0 | $0 | $0 | $0 |
| Principal Repayment of Current Borrowing | $0 | $0 | $0 | $0 | $0 |
| Other Liabilities Principal Repayment | $0 | $0 | $0 | $0 | $0 |
| Long-term Liabilities Principal Repayment | $2,600 | $3,780 | $3,780 | $3,780 | $3,780 |
| Purchase Other Current Assets | $0 | $0 | $0 | $0 | $0 |
| Purchase Long-term Assets | $0 | $0 | $0 | $0 | $0 |
| Dividends | $0 | $0 | $0 | $0 | $0 |
| Subtotal Cash Spent | $42,158 | $48,653 | $39,588 | $48,320 | $41,567 |
| Net Cash Flow | $6,910 | $5,354 | $15,804 | $2,456 | $19,364 |
| Cash Balance | $7,210 | $12,564 | $28,367 | $30,823 | $50,188 |
7.5 Projected Balance Sheet
The balance sheet in the following table shows some very important information regarding our short-term and long-term financial goals.
| Pro Forma Balance Sheet | |||||
| Year 1 | Year 2 | Year 3 | Year 4 | Year 5 | |
| Assets | |||||
| Current Assets | |||||
| Cash | $7,210 | $12,564 | $28,367 | $30,823 | $50,188 |
| Other Current Assets | $0 | $0 | $0 | $0 | $0 |
| Total Current Assets | $7,210 | $12,564 | $28,367 | $30,823 | $50,188 |
| Long-term Assets | |||||
| Long-term Assets | $36,000 | $36,000 | $36,000 | $36,000 | $36,000 |
| Accumulated Depreciation | $3,300 | $6,900 | $10,500 | $14,100 | $17,700 |
| Total Long-term Assets | $32,700 | $29,100 | $25,500 | $21,900 | $18,300 |
| Total Assets | $39,910 | $41,664 | $53,867 | $52,723 | $68,488 |
| Liabilities and Capital | Year 1 | Year 2 | Year 3 | Year 4 | Year 5 |
| Current Liabilities | |||||
| Accounts Payable | $2,966 | $2,678 | $2,967 | $3,723 | $3,050 |
| Current Borrowing | $0 | $0 | $0 | $0 | $0 |
| Other Current Liabilities | $0 | $0 | $0 | $0 | $0 |
| Subtotal Current Liabilities | $2,966 | $2,678 | $2,967 | $3,723 | $3,050 |
| Long-term Liabilities | $29,800 | $26,020 | $22,240 | $18,460 | $14,680 |
| Total Liabilities | $32,766 | $28,698 | $25,207 | $22,183 | $17,730 |
| Paid-in Capital | $10,450 | $10,450 | $10,450 | $10,450 | $10,450 |
| Retained Earnings | ($6,550) | ($3,306) | $2,515 | $18,210 | $20,090 |
| Earnings | $3,244 | $5,822 | $15,695 | $1,880 | $20,217 |
| Total Capital | $7,144 | $12,965 | $28,660 | $30,540 | $50,757 |
| Total Liabilities and Capital | $39,910 | $41,664 | $53,867 | $52,723 | $68,488 |
| Net Worth | $7,144 | $12,965 | $28,660 | $30,540 | $50,757 |
7.6 Business Ratios
We expect to see flat ratios of profitability during the first year while we build our customer base. We expect these ratios to improve in the second and succeeding years. The following table shows the projected ratios for Lansing Aviation. The Industry Profile comes from Standard Industry Code #8299, Schools and Educational Services.
| Ratio Analysis | ||||||
| Year 1 | Year 2 | Year 3 | Year 4 | Year 5 | Industry Profile | |
| Sales Growth | 0.00% | 10.07% | 2.56% | -8.33% | 20.00% | 9.50% |
| Percent of Total Assets | ||||||
| Other Current Assets | 0.00% | 0.00% | 0.00% | 0.00% | 0.00% | 45.60% |
| Total Current Assets | 18.06% | 30.16% | 52.66% | 58.46% | 73.28% | 62.40% |
| Long-term Assets | 81.94% | 69.84% | 47.34% | 41.54% | 26.72% | 37.60% |
| Total Assets | 100.00% | 100.00% | 100.00% | 100.00% | 100.00% | 100.00% |
| Current Liabilities | 7.43% | 6.43% | 5.51% | 7.06% | 4.45% | 43.30% |
| Long-term Liabilities | 74.67% | 62.45% | 41.29% | 35.01% | 21.43% | 17.30% |
| Total Liabilities | 82.10% | 68.88% | 46.79% | 42.07% | 25.89% | 60.60% |
| Net Worth | 17.90% | 31.12% | 53.21% | 57.93% | 74.11% | 39.40% |
| Percent of Sales | ||||||
| Sales | 100.00% | 100.00% | 100.00% | 100.00% | 100.00% | 100.00% |
| Gross Margin | 100.00% | 100.00% | 100.00% | 100.00% | 100.00% | 0.00% |
| Selling, General & Administrative Expenses | 81.12% | 75.41% | 73.39% | 102.00% | 72.25% | 73.80% |
| Advertising Expenses | 60.14% | 58.82% | 57.35% | 62.57% | 57.35% | 5.00% |
| Profit Before Interest and Taxes | 15.70% | 20.14% | 43.80% | 9.15% | 48.91% | 3.20% |
| Main Ratios | ||||||
| Current | 2.43 | 4.69 | 9.56 | 8.28 | 16.45 | 1.33 |
| Quick | 2.43 | 4.69 | 9.56 | 8.28 | 16.45 | 1.11 |
| Total Debt to Total Assets | 82.10% | 68.88% | 46.79% | 42.07% | 25.89% | 60.60% |
| Pre-tax Return on Net Worth | 63.23% | 62.37% | 76.23% | 8.55% | 55.45% | 5.50% |
| Pre-tax Return on Assets | 11.32% | 19.41% | 40.56% | 4.95% | 41.09% | 14.00% |
| Additional Ratios | Year 1 | Year 2 | Year 3 | Year 4 | Year 5 | |
| Net Profit Margin | 6.61% | 10.78% | 28.33% | 3.70% | 33.18% | n.a |
| Return on Equity | 45.41% | 44.90% | 54.76% | 6.16% | 39.83% | n.a |
| Activity Ratios | ||||||
| Accounts Payable Turnover | 11.70 | 12.17 | 12.17 | 12.17 | 12.17 | n.a |
| Payment Days | 27 | 32 | 29 | 27 | 33 | n.a |
| Total Asset Turnover | 1.23 | 1.30 | 1.03 | 0.96 | 0.89 | n.a |
| Debt Ratios | ||||||
| Debt to Net Worth | 4.59 | 2.21 | 0.88 | 0.73 | 0.35 | n.a |
| Current Liab. to Liab. | 0.09 | 0.09 | 0.12 | 0.17 | 0.17 | n.a |
| Liquidity Ratios | ||||||
| Net Working Capital | $4,244 | $9,885 | $25,400 | $27,100 | $47,137 | n.a |
| Interest Coverage | 2.42 | 3.90 | 10.05 | 2.28 | 17.98 | n.a |
| Additional Ratios | ||||||
| Assets to Sales | 0.81 | 0.77 | 0.97 | 1.04 | 1.12 | n.a |
| Current Debt/Total Assets | 7% | 6% | 6% | 7% | 4% | n.a |
| Acid Test | 2.43 | 4.69 | 9.56 | 8.28 | 16.45 | n.a |
| Sales/Net Worth | 6.87 | 4.17 | 1.93 | 1.66 | 1.20 | n.a |
| Dividend Payout | 0.00 | 0.00 | 0.00 | 0.00 | 0.00 | n.a |
7.7 Long-term Plan
Our long-term plan is based primarily on the short-term future of the business. If the aircraft is able to support its expenses, then the future of Lansing Aviation and our long-term goal plan can be successfully accomplished.
Our long-term plan contains the following elements:
- Paying off the entire aircraft loan in the first three years of operation.
- Acquiring partial ownership of a twin-engine aircraft for training and travel needs.
- Avoiding accident, incident, and lawsuit through our entire longevity.
- Providing present and future students and renters with a superlative aircraft for all of their flying needs.
Appendix
| Sales Forecast | |||||||||||||
| Month 1 | Month 2 | Month 3 | Month 4 | Month 5 | Month 6 | Month 7 | Month 8 | Month 9 | Month 10 | Month 11 | Month 12 | ||
| Sales | |||||||||||||
| Aircraft Rental | 0% | $693 | $1,500 | $3,000 | $3,750 | $4,500 | $5,625 | $5,625 | $4,875 | $4,875 | $4,875 | $4,875 | $4,875 |
| Other | 0% | $0 | $0 | $0 | $0 | $0 | $0 | $0 | $0 | $0 | $0 | $0 | $0 |
| Total Sales | $693 | $1,500 | $3,000 | $3,750 | $4,500 | $5,625 | $5,625 | $4,875 | $4,875 | $4,875 | $4,875 | $4,875 | |
| Direct Cost of Sales | Month 1 | Month 2 | Month 3 | Month 4 | Month 5 | Month 6 | Month 7 | Month 8 | Month 9 | Month 10 | Month 11 | Month 12 | |
| Aircraft Rental | $0 | $0 | $0 | $0 | $0 | $0 | $0 | $0 | $0 | $0 | $0 | $0 | |
| Other | $0 | $0 | $0 | $0 | $0 | $0 | $0 | $0 | $0 | $0 | $0 | $0 | |
| Subtotal Direct Cost of Sales | $0 | $0 | $0 | $0 | $0 | $0 | $0 | $0 | $0 | $0 | $0 | $0 | |
| Personnel Plan | |||||||||||||
| Month 1 | Month 2 | Month 3 | Month 4 | Month 5 | Month 6 | Month 7 | Month 8 | Month 9 | Month 10 | Month 11 | Month 12 | ||
| Owner | 0% | $0 | $0 | $0 | $0 | $833 | $1,000 | $1,000 | $1,000 | $1,000 | $1,000 | $1,000 | $1,000 |
| Name or title | 0% | $0 | $0 | $0 | $0 | $0 | $0 | $0 | $0 | $0 | $0 | $0 | $0 |
| Name or title | 0% | $0 | $0 | $0 | $0 | $0 | $0 | $0 | $0 | $0 | $0 | $0 | $0 |
| Other | 0% | $0 | $0 | $0 | $0 | $0 | $0 | $0 | $0 | $0 | $0 | $0 | $0 |
| Total People | 0 | 0 | 0 | 0 | 0 | 0 | 0 | 0 | 0 | 0 | 0 | 0 | |
| Total Payroll | $0 | $0 | $0 | $0 | $833 | $1,000 | $1,000 | $1,000 | $1,000 | $1,000 | $1,000 | $1,000 | |
| General Assumptions | |||||||||||||
| Month 1 | Month 2 | Month 3 | Month 4 | Month 5 | Month 6 | Month 7 | Month 8 | Month 9 | Month 10 | Month 11 | Month 12 | ||
| Plan Month | 1 | 2 | 3 | 4 | 5 | 6 | 7 | 8 | 9 | 10 | 11 | 12 | |
| Current Interest Rate | 10.00% | 10.00% | 10.00% | 10.00% | 10.00% | 10.00% | 10.00% | 10.00% | 10.00% | 10.00% | 10.00% | 10.00% | |
| Long-term Interest Rate | 10.00% | 10.00% | 10.00% | 10.00% | 10.00% | 10.00% | 10.00% | 10.00% | 10.00% | 10.00% | 10.00% | 10.00% | |
| Tax Rate | 30.00% | 28.00% | 28.00% | 28.00% | 28.00% | 28.00% | 28.00% | 28.00% | 28.00% | 28.00% | 28.00% | 28.00% | |
| Other | 0 | 0 | 0 | 0 | 0 | 0 | 0 | 0 | 0 | 0 | 0 | 0 | |
| Pro Forma Profit and Loss | |||||||||||||
| Month 1 | Month 2 | Month 3 | Month 4 | Month 5 | Month 6 | Month 7 | Month 8 | Month 9 | Month 10 | Month 11 | Month 12 | ||
| Sales | $693 | $1,500 | $3,000 | $3,750 | $4,500 | $5,625 | $5,625 | $4,875 | $4,875 | $4,875 | $4,875 | $4,875 | |
| Direct Cost of Sales | $0 | $0 | $0 | $0 | $0 | $0 | $0 | $0 | $0 | $0 | $0 | $0 | |
| Other | $0 | $0 | $0 | $0 | $0 | $0 | $0 | $0 | $0 | $0 | $0 | $0 | |
| Total Cost of Sales | $0 | $0 | $0 | $0 | $0 | $0 | $0 | $0 | $0 | $0 | $0 | $0 | |
| Gross Margin | $693 | $1,500 | $3,000 | $3,750 | $4,500 | $5,625 | $5,625 | $4,875 | $4,875 | $4,875 | $4,875 | $4,875 | |
| Gross Margin % | 100.00% | 100.00% | 100.00% | 100.00% | 100.00% | 100.00% | 100.00% | 100.00% | 100.00% | 100.00% | 100.00% | 100.00% | |
| Expenses | |||||||||||||
| Payroll | $0 | $0 | $0 | $0 | $833 | $1,000 | $1,000 | $1,000 | $1,000 | $1,000 | $1,000 | $1,000 | |
| Sales and Marketing and Other Expenses | $0 | $0 | $0 | $0 | $0 | $0 | $0 | $0 | $0 | $0 | $0 | $0 | |
| Depreciation | $0 | $300 | $300 | $300 | $300 | $300 | $300 | $300 | $300 | $300 | $300 | $300 | |
| Fixed Operations Costs | $0 | $1,300 | $2,623 | $2,623 | $2,623 | $2,623 | $2,623 | $2,623 | $2,623 | $2,623 | $2,623 | $2,623 | |
| Leased Equipment | $0 | $0 | $0 | $0 | $0 | $0 | $0 | $0 | $0 | $0 | $0 | $0 | |
| Utilities | $0 | $0 | $0 | $0 | $0 | $0 | $0 | $0 | $0 | $0 | $0 | $0 | |
| Insurance | $0 | $0 | $0 | $0 | $0 | $0 | $0 | $0 | $0 | $0 | $0 | $0 | |
| Payroll Taxes | 0% | $0 | $0 | $0 | $0 | $0 | $0 | $0 | $0 | $0 | $0 | $0 | $0 |
| Aircraft Upgrades | 15% | $0 | $0 | $0 | $0 | $0 | $0 | $0 | $0 | $500 | $0 | $1,000 | $0 |
| Mainenance and Repairs | $0 | $0 | $0 | $200 | $0 | $500 | $0 | $500 | $0 | $0 | $0 | $0 | |
| Total Operating Expenses | $0 | $1,600 | $2,923 | $3,123 | $3,756 | $4,423 | $3,923 | $4,423 | $4,423 | $3,923 | $4,923 | $3,923 | |
| Profit Before Interest and Taxes | $693 | ($100) | $77 | $627 | $744 | $1,202 | $1,702 | $452 | $452 | $952 | ($48) | $952 | |
| EBITDA | $693 | $200 | $377 | $927 | $1,044 | $1,502 | $2,002 | $752 | $752 | $1,252 | $252 | $1,252 | |
| Interest Expense | $270 | $270 | $270 | $270 | $270 | $270 | $270 | $270 | $265 | $260 | $255 | $248 | |
| Taxes Incurred | $127 | ($104) | ($54) | $100 | $133 | $261 | $401 | $51 | $52 | $194 | ($85) | $197 | |
| Net Profit | $296 | ($266) | ($139) | $257 | $341 | $671 | $1,031 | $131 | $135 | $498 | ($218) | $507 | |
| Net Profit/Sales | 42.73% | -17.76% | -4.63% | 6.85% | 7.58% | 11.93% | 18.33% | 2.69% | 2.76% | 10.22% | -4.48% | 10.39% | |
| Pro Forma Cash Flow | |||||||||||||
| Month 1 | Month 2 | Month 3 | Month 4 | Month 5 | Month 6 | Month 7 | Month 8 | Month 9 | Month 10 | Month 11 | Month 12 | ||
| Cash Received | |||||||||||||
| Cash from Operations | |||||||||||||
| Cash Sales | $693 | $1,500 | $3,000 | $3,750 | $4,500 | $5,625 | $5,625 | $4,875 | $4,875 | $4,875 | $4,875 | $4,875 | |
| Subtotal Cash from Operations | $693 | $1,500 | $3,000 | $3,750 | $4,500 | $5,625 | $5,625 | $4,875 | $4,875 | $4,875 | $4,875 | $4,875 | |
| Additional Cash Received | |||||||||||||
| Sales Tax, VAT, HST/GST Received | 0.00% | $0 | $0 | $0 | $0 | $0 | $0 | $0 | $0 | $0 | $0 | $0 | $0 |
| New Current Borrowing | $0 | $0 | $0 | $0 | $0 | $0 | $0 | $0 | $0 | $0 | $0 | $0 | |
| New Other Liabilities (interest-free) | $0 | $0 | $0 | $0 | $0 | $0 | $0 | $0 | $0 | $0 | $0 | $0 | |
| New Long-term Liabilities | $0 | $0 | $0 | $0 | $0 | $0 | $0 | $0 | $0 | $0 | $0 | $0 | |
| Sales of Other Current Assets | $0 | $0 | $0 | $0 | $0 | $0 | $0 | $0 | $0 | $0 | $0 | $0 | |
| Sales of Long-term Assets | $0 | $0 | $0 | $0 | $0 | $0 | $0 | $0 | $0 | $0 | $0 | $0 | |
| New Investment Received | $0 | $0 | $0 | $0 | $0 | $0 | $0 | $0 | $0 | $0 | $0 | $0 | |
| Subtotal Cash Received | $693 | $1,500 | $3,000 | $3,750 | $4,500 | $5,625 | $5,625 | $4,875 | $4,875 | $4,875 | $4,875 | $4,875 | |
| Expenditures | Month 1 | Month 2 | Month 3 | Month 4 | Month 5 | Month 6 | Month 7 | Month 8 | Month 9 | Month 10 | Month 11 | Month 12 | |
| Expenditures from Operations | |||||||||||||
| Cash Spending | $0 | $0 | $0 | $0 | $833 | $1,000 | $1,000 | $1,000 | $1,000 | $1,000 | $1,000 | $1,000 | |
| Bill Payments | $13 | $433 | $1,512 | $2,851 | $3,187 | $3,047 | $3,642 | $3,299 | $3,444 | $3,428 | $3,101 | $3,769 | |
| Subtotal Spent on Operations | $13 | $433 | $1,512 | $2,851 | $4,020 | $4,047 | $4,642 | $4,299 | $4,444 | $4,428 | $4,101 | $4,769 | |
| Additional Cash Spent | |||||||||||||
| Sales Tax, VAT, HST/GST Paid Out | $0 | $0 | $0 | $0 | $0 | $0 | $0 | $0 | $0 | $0 | $0 | $0 | |
| Principal Repayment of Current Borrowing | $0 | $0 | $0 | $0 | $0 | $0 | $0 | $0 | $0 | $0 | $0 | $0 | |
| Other Liabilities Principal Repayment | $0 | $0 | $0 | $0 | $0 | $0 | $0 | $0 | $0 | $0 | $0 | $0 | |
| Long-term Liabilities Principal Repayment | $0 | $0 | $0 | $0 | $0 | $0 | $0 | $0 | $600 | $600 | $600 | $800 | |
| Purchase Other Current Assets | $0 | $0 | $0 | $0 | $0 | $0 | $0 | $0 | $0 | $0 | $0 | $0 | |
| Purchase Long-term Assets | $0 | $0 | $0 | $0 | $0 | $0 | $0 | $0 | $0 | $0 | $0 | $0 | |
| Dividends | $0 | $0 | $0 | $0 | $0 | $0 | $0 | $0 | $0 | $0 | $0 | $0 | |
| Subtotal Cash Spent | $13 | $433 | $1,512 | $2,851 | $4,020 | $4,047 | $4,642 | $4,299 | $5,044 | $5,028 | $4,701 | $5,569 | |
| Net Cash Flow | $680 | $1,067 | $1,488 | $899 | $480 | $1,578 | $983 | $576 | ($169) | ($153) | $174 | ($694) | |
| Cash Balance | $980 | $2,047 | $3,535 | $4,434 | $4,914 | $6,492 | $7,475 | $8,051 | $7,883 | $7,729 | $7,904 | $7,210 | |
| Pro Forma Balance Sheet | |||||||||||||
| Month 1 | Month 2 | Month 3 | Month 4 | Month 5 | Month 6 | Month 7 | Month 8 | Month 9 | Month 10 | Month 11 | Month 12 | ||
| Assets | Starting Balances | ||||||||||||
| Current Assets | |||||||||||||
| Cash | $300 | $980 | $2,047 | $3,535 | $4,434 | $4,914 | $6,492 | $7,475 | $8,051 | $7,883 | $7,729 | $7,904 | $7,210 |
| Other Current Assets | $0 | $0 | $0 | $0 | $0 | $0 | $0 | $0 | $0 | $0 | $0 | $0 | $0 |
| Total Current Assets | $300 | $980 | $2,047 | $3,535 | $4,434 | $4,914 | $6,492 | $7,475 | $8,051 | $7,883 | $7,729 | $7,904 | $7,210 |
| Long-term Assets | |||||||||||||
| Long-term Assets | $36,000 | $36,000 | $36,000 | $36,000 | $36,000 | $36,000 | $36,000 | $36,000 | $36,000 | $36,000 | $36,000 | $36,000 | $36,000 |
| Accumulated Depreciation | $0 | $0 | $300 | $600 | $900 | $1,200 | $1,500 | $1,800 | $2,100 | $2,400 | $2,700 | $3,000 | $3,300 |
| Total Long-term Assets | $36,000 | $36,000 | $35,700 | $35,400 | $35,100 | $34,800 | $34,500 | $34,200 | $33,900 | $33,600 | $33,300 | $33,000 | $32,700 |
| Total Assets | $36,300 | $36,980 | $37,747 | $38,935 | $39,534 | $39,714 | $40,992 | $41,675 | $41,951 | $41,483 | $41,029 | $40,904 | $39,910 |
| Liabilities and Capital | Month 1 | Month 2 | Month 3 | Month 4 | Month 5 | Month 6 | Month 7 | Month 8 | Month 9 | Month 10 | Month 11 | Month 12 | |
| Current Liabilities | |||||||||||||
| Accounts Payable | $0 | $384 | $1,418 | $2,744 | $3,087 | $2,925 | $3,532 | $3,184 | $3,329 | $3,326 | $2,974 | $3,667 | $2,966 |
| Current Borrowing | $0 | $0 | $0 | $0 | $0 | $0 | $0 | $0 | $0 | $0 | $0 | $0 | $0 |
| Other Current Liabilities | $0 | $0 | $0 | $0 | $0 | $0 | $0 | $0 | $0 | $0 | $0 | $0 | $0 |
| Subtotal Current Liabilities | $0 | $384 | $1,418 | $2,744 | $3,087 | $2,925 | $3,532 | $3,184 | $3,329 | $3,326 | $2,974 | $3,667 | $2,966 |
| Long-term Liabilities | $32,400 | $32,400 | $32,400 | $32,400 | $32,400 | $32,400 | $32,400 | $32,400 | $32,400 | $31,800 | $31,200 | $30,600 | $29,800 |
| Total Liabilities | $32,400 | $32,784 | $33,818 | $35,144 | $35,487 | $35,325 | $35,932 | $35,584 | $35,729 | $35,126 | $34,174 | $34,267 | $32,766 |
| Paid-in Capital | $10,450 | $10,450 | $10,450 | $10,450 | $10,450 | $10,450 | $10,450 | $10,450 | $10,450 | $10,450 | $10,450 | $10,450 | $10,450 |
| Retained Earnings | ($6,550) | ($6,550) | ($6,550) | ($6,550) | ($6,550) | ($6,550) | ($6,550) | ($6,550) | ($6,550) | ($6,550) | ($6,550) | ($6,550) | ($6,550) |
| Earnings | $0 | $296 | $30 | ($109) | $148 | $489 | $1,160 | $2,191 | $2,322 | $2,457 | $2,955 | $2,737 | $3,244 |
| Total Capital | $3,900 | $4,196 | $3,930 | $3,791 | $4,048 | $4,389 | $5,060 | $6,091 | $6,222 | $6,357 | $6,855 | $6,637 | $7,144 |
| Total Liabilities and Capital | $36,300 | $36,980 | $37,747 | $38,935 | $39,534 | $39,714 | $40,992 | $41,675 | $41,951 | $41,483 | $41,029 | $40,904 | $39,910 |
| Net Worth | $3,900 | $4,196 | $3,930 | $3,791 | $4,048 | $4,389 | $5,060 | $6,091 | $6,222 | $6,357 | $6,855 | $6,637 | $7,144 |

