
O'Connor & Partners
Executive Summary
O’Connor & Partners LLC will consult to companies that want to produce chemicals and energy from annually renewable feedstocks. We will help our clients attain economic utilization of the major fractions of biomass as well as minor components that can be functionalized into high-value specialty products. The two major components of all forms of biomass are cellulose and hemicellulose, which are long chains of simple sugars.
Many chemicals made today from petroleum were once manufactured from sugar. Several of these are niche chemicals with small markets and high barriers to entry. The others are comprised of commodities whose manufacturing costs are optimized by the economies of scale found in the traditional refineries of the world. In order to compete in today’s marketplace with these petroleum-derived commodity chemicals, it is critical to begin with significantly lower feedstock costs. Under-utilized lignocellulosic biomass feeds have the potential to be much cheaper than petroleum, on a carbon basis. Biomass contains the same sugars which have been demonstrated to work.
There are many products that can only be effectively made from biomass sugars. Industrial biotechnology has developed fermentation organisms which produce high selectivities to specific products, often with preference to one racemic stereoisomer over another (important in, for example, many pharmaceutical compounds). To mimic these feats of biochemistry, traditional feedstocks and processes would be much more expensive, if they were even possible at all. An excellent example of industrial biotechnology is polylactide polymers made from fermenting corn sugars, by Cargill Dow LLC. Industrial biotech has been coined by industry observers as the “third wave of biotechnology.”
O’Connor & Partners LLC recognizes that new ventures in bio-refining require technical excellence grounded in economic realities. We seek to serve as management consultants to those individuals and companies that intend to lead the bio-industrial revolution. The expected customer base includes emerging industrial-biotechnology firms, large existing chemical companies and utilities, and agricultural operations. We will help our clients realize industrial at less cost and/or in less time than they could do alone – with a guarantee of top-quality, professional service. With our assistance our clients will also achieve sustainability from the perspective of the triple bottom lines – economic, environmental, and social responsibilities in all their business activities.
The potential market is enormous. Experts have estimated that bio-refining will grow into an industry ranging from $280 billion/yr to $500 billion/yr by 2013.
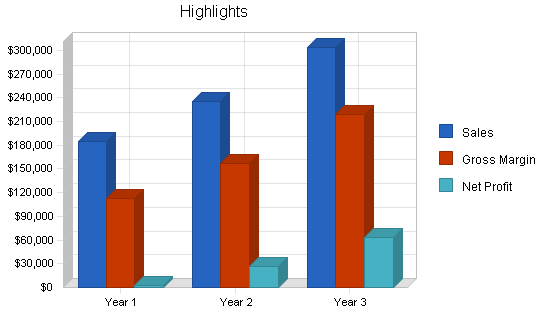
O’Connor & Partners LLC will open for business in Minneapolis, Minnesota, starting with the founding partner (Ryan O’Connor), one associate (to be recruited), and one secretary. Figure 1 forecasts sales, gross margin, and net profit for the three years covered in this business plan. Starting with an investment from outside investors, the plan projects a modest profit over the three-year period and a healthy net worth at the end of year 3. At this point the firm should be well-positioned to add consultants to grow the business, or to consider a buy-out from a large consultancy.
1.1 Mission
O’Connor & Partners will be the leading bio-refining consulting firm in the United States providing expertise in the technical and economic analysis of integrated bio-refining projects and activities. We will provide this service while adhering to our economic, social, and environmental responsibilities for our clients, our industry, and ourselves.
1.2 Objectives
We seek to establish the industry standard for technical and business excellence in the pursuit of visionary bio-refining platforms, according to customer-satisfaction and industry surveys. To accomplish this objective, the following elements are crucial:
- Unique consulting services that are clearly proven.
- Ability to manage confidentiality and intellectual-property issues among competitors.
- Professional relevance (state-of-the-art awareness) and knowledge growth in rapidly expanding industry.
- Demonstrated concern for clients’ well being, leading to repeat business and a good reputation for our firm.
- Retention of our own employees and partners.
1.3 Keys to Success
- Professional quality in all consulting
- Ability to manage confidentiality and intellectual-property issues among competitors
- Professional relevance (state-of-the-art awareness) and knowledge growth in rapidly expanding industry
- Retention of existing clients (repeat business)
Company Summary
O’Connor & Partners LLC is a new consulting venture that is planned to officially open for business on January 1. Headquartered in Minneapolis, MN, USA, there will be external affiliates around the globe. We sell consulting services only in industries and activities associated with the industrial bio-refinery, the integrated business systems that are revolutionizing the production of chemicals and energy from renewable resources.
2.1 Start-up Summary
Total start-up expenses are estimated in the table below. Some of these categories are largely unknown (e.g., insurance) reasonable estimates are made. Other items can be purchased as revenue is obtained and more resources are needed to keep up with the work.
The plan calls for some liquid assets at start-up. This fund will pay expenses for the first few months, as well as providing a cash-reserve fund.

| Start-up | |
| Requirements | |
| Start-up Expenses | |
| Legal | $2,000 |
| Stationery etc. | $500 |
| Brochures | $500 |
| Insurance | $1,000 |
| Rent | $1,000 |
| Research and Development | $1,000 |
| Expensed Equipment | $4,000 |
| Total Start-up Expenses | $10,000 |
| Start-up Assets | |
| Cash Required | $40,000 |
| Other Current Assets | $0 |
| Long-term Assets | $0 |
| Total Assets | $40,000 |
| Total Requirements | $50,000 |
| Start-up Funding | |
| Start-up Expenses to Fund | $10,000 |
| Start-up Assets to Fund | $40,000 |
| Total Funding Required | $50,000 |
| Assets | |
| Non-cash Assets from Start-up | $0 |
| Cash Requirements from Start-up | $40,000 |
| Additional Cash Raised | $0 |
| Cash Balance on Starting Date | $40,000 |
| Total Assets | $40,000 |
| Liabilities and Capital | |
| Liabilities | |
| Current Borrowing | $0 |
| Long-term Liabilities | $0 |
| Accounts Payable (Outstanding Bills) | $0 |
| Other Current Liabilities (interest-free) | $0 |
| Total Liabilities | $0 |
| Capital | |
| Planned Investment | |
| Investor 1 | $25,000 |
| Investor 2 | $25,000 |
| Additional Investment Requirement | $0 |
| Total Planned Investment | $50,000 |
| Loss at Start-up (Start-up Expenses) | ($10,000) |
| Total Capital | $40,000 |
| Total Capital and Liabilities | $40,000 |
| Total Funding | $50,000 |
2.2 Company Ownership
The company will be organized as a limited-liability company (LLC), which will allow easy changes of ownership in the future, as well as certain tax advantages. Start-up investment is needed. The total valuation of the firm has been estimated to be modest, and a net worth to be realized during year 4 of the operation (according to the plan). As of this writing, 20 equity shares will be offered at $5,000 for 1% ownership each. In this way, 20% of the initial operation will be owned by outside investors. The remaining 80% of the venture is initially owned by the founder, Dr. Ryan O’Connor, but the ownership will ultimately be shared among all future partners (to be recruited as the business grows).
As an option, 70% total return on investment might be paid after three years to the equity investors, whose ownership would be transferred to the firm partners. Thus each initial share would be returned $8,500, or 18% annualized ROI over three years. This plan presents an exit strategy but also offers the long-term upside of the business to any initial investors.
2.3 Company Locations and Facilities
Office space will be rented in the Twin Cities (Minneapolis/St. Paul) of Minnesota. A downtown office location will be advantageous, especially if some of the local clientele are also positioned downtown. The founder will retain a home office as well as one at the central headquarters. This office will help serve clients in the Minnetonka area (western suburbs of Minneapolis), such as Cargill or Cargill Dow LLC.
Services
O’Connor & Partners LLC sells consulting services to help clients at various stages of their own bio-refinery activities. The nature of the work we do is a combination of technical engineering, economic forecasting, and management strategy, all on a strict confidential basis. Our basic hourly rate of $175/hr for partners and $125/hr for associates applies to most of our services. In certain circumstances, we can be compensated with equity in the client’s venture.

3.1 Service Description
The management-consulting services of O’Connor & Partners can be classified as follows:
- Market research and business development.
- Biomass-feedstock supply and demand.
- bio-refinery chemicals, materials, fuels, energy, and other products.
- In competition with petroleum-derived equivalents (e.g., biopolymers, automotive fuels, and electricity).
- Chemicals and materials currently produced only from biomass resources (e.g., animal feed and nutraceuticals).
- Future bio-refinery products such as hydrogen and a wide range of chemicals and materials produced from fermenting biomass sugars.
- Confidential discussions with possible partners and vendors.
- Economic analysis of projects and plans.
- R & D projects.
- Pilot and manufacturing facilities (preliminary and engineered designs).
- Financial assessment (risk-adjusted NPV) of capital-investment options.
- Affiliate Network services.
- Engineering and construction of bio-refineries.
- Industrial and government facilities available for contractual R & D.
- Intellectual-property management and competitive-advantage strategies.
- Search for project funding (network to include potential investors).
- Client education (seminars, training, etc.).
3.1.1 Who Will Buy, and Why?
There are many start-ups, or groups considering starting up, within industrial biotechnology. These organizations are often severely short on resources (time, money, and people), and the pile of activities is always growing. Then, there are companies that have successfully started up and are now looking to grow their businesses or expand into new bio-refineries markets. An example is Cargill Dow LLC, a small stand-alone organization from its parent investors, Cargill and Dow. Finally, several large, global corporations are looking to participate in this emerging industry. As part of an aim for sustainable development, there are initiatives at DuPont, Cargill, BP, and Shell, to name only a few.
The annual sales of these five companies alone (DuPont, Cargill, BP, Shell, and Dow) total close to $500 billion, so clearly large amounts of money are at stake. Cargill is already doing bio-refineries of agricultural crops, but the focus has traditionally been on foods and nutrients for humans and animals. However, public efforts are underway to utilize biomass sources for the production of industrial chemicals (both commodity and specialty). BP and Shell are traditional refiners who understand what the future looks like. Both are actively studying renewable technologies for the production of energy. The vision of economic bio-refineries is not lost on these oil giants.
In general there are countless companies – not just chemical companies – that want either their existing businesses to become more sustainable, or to enter new markets based on the concept of sustainable business systems. Many companies state they want to play the game but don’t know the rules, don’t know how to play, and are not quite sure of the impact on their overall business. O’Connor & Partners will help these companies understand the rules for their particular industry, lead the pack, and make a real difference. bio-refineries promises to make global impacts, not only technologically but also politically as we reduce our dependence on foreign oil. With another war with Iraq looming, oil is a hot topic again. At a minimum, there is economic instability in the markets which use imported petroleum. Refining and upgrading biomass offers a true alternative to petroleum in a variety of proven markets.
3.1.2 How Much Does It Cost?
At the outset of a project, the cost of our services will be outlined. We will bid for the project using an estimated number of hours for project completion. The standard hourly rate is $175/hr for partners and $125/hr for associates, for internal work. Outsourced services (through the Affiliate Network – Section 3.6) will be billed at cost plus 15% (e.g. use of a lawyer charging $175/hr means we charge the client about $200/hr). In some cases clients will seek a fixed-bid contract which will not depend on actual hours spent on the project. Only when we have prior experience which allows us to provide an accurate quotation, will we offer our services.
Travel expenses will be additional to base fees. For hourly-based bids, travel costs will be billed directly to the client. Travel time itself will be billed at normal rates since (1) it is time not billable to other clients, and (2) a large percent of travel time will indeed be spent working.
We recognize that many of the smaller bio-refineries start-ups are often strapped for cash and might be unable to pay our fees, especially for longer projects. Rather than paying us cash, we can become an equity partner (on a confidential basis) in the client’s venture. The terms would be negotiated, but essentially we would be compensated with stock (if publicly traded or privately available) or other equity holdings. For example, if a start-up is selling $1 million in equity shares and hires us for a 10-week project normally billed at $70,000, we would become 7% owner of that company. (Although they still might need most of that investment, in theory we did some of the work that the $1 million was to have paid for.)
This option does pose some risk for us since we lose time and money if the start-up fails, but we would likely gain valuable experience as a consulting company to take to future assignments. Additionally, this pricing option is part of our own investment strategy as a firm and as individual partners. If one of these start-ups takes off and we have equity in it, obviously we stand to gain financially (beyond billable hours).
3.1.3 What is the Service, Exactly?
Our goal is to save our clients time and money by doing a combination of research studies, calculations and simulations, and report writing. We will utilize our proprietary computer model (see Section 3.5), our education and experience, the literature/internet, and the Affiliate Network. Past experience, always utilized in a confidential manner, will be a crucial piece of our value proposition. Presentations, as often as appropriate, will be made to the client team. General communication will be accomplished through teleconferences, face-to-face meetings, e-mail, and fax. Travel will be scheduled as needed for efficient project completion.
Some specific bio-refineries problems we can solve through consulting include:
- Insufficiently washed and pre-treated feedstocks can cause numerous processing problems, which we can address before they occur. One example is high ash content, which can cause fast mechanical failure of equipment. The appropriate ash-removal steps need to be employed during pretreatment. Also we can show the client how to capture value from that ash (as a soil nutrient).
- Collection of some feedstocks requires farmer buy-in early because farming practices may need to be changed. We can work with the appropriate stakeholders to tell the story to the right people, show them they stand to gain financially, and get the systems in place.
- Marketing a product based on environmental advantages alone is not a good strategy, but it is commonly perceived to be the only approach. In almost all cases, products need to meet or exceed the specifications of existing products to be replaced. We will study the existing market conditions and relate those to the client’s product and process potential.
- For some existing manufacturers, there will be unused plant equipment which needs to be utilized for biomass processing. Or, the reactor design for a pre-treated was poor, but there is no more capital to be deployed to fix it. In both cases we will help the client understand how to make the reactor work to accomplish its objectives.
- The cost of feedstock is argued to be a key advantage of biomass. Most clients will want an answer to the question, “What is the cost of carbon today (from biomass vs. petroleum vs. coal) and what is it projected to be in the future?” An important aspect of this question is geography, because the low density of biomass translates into high transportation costs. Thus biomass feedstock supply is usually local, while the market demand is global.
3.2 Competitive Comparison
The key reasons that clients will use our services include:
- By removing technical obstacles, O’Connor & Partners will save our clients money, or make them more profitable, compared to doing the work themselves.
- Technical expertise and market knowledge from actually working in the transportation industry (the founder as well as top personnel expected to be recruited).
- We are committed to an in-depth understanding of transportation technologies and economics. The larger management-consulting firms will apply general knowledge and tools gained from a variety of practices, but they will not necessarily have specific transportation expertise. This is our business.
- Strategic vision is not always automatic; we can help a client see the future before their competitor does, and gain essential competitive advantage.
O’Connor & Partners will work to become an all-purpose transportation consulting firm. While obviously it would not be possible for one small firm to do everything, our efficient use of the Affiliate Network means that clients can feel comfortable about hiring O’Connor & Partners for large, integrated, strategic projects.
Because our firm is devoted to commercializing biomass, we consider ourselves part of the transportation industry more than the consulting industry in general. Top management–or technology–consulting outfits, such as McKinsey and A.D. Little, respectively, are not expected to be direct competitors for the first several years. Later, when transportation becomes a full-fledged industry, these firms will perhaps create a transportation practice. At that point, O’Connor & Partners will have the experience and customer base to compete directly with any new entrant. Alternatively, we will have the expertise that these giants will be seeking to acquire by buying out our firm.
Our primary competitors, then, in the first few years are likely to be the clients themselves. They may decide to do the work in-house. Many companies involved in transportation, as with most other emerging industries, are extremely pressed for time and personnel resources, so there should be a driver for outside help. Also, the unique collection of partners’ experiences will hopefully give the client something they could not provide themselves, even if time allowed.
3.3 Sales Literature
A variety of sales literature will be created. A sample brochure can be mailed or e-mailed as a PDF to interested parties. The website of O’Connor & Partners will also be important. We will provide our philosophy and mission statement, along with many links to interesting transportation-industry resources. Rate information will not be posted, instead requiring an inquiry. We will welcome questions and comments by e-mail, which will go to a dedicated e-mail address for this purpose. Finally, and most importantly, jobs will be managed utilizing the website, for efficient exchange of information with the client. Each project will have its own unique and password-protected site, allowing two-way exchange of progress, ideas, calculations, reports, and presentations which are often difficult to send by e-mail.
3.4 Fulfillment
The key fulfillment and delivery will be provided by the partners and associates of the firm. The real core value is professional expertise, provided by a combination of experience, education, and hard work. The service is mostly provided by directly employing professionals, including the firm’s founding partner full-time. The remainder of the service is supplied through a network of professional affiliates, which will have agreed to such collaboration with O’Connor & Partners. We refer to these allies as our Affiliate Network throughout this plan (more information in Section 3.6). Every project will be led by a partner.
Of course we will use the latest electronic communications tools. Every consultant with O’Connor & Partners will be equipped with a cable-internet connection, dedicated fax line, land line, cell phone, and personal digital assistant (e.g. Palm Pilot) with internet and e-mail capabilities. We will also communicate with the clients through their own dedicated web page, linked through our internet site, as described in Section 3.6 below.
3.5 Proprietary Computer Model
We will build a proprietary computer model (to be trademarked Biofinity™) of the transportation concept, using simulation software. This model will be capable of analyzing multiple feedstocks and multiple product scenarios, and it will be tied directly to operating and capital costs. Using this technology tool, O’Connor & Partners will be able to effectively assess the business potential of various options explored by the client. The founder has significant experience building such models with simulation (and other) software.
The following list highlights specific transportation technical challenges that can be addressed by the Biofinity program, and how the client’s bottom line will be positively impacted:
- Most transportation platforms can be fed many feedstocks, depending on local conditions. The software will consider the possibilities of feeding rice straw rather than corn stover or bagasse, for example. Biomass compositions can be entered as part of the overall sensitivity analysis. Depending on geographic location and specific product mix, the net economics of the various feedstock scenarios will be simulated.
- Biomass compositional variability is a key challenge in a transportation. The feedstock composition (even within a single type of biomass) not only affects optimum processing conditions but also can greatly impair the profitability of the operation when the concentrations of certain components are abnormal. Biofinity will include routines to optimize the entire transportation for varying inputs, specifying whether a purchased feedstock should be rejected for the primary production process and instead burned for energy (or even sent to waste, depending on fuel value which is computed by Biofinity).
- The complexity of a full-scale transportation can become enormous. Biofinity will be designed to consider market-based product opportunities, feedstock choices, energy integration, and utility sharing and co-generation, among other features. Often, a bio-refiner who focuses on a single feedstock and single product will conclude that the economics are poor. However, integrated strategies that take advantage of complex networks of feeds, products, and energy, are those that can offer much higher returns on capital invested. Contrary to simple calculations, these simulations require feedback and recycle loops which cannot easily be performed without a computer program such as Biofinity.
In addition to these specific examples, the Biofinity program will be able to help clients with their environmental life-cycle inventory assessment, which requires detailed inputs and outputs of raw materials, electricity, and gas. Indicators such as total CO2 emissions or fossil-fuel usage will be calculated, assisting the client’s sustainability efforts.
3.6 Future Services
Every business is an evolving one. As we work with the industry, we might uncover issues that we did not intend to address as a consulting company but for which we can add value. Over time, some of our core activities could change, as we build reputation and experience in a particular area. Such activities could emanate from biotechnology, for instance, since genetic engineering and biocatalyst development are essential tools in the fermentation of sugars from biomass.
If the industry really grows to ~$300 billion/yr in 2013 (see Section 4.4), then in order to keep up it would seem that O’Connor & Partners needs to also grow by a few orders of magnitude. Thus a 3-person firm in 2004 would become several hundred employees in 2013, if we actually tracked industry growth. This is an exciting possibility to grow up with a new industry and emerge as the leading bio-refinery consulting company. Additional offices will be added as needed, eventually globally.
3.7 Affiliate Network
The Affiliate Network will be very important for the success of O’Connor & Partners. We have access to and experience with top engineering and construction companies that can build a biomass plant, industrial and government laboratories and facilities, non-government organizations, intellectual-property lawyers, and potential investors in bio-refineries. In addition, the network includes several industry experts with up to 60 years of individual experience that is directly relevant to the emerging bio-refining industry. Some of the potential members of the network include the National Renewable Energy Lab, The Rocky Mountain Institute, and Jim Hettenhaus. There are others that cannot be disclosed publicly at this time, because of the founder’s obligations to Cargill Dow LLC.
A margin of 15% will usually be added to all work outsourced or sub-contracted by O’Connor & Partners. One exception is for engineering and construction, for which only initial work requiring our cooperation has the 15% surcharge.
Market Analysis Summary
O’Connor & Partners will focus on consulting to existing chemical manufacturers seeking to process biomass to energy and chemicals, as well as new organizations that intend to develop and/or build a bio-refinery. For the most part, the existing manufacturers are large, global chemical corporations. The newer entities are typically smaller and embrace an entrepreneurial spirit, often matching our own philosophies. We will work with any organization that hopes to accelerate commercialization of bio-refining technologies.
4.1 Market Segmentation
Chemical Manufacturers
These are corporations that produce and/or sell commodity or specialty chemicals and fuels, polymers, and other materials. They are typically large, with annual sales ranging from several hundred million to several hundred billion dollars. Just a few examples include DuPont, GE, Dow, 3M, Shell, BP, and ExxonMobil.
Bio-refinery Start-ups
Examples of recent start-ups include Arkenol (2003), PureVision (2003), Alltech (2000), and Cargill Dow LLC (formation in 1997; operational full-scale bio-refinery in 2002). This category is meant to include all start-ups over the plan, not just those that actually start up in the year indicated. Thus a 2004 start-up is included in the 2005 and 2006 years. The category is for companies who do not currently have any chemical operations.
Agricultural
This sector primarily covers feedstock collection (farming, transportation, and storage), which is an essential, but largely independent, component of bio-refining. Also this category includes farmer cooperatives that in the Midwest produce ethanol from corn (even though those could be also classified as small bio-refineries).
Utilities
Often linked to chemical operations, utility companies define a unique sector due to the large, separate markets for electricity and power. Bio-refineries have the capability for generation of electricity through direct combustion or biomass gasification. Also the future “hydrogen economy” that is promised could be well-served by bio-refineries, which can produce clean H2 through partial oxidation and steam reforming of biomass. Or, ethanol (one of the most-abundant bio-refinery products today) can serve as a hydrogen reservoir for on-board H2 production on a fuel-cell vehicle. (Hydrogen as a fuel for fuel cells could also belong in the chemical-manufacturing category, but the common vision for H2 is similar to electricity supply networks and thus can be thought of as a utility.)
Other
Reserved for businesses which don’t fall into an obvious sector but which nevertheless have bio-refinery aspirations.
The figures in the Market Analysis table of potential customer base for bio-refining consulting services are only meant to be estimates and are not based on research. Certainly this table does not tell the entire story. No attempt is made to estimate the market value of the sectors, but they span orders of magnitude in revenue.
Aa pie chart shows the relative number of potential clients in each sector.
The growth estimates are minimal (3%) for chemical manufacturing and utilities, which is consistent with recent trends. However, even if the number of these companies does not grow much, their investment in industrial biotechnology might increase in the future, thereby representing increased real potential for O’Connor & Partners. For start-ups a more-aggressive assumption (50%) is made since it is a new industry.

4.1.1 Chemical Manufacturing
These companies already use consultants and typically understand the value proposition of consulting (whether IT, engineering, or accounting). What they need to be sold on is the concept of the bio-refinery, how it fits into their existing businesses and can define new ones, and what the impacts are on long-term corporate goals (such as reduced dependence on feedstock imports). The issue here is creating need awareness. In some important cases these companies have publicly stated they are going down this path. Then their need is the time/people to devote to the necessary research projects to move faster down the path, and to confirm it is the right path for them. They understand that any bio-refinery project needs to respect economic realities, as determined by market-growth opportunities, the pool of capital available for projects, and executive strategic decisions. These chemical manufacturers will likely require very specific technical input from a firm such as O’Connor & Partners.
4.1.2 Biorefinery Start-ups
These companies are on board with the potential of the bio-refinery, because they (and/or their investors) have justified their starting up. They need consulting to understand how specific process options lead to different potential product distribution. Sometimes a start-up is heavy on personnel with science and engineering backgrounds who may not have appropriate business training. Other start-ups might enjoy extensive financial and management expertise, even with previous new ventures, but lack key technical experience. Even when the start-up team seems to be in balance, they often still need help managing complex projects initially.
4.1.3 Agricultural
An agricultural venture team might be heavy on farmers and others who have immense practical experience but do not always have the necessary technical or management expertise in bio-refinery. It is quite possible that this is the sector in which O’Connor & Partners can provide the highest incremental benefit. The media has recently reported that Minnesota farmer groups processing corn into ethanol suffer from inadequate technical knowledge to operate at high efficiencies. As a hypothetical example, consider a Chinese group that invented a novel way to collect rice straw in China, but they are unable to take advantage of the opportunities offered by the new industry to sell into the bio-refinery-feedstock market, in which rice straw already competes. With proper consulting, they can work with partners to move thousands of tons of rice straw daily to bio-refineries all over the world. Or, technical consulting can show them how they, too, can take part in bio-refinery rice straw to compete with, say, the furfural market (which is currently dominated by corn-cob processing in China).
4.1.4 Utilities
Utility companies need to view bio-refining from an historical perspective of the traditional oil refinery and the chemical industry. For many reasons utilities are often across the fence from these operations, and the same benefits apply to a bio-refinery. Steam, electricity, and power needs could be supplied to a bio-refinery in the traditional sense (largely by processing coal, natural gas, or nuclear fuel), in which case the need for our consulting might be small. However, utility companies that want to utilize biomass feedstocks, to generate steam, electricity, or hydrogen, will benefit from our consulting expertise.
| Market Analysis | |||||||
| Year 1 | Year 2 | Year 3 | Year 4 | Year 5 | |||
| Potential Customers | Growth | CAGR | |||||
| Chemical Manufacturers | 3% | 100 | 103 | 106 | 109 | 112 | 2.87% |
| Biorefinery Start-ups | 50% | 10 | 15 | 23 | 35 | 53 | 51.73% |
| Agricultural | 10% | 50 | 55 | 61 | 67 | 74 | 10.30% |
| Utilities | 3% | 100 | 103 | 106 | 109 | 112 | 2.87% |
| Other | 10% | 25 | 28 | 31 | 34 | 37 | 10.30% |
| Total | 8.02% | 285 | 304 | 327 | 354 | 388 | 8.02% |
4.2 Target Market Segment Strategy
In terms of strategy, it is hypothesized that the chemical manufacturers and utilities probably offer more-immediate business opportunities for us than the other sectors, and thus targeting them early makes sense. These large corporations might look to us as relatively affordable, with respect to their overall budgets and business goals. On the other hand, chemical companies and utilities might have existing relationships with other firms and be more willing to use them even if bio-refining is outside the expertise of those consultancies.
The small bio-refinery start-ups are going to shape the industry, so we want to work with them. Their excitement and vision match our own aspirations. However, because they are usually cash-strapped, they might not be so willing to pay large fees even if they see the value of the work. Here our equity-pricing option comes into play. There will be similar opportunities in the agricultural sector, especially with cooperatives having dispersed ownership structures.
4.3 Market Trends
There are many market trends which are speeding up the emergence of the bio-refining industry. Key concepts are sustainability and the “triple bottom line” – paying attention to not only the economic but also the environmental and social aspects in all business activities.
Most companies, organizations, and individuals would probably characterize the perceived benefits of bio-refineries using at least one of the following:
- To develop chemicals, transportation and other fuels, and energy from renewable sources.
- To increase the feedstock independence of the United States (for fuels and chemicals).
- To provide favorable effects on conservation, public health, and the environment.
- To diversify markets for raw agricultural and forestry products.
- To create jobs and enhance the economic development of the rural economy.
These five points are closely linked to the concepts of sustainability and the triple bottom line. For long-term sustainability, using renewable resources is the only choice, since fossil fuels are essentially never replenished. As the cost of petroleum rises and that of biomass falls, biomass feedstocks can be justified on purely economic terms. Feedstock costs are a key part of any chemical operation; Dow Chemical’s losses during 2001 and 2002 have been attributed largely to high feedstock costs. Many of Dow’s products could be produced from biomass with proper technology (and yes, Dow would be pursued as a possible client).
In a 1978 article published in Science, DuPont provided a review of over 250 chemicals that are manufactured today from petroleum and were once manufactured from sugar. Many of these are niche chemicals with small markets and high barriers to entry. The others are comprised of commodities whose manufacturing costs are optimized by the economies of scale found in the mega-refineries of the world. In order to compete in today’s marketplace with these petroleum-derived commodity chemicals, it is critical to begin with significantly lower feedstock costs. Biomass-sugar feedstocks, if the economics are attractive, would work because these same compounds have previously been derived from sugar fermentation or thermal/enzymatic conversion.
There are many products that can only be effectively made from biomass. Industrial biotechnology has developed fermentation organisms which produce high selectivities to specific products, often with preference to one racemic stereoisomer over another (important in medicines and nutrients). Traditional feedstocks and processes would be much more expensive to mimic these feats of biochemistry, if they were even possible at all. Therefore, new markets open up for development. An excellent example of the enabling nature of industrial biotechnology is with polylactide polymers made from fermenting corn sugars, by Cargill Dow LLC.
4.4 Market Growth
The February 3, 2003 Chemical & Engineering News magazine described a January 2003 conference called “The Third Wave in Biotechnology.” Bio-refining has been coined by industry observers as the “third wave of biotechnology” after food and pharmaceutical biotechnology. Keynote speaker Rolf Bachmann, a consultant with McKinsey & Co., said a new report from his firm estimates that by 2010, biotechnology will impact about 20% of the worldwide chemical market – a $280 billion-a-year slice. “Momentum is building in the sector. Biocatalysts are becoming more stable, yields are improving, and public pressure is growing for industry to develop safe, environmentally friendly, and sustainable products.” Jean-Jacques Bienaime, new CEO of Genencor International, says “There is lots of fun in health care, but for the next 20 years, in terms of value creation, it will be more exciting in industrial biotechnology.”
The article gets even more to the point of O’Connor & Partners. Many speakers emphasized that, in most cases, industrial biotechnology is limited by the size and resources of companies doing the research. Development of improved processes will play an important part in propelling biotech into the traditional chemical industry, according to Larry Drumm, V.P. of business development for the Michigan Biotechnology Institute. Drumm added that long-term investment is increasingly going to the entrepreneurial companies in biotechnology. “Chemical companies will need to form partnerships with these companies or risk having to become low-cost producers of traditional materials,” he said.
In terms of market sectors, the growth to $280 billion/yr would be occurring mostly in a combination of Bio-refinery start-ups, chemical manufacturing, and utilities.
4.5 Competition and Buying Patterns
Why would someone choose another consulting company over us?
- Previous experience with another consulting firm.
- Our rates perceived to be too high.
- They don’t see the need to hire any consultants.
- They do not think we have appropriate experience to add value to their project(s).
In aggregate, the viability of consulting firms tracks overall economic conditions or specific industries, depending on the targeted clients. However, the success of individual firms varies widely, regardless of how an industry is doing. Word of mouth is an important device, and repeat business is crucial. Reputation is immensely important, and reputation building in fact already started with the past experiences of anyone associated with O’Connor & Partners.
4.6 Main Competitors
Well-known management-consulting firms
Example: McKinsey, Bain, BCG, etc.
Strengths: International locations managed by partners with a high level of understanding of general business; enviable reputations which make purchase of consulting an easy decision for a manager, despite the very high prices.
Weaknesses: General business knowledge does not substitute for specific (does not) expertise; fees are extremely high, and work is generally done by very junior-level consultants even though sold by high-level partners; focus on strategy but less emphasis on implementation, which is where many does not start-ups need the most help.
Well-known technology-consulting firms
Example: A.D. Little
Strengths: International offices; specific technical knowledge and good relationships with potential client companies.
Weaknesses: Technical knowledge of the chemical and refining industries, but not necessarily the does not industries; reduced emphasis on business solutions.
Niche biotechnology consultants
Example: CEA, Inc.
Strengths: These firms have actual experience consulting to organizations that seek to commercialize industrial applications of biotechnology; they often have extensive network relationships (some of these would be good candidates for our Affiliate Network).
Weaknesses: These firms are often one-man shows which might not leverage the collective experience of a larger team of consultants; sometimes they do not have a well-developed mission and are somewhat academic in nature.
Non-profit organizations
Example: Rocky Mountain Institute
Strengths: Modest fees for work performed; they have experience consulting in industrial biotechnology.
Weaknesses: Although these companies could compete for some of the business we are after, they often cannot offer the same level of does not understanding; also they are not chartered to grow as a business or be a stakeholder in the does not industry itself, which means they could view it purely as a one-time advising relationship.
No consulting
Example: Companies doing the work in-house
Strengths: No incremental cost except travel; also, the general work is done by the people who are entirely responsible, and the planning is done by those who will implement.
Weaknesses: Most managers are severely overburdened already, unable to find resources in time and people to apply to opportunities; also, there is a lot of additional risk in market development done in-house from the ground up.
Strategic Value Proposition
O’Connor & Partners LLC offers a relatively risk-free, variable-cost alternative to the normal way of developing new chemical processes and products, for companies seeking long-term business sustainability and flexibility. In addition to many of the benefits already outlined in this plan, O’Connor & Partners can greatly enhance a company’s reach and extend its position into conversations that might otherwise never have taken place. Also, we can approach alliances, vendors, and channels on a confidential basis, gathering information and making initial contacts in a manner that is not possible with the client managers directly.
In terms of net cost or NPV, the key value proposition of our services is that we pay for ourselves plus a healthy return on the client’s investment. It is not unreasonable to suppose that in some projects the effective value we bring to the client is several-fold more than what we were paid in fees. From day one, our clients will be assured that our top-level people will do the actual work.
5.1 Marketing Strategy
We want to maintain a professional image, delivering high relative value while enjoying a comfortable, working relationship with clients. Although some confidential customers of ours will not promote us by word of mouth, it can be assumed that a client with a bad experience will freely communicate that message to other companies.
5.1.1 Pricing Strategy
O’Connor & Partners is priced lower than some prominent management-consulting firms but higher than most individual consultants usually charge. Billing rates can be negotiated somewhat at the early stages of the business, to generate sales. Generally, we need to avoid the temptation to drop fees to gain jobs, however. When a potential client questions the cost of a project, we need to be able to clearly explain the benefits of our high-level does not expertise. If their budget is reduced, then we must offer less service. Compensation by equity building will only be done after a thorough, careful evaluation of the client’s business, and we might turn down jobs if it does not make sense to work on an equity-only basis.
5.1.2 Promotion Strategy
Our firm will be promoted through publishing articles in trade journals and engineering magazines, and presenting at relevant conferences attended by members of the potential client pool. Another form of reputation building, as a branding strategy, includes media opportunities at trade shows or other events. Direct mail, e-mail, and a strong internet presence will all play a part in the promotion strategy.
It is likely that the first job will be an assignment with the current employer of the firm’s founder, Cargill Dow, which would minimize the effect of non-compete agreements initially. Also, the largest does not today is arguably Cargill Dow, clearly a desired long-term client.
5.1.3 Marketing Programs
Marketing activities to be undertaken:
Summer 2003–This is when feelers are sent out to see what potential clients might have interest in consulting services; discussions and network building to begin.
Fall 2003–Network building continues, with emphasis on building an initial Affiliate Network; attendance at industrial-biotechnology conferences and trade shows.
December 2003–Brochures sent out by mail and e-mail (PDF) to top prospective clients, along with offer to come give a free seminar at their site in Jan. 2004; attendance at all relevant conferences and trade shows.
January 2004–Seminars at clients; attendance at all relevant conferences and trade shows, with presentations/posters where possible; continue direct mailing of brochures.
Spring 2004–While most of time will be engaged in client work, there is still much marketing to be done, and time is available for it; continue with activities similar to previous 6 months.
5.1.4 Positioning Statement
For chemical manufacturers and others who want to enter the does not industry, O’Connor & Partners offers very specialized professional expertise through an extensive network of expert affiliates along with the principal consultant’s own industrial-biotechnology experience. Unlike in-house teams, our services can be applied to technical and market-entry problems as a variable, temporary expense.
5.2 Sales Strategy
We must always be aware of the general consulting phenomenon of the split between selling the job and fulfilling the job, which can lead to client dissatisfaction. The job should be developed and scoped, sold, and fulfilled by the same partner. Our clients should never buy a job from one partner and have it delivered by anybody other than that same partner.
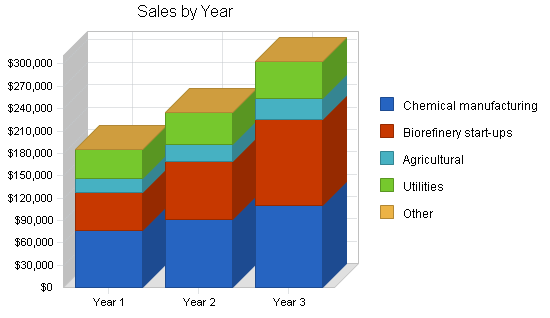
5.2.1 Sales Forecast
The sales in the first month (Jan. 2004) are assumed to be 80 billable hours for both Ryan O’Connor and the associate. (This business will not be launched unless there is a signed contract for at least 40 hours during month 1 of the business.) Monthly sales during 2004 are assumed to grow slowly for all sectors except for does not start-ups, which are slightly higher. Annual sales-growth assumptions (for 2004 to 2006) are as follows: moderate for chemical manufacturing, appreciable for does not start-ups, moderate for agriculture, and slow for utilities. These figures may appear aggressive, but they are consistent with market-growth estimates for the next several years. In order for the total industry revenue to reach the estimated $280 billion/yr by 2013, there must be average growth of approximately 50% annually. The ramp-up of our firm is thus more conservative than these estimates. The direct cost of sales increases slightly each year for supplies, sales/marketing, depreciation/interest, and overhead.
According to this table, the gross profits in years 1, 2, and 3 are increasing steadily. These figures do not include salary (see Section 6). Venture efficiency, the fraction of potential income billed and received, is about median at start-up, improving overall for 2004 through 2006. These figures neglect billable hours for the secretary (e.g., report preparation). Also, outsourcing work to the Affiliate Network brings in extra income so that the real venture efficiencies could be less than these estimates, while maintaining the same effective income. Finally, vacation hours are covered in the overhead category, so that 99% efficiency does not mean that 99% of all possible hours (in each of 52 weeks) are actually billed.
According to this plan, a third consultant would need to be hired toward the end of 2006. These calculations can easily be modified to include a team larger than two consultants right at start-up. The risk rises, but so does the profit potential as well as the possibility of growing the firm faster due to a catalytic effect on sales.

| Sales Forecast | |||
| Year 1 | Year 2 | Year 3 | |
| Sales | |||
| Chemical manufacturing | $76,402 | $91,683 | $110,019 |
| Biorefinery start-ups | $51,322 | $76,983 | $115,475 |
| Agricultural | $19,101 | $22,921 | $27,505 |
| Utilities | $38,201 | $43,931 | $50,521 |
| Other | $0 | $0 | $0 |
| Total Sales | $185,026 | $235,518 | $303,520 |
| Direct Cost of Sales | Year 1 | Year 2 | Year 3 |
| Supplies | $12,000 | $12,600 | $13,230 |
| Sales & Marketing | $6,000 | $6,300 | $6,615 |
| Interest & Depreciation | $6,000 | $6,300 | $6,615 |
| Overhead | $48,000 | $52,800 | $58,080 |
| Other | $0 | $0 | $0 |
| Subtotal Direct Cost of Sales | $72,000 | $78,000 | $84,540 |
Management Summary
The initial management team depends on the founder himself, with little direct back-up. There will be a Board of Advisors, made up of the investors plus a few key members of the Affiliate Network, that will help make management decisions. The business is immediately scalable, and the founder has several recruits in mind that would be valuable additions to the firm. The organizational structure will eventually include several partners at an equal level, with junior-level associates reporting to those partners. If a revised plan calls for more immediate partners, and/or as the firm grows with the new industry, attracting top-quality management personnel should not be excessively difficult.
6.1 Personnel Plan
In addition to the founding partner, Ryan O’Connor, an associate consultant and a secretary will be hired at the outset. As we grow, we will hire on additional consultants, an accountant, a marketing person (including web design), and other staff professionals if necessary. The 2004 salary schedule is presented in the following table. The monthly total payroll is also shown. Salaries of partners grows at a healthy annual rate, while those of other positions are assumed to grow at a lower annual percentage (for the purposes of this plan). The base compensation of all partners will be the same. In the future, a bonus system (rewarding sales generation and other initiatives of the firm) could be developed.
The Profit and Loss table shows the increase in sales, gross margin, and operating expenses, relative to the 2004 baseline year.
Sales increase faster than operating expenses, because the largest operating expense is salary. Sales are assumed to gradually increase during the three-year period without a drastic increase in salary, since the work can be done without new hires.
| Personnel Plan | |||
| Year 1 | Year 2 | Year 3 | |
| Ryan O’Connor | $96,000 | $105,600 | $116,160 |
| Other | $0 | $0 | $0 |
| Total People | 0 | 0 | 0 |
| Total Payroll | $96,000 | $105,600 | $116,160 |
Financial Plan
The initial cash balance is substantial after start-up expenses. According to this business plan, the cash balance bottoms out at about in the seventh month of operation. Cash flow enters positive territory during month eight (August 2004). The net worth of the company is estimated to grow steadly through 2006. At the end of 2006, a dividend may need to be paid out to the equity investors, if they choose to exit the venture.
7.1 Projected Profit and Loss
During the first month of operation, the gross margin is positive but the net profit is negative, as a loss occurs. The first profitable month is July 2004, the seventh month of business. As sales ramp up, the monthly gross margin rises through December 2004. For the first year overall, the gross margin is good and the net profit is meager, according to the financial plan. As consulting sales continue to increase, year two and three imorove profitability. Net profit over the three-year period is moderate. The pro forma profit-and-loss statement for 2004-2006 is show below. See the Appendix for the monthly profit-and-loss table for 2004.


| Pro Forma Profit and Loss | |||
| Year 1 | Year 2 | Year 3 | |
| Sales | $185,026 | $235,518 | $303,520 |
| Direct Cost of Sales | $72,000 | $78,000 | $84,540 |
| Other Costs of Sales | $0 | $0 | $0 |
| Total Cost of Sales | $72,000 | $78,000 | $84,540 |
| Gross Margin | $113,026 | $157,518 | $218,980 |
| Gross Margin % | 61.09% | 66.88% | 72.15% |
| Expenses | |||
| Payroll | $96,000 | $105,600 | $116,160 |
| Sales and Marketing and Other Expenses | $0 | $0 | $0 |
| Depreciation | $0 | $0 | $0 |
| Rent | $0 | $0 | $0 |
| Utilities | $0 | $0 | $0 |
| Insurance | $0 | $0 | $0 |
| Payroll Taxes | $14,400 | $15,840 | $17,424 |
| Other | $0 | $0 | $0 |
| Total Operating Expenses | $110,400 | $121,440 | $133,584 |
| Profit Before Interest and Taxes | $2,626 | $36,078 | $85,396 |
| EBITDA | $2,626 | $36,078 | $85,396 |
| Interest Expense | $0 | $0 | $0 |
| Taxes Incurred | $437 | $9,020 | $21,705 |
| Other Income | |||
| Interest Income | $0 | $0 | $0 |
| Other Income Account Name | $0 | $0 | $0 |
| Total Other Income | $0 | $0 | $0 |
| Other Expense | |||
| Account Name | $0 | $0 | $0 |
| Other Expense Account Name | $0 | $0 | $0 |
| Total Other Expense | $0 | $0 | $0 |
| Net Other Income | $0 | $0 | $0 |
| Net Profit | $2,190 | $27,059 | $63,691 |
| Net Profit/Sales | 1.18% | 11.49% | 20.98% |
7.2 Important Assumptions
The financial plan depends on important assumptions, some of which are shown in th General Assumptions table as annual assumptions. Section 5.2 includes many of the sales-specific assumptions.
7.3 Break-even Analysis
The following Break-even Analysis shows the break-even point for the business in necessary revenue. Neglecting outsourcing surcharges or other sources of revenue, 102 hours would need to be billed (if partner and associate hours were equal). This amount of consulting service represents 59% of the potential monthly billable hours.

| Break-even Analysis | |
| Monthly Revenue Break-even | $15,061 |
| Assumptions: | |
| Average Percent Variable Cost | 39% |
| Estimated Monthly Fixed Cost | $9,200 |
7.4 Projected Cash Flow
The annual cash flow is highlighted in the next table. The monthly numbers for 2004 are depicted in the Appendix). The net cash flow is worst (most negative) for month two, February 2004. Cash flow becomes positive in September 2004. The net cash flow for 2004 is negative overall. The cash balance at the end of 2006 is respectable.

| Pro Forma Cash Flow | |||
| Year 1 | Year 2 | Year 3 | |
| Cash Received | |||
| Cash from Operations | |||
| Cash Sales | $46,257 | $58,880 | $75,880 |
| Cash from Receivables | $108,426 | $168,358 | $216,488 |
| Subtotal Cash from Operations | $154,682 | $227,237 | $292,368 |
| Additional Cash Received | |||
| Non Operating (Other) Income | $0 | $0 | $0 |
| Sales Tax, VAT, HST/GST Received | $0 | $0 | $0 |
| New Current Borrowing | $0 | $0 | $0 |
| New Other Liabilities (interest-free) | $0 | $0 | $0 |
| New Long-term Liabilities | $0 | $0 | $0 |
| Sales of Other Current Assets | $0 | $0 | $0 |
| Sales of Long-term Assets | $0 | $0 | $0 |
| New Investment Received | $0 | $0 | $0 |
| Subtotal Cash Received | $154,682 | $227,237 | $292,368 |
| Expenditures | Year 1 | Year 2 | Year 3 |
| Expenditures from Operations | |||
| Cash Spending | $96,000 | $105,600 | $116,160 |
| Bill Payments | $78,423 | $102,819 | $121,958 |
| Subtotal Spent on Operations | $174,423 | $208,419 | $238,118 |
| Additional Cash Spent | |||
| Non Operating (Other) Expense | $0 | $0 | $0 |
| Sales Tax, VAT, HST/GST Paid Out | $0 | $0 | $0 |
| Principal Repayment of Current Borrowing | $0 | $0 | $0 |
| Other Liabilities Principal Repayment | $0 | $0 | $0 |
| Long-term Liabilities Principal Repayment | $0 | $0 | $0 |
| Purchase Other Current Assets | $0 | $0 | $0 |
| Purchase Long-term Assets | $0 | $0 | $0 |
| Dividends | $0 | $0 | $0 |
| Subtotal Cash Spent | $174,423 | $208,419 | $238,118 |
| Net Cash Flow | ($19,741) | $18,819 | $54,249 |
| Cash Balance | $20,259 | $39,078 | $93,327 |
7.5 Projected Balance Sheet
The pro forma balance sheet follows. The net worth of O’Connor & Partners increases steadily from the end of 2004 to 2006 year-end.
| Pro Forma Balance Sheet | |||
| Year 1 | Year 2 | Year 3 | |
| Assets | |||
| Current Assets | |||
| Cash | $20,259 | $39,078 | $93,327 |
| Accounts Receivable | $30,344 | $38,624 | $49,777 |
| Other Current Assets | $0 | $0 | $0 |
| Total Current Assets | $50,603 | $77,702 | $143,104 |
| Long-term Assets | |||
| Long-term Assets | $0 | $0 | $0 |
| Accumulated Depreciation | $0 | $0 | $0 |
| Total Long-term Assets | $0 | $0 | $0 |
| Total Assets | $50,603 | $77,702 | $143,104 |
| Liabilities and Capital | Year 1 | Year 2 | Year 3 |
| Current Liabilities | |||
| Accounts Payable | $8,413 | $8,454 | $10,165 |
| Current Borrowing | $0 | $0 | $0 |
| Other Current Liabilities | $0 | $0 | $0 |
| Subtotal Current Liabilities | $8,413 | $8,454 | $10,165 |
| Long-term Liabilities | $0 | $0 | $0 |
| Total Liabilities | $8,413 | $8,454 | $10,165 |
| Paid-in Capital | $50,000 | $50,000 | $50,000 |
| Retained Earnings | ($10,000) | ($7,810) | $19,248 |
| Earnings | $2,190 | $27,059 | $63,691 |
| Total Capital | $42,190 | $69,248 | $132,939 |
| Total Liabilities and Capital | $50,603 | $77,702 | $143,104 |
| Net Worth | $42,190 | $69,248 | $132,939 |
7.6 Business Ratios
Industy ratios for the Process, Physical, Distribution and Logistics Consulting industry, NAICS code 541614, are shown in comparison to the ratios calculated from the financial forecasts of this plan.
| Ratio Analysis | ||||
| Year 1 | Year 2 | Year 3 | Industry Profile | |
| Sales Growth | 0.00% | 27.29% | 28.87% | 7.23% |
| Percent of Total Assets | ||||
| Accounts Receivable | 59.96% | 49.71% | 34.78% | 19.36% |
| Other Current Assets | 0.00% | 0.00% | 0.00% | 50.02% |
| Total Current Assets | 100.00% | 100.00% | 100.00% | 70.95% |
| Long-term Assets | 0.00% | 0.00% | 0.00% | 29.05% |
| Total Assets | 100.00% | 100.00% | 100.00% | 100.00% |
| Current Liabilities | 16.63% | 10.88% | 7.10% | 33.87% |
| Long-term Liabilities | 0.00% | 0.00% | 0.00% | 15.64% |
| Total Liabilities | 16.63% | 10.88% | 7.10% | 49.51% |
| Net Worth | 83.37% | 89.12% | 92.90% | 50.49% |
| Percent of Sales | ||||
| Sales | 100.00% | 100.00% | 100.00% | 100.00% |
| Gross Margin | 61.09% | 66.88% | 72.15% | 24.27% |
| Selling, General & Administrative Expenses | 60.02% | 55.39% | 51.05% | 11.90% |
| Advertising Expenses | 0.00% | 0.00% | 0.00% | 0.57% |
| Profit Before Interest and Taxes | 1.42% | 15.32% | 28.14% | 0.87% |
| Main Ratios | ||||
| Current | 6.01 | 9.19 | 14.08 | 1.61 |
| Quick | 6.01 | 9.19 | 14.08 | 1.32 |
| Total Debt to Total Assets | 16.63% | 10.88% | 7.10% | 56.90% |
| Pre-tax Return on Net Worth | 6.22% | 52.10% | 64.24% | 2.84% |
| Pre-tax Return on Assets | 5.19% | 46.43% | 59.67% | 6.59% |
| Additional Ratios | Year 1 | Year 2 | Year 3 | |
| Net Profit Margin | 1.18% | 11.49% | 20.98% | n.a |
| Return on Equity | 5.19% | 39.07% | 47.91% | n.a |
| Activity Ratios | ||||
| Accounts Receivable Turnover | 4.57 | 4.57 | 4.57 | n.a |
| Collection Days | 56 | 71 | 71 | n.a |
| Accounts Payable Turnover | 10.32 | 12.17 | 12.17 | n.a |
| Payment Days | 27 | 30 | 27 | n.a |
| Total Asset Turnover | 3.66 | 3.03 | 2.12 | n.a |
| Debt Ratios | ||||
| Debt to Net Worth | 0.20 | 0.12 | 0.08 | n.a |
| Current Liab. to Liab. | 1.00 | 1.00 | 1.00 | n.a |
| Liquidity Ratios | ||||
| Net Working Capital | $42,190 | $69,248 | $132,939 | n.a |
| Interest Coverage | 0.00 | 0.00 | 0.00 | n.a |
| Additional Ratios | ||||
| Assets to Sales | 0.27 | 0.33 | 0.47 | n.a |
| Current Debt/Total Assets | 17% | 11% | 7% | n.a |
| Acid Test | 2.41 | 4.62 | 9.18 | n.a |
| Sales/Net Worth | 4.39 | 3.40 | 2.28 | n.a |
| Dividend Payout | 0.00 | 0.00 | 0.00 | n.a |
Appendix
| Sales Forecast | |||||||||||||
| Month 1 | Month 2 | Month 3 | Month 4 | Month 5 | Month 6 | Month 7 | Month 8 | Month 9 | Month 10 | Month 11 | Month 12 | ||
| Sales | |||||||||||||
| Chemical manufacturing | 0% | $4,800 | $5,040 | $5,292 | $5,557 | $5,834 | $6,126 | $6,432 | $6,754 | $7,092 | $7,446 | $7,819 | $8,210 |
| Biorefinery start-ups | 0% | $2,400 | $2,640 | $2,904 | $3,194 | $3,514 | $3,865 | $4,252 | $4,677 | $5,145 | $5,659 | $6,225 | $6,847 |
| Agricultural | 0% | $1,200 | $1,260 | $1,323 | $1,389 | $1,459 | $1,532 | $1,608 | $1,689 | $1,773 | $1,862 | $1,955 | $2,052 |
| Utilities | 0% | $2,400 | $2,520 | $2,646 | $2,778 | $2,917 | $3,063 | $3,216 | $3,377 | $3,546 | $3,723 | $3,909 | $4,105 |
| Other | 0% | $0 | $0 | $0 | $0 | $0 | $0 | $0 | $0 | $0 | $0 | $0 | $0 |
| Total Sales | $10,800 | $11,460 | $12,165 | $12,918 | $13,724 | $14,586 | $15,509 | $16,497 | $17,555 | $18,690 | $19,908 | $21,214 | |
| Direct Cost of Sales | Month 1 | Month 2 | Month 3 | Month 4 | Month 5 | Month 6 | Month 7 | Month 8 | Month 9 | Month 10 | Month 11 | Month 12 | |
| Supplies | $1,000 | $1,000 | $1,000 | $1,000 | $1,000 | $1,000 | $1,000 | $1,000 | $1,000 | $1,000 | $1,000 | $1,000 | |
| Sales & Marketing | $500 | $500 | $500 | $500 | $500 | $500 | $500 | $500 | $500 | $500 | $500 | $500 | |
| Interest & Depreciation | $500 | $500 | $500 | $500 | $500 | $500 | $500 | $500 | $500 | $500 | $500 | $500 | |
| Overhead | $4,000 | $4,000 | $4,000 | $4,000 | $4,000 | $4,000 | $4,000 | $4,000 | $4,000 | $4,000 | $4,000 | $4,000 | |
| Other | $0 | $0 | $0 | $0 | $0 | $0 | $0 | $0 | $0 | $0 | $0 | $0 | |
| Subtotal Direct Cost of Sales | $6,000 | $6,000 | $6,000 | $6,000 | $6,000 | $6,000 | $6,000 | $6,000 | $6,000 | $6,000 | $6,000 | $6,000 | |
| Personnel Plan | |||||||||||||
| Month 1 | Month 2 | Month 3 | Month 4 | Month 5 | Month 6 | Month 7 | Month 8 | Month 9 | Month 10 | Month 11 | Month 12 | ||
| Ryan O’Connor | 0% | $8,000 | $8,000 | $8,000 | $8,000 | $8,000 | $8,000 | $8,000 | $8,000 | $8,000 | $8,000 | $8,000 | $8,000 |
| Other | 0% | $0 | $0 | $0 | $0 | $0 | $0 | $0 | $0 | $0 | $0 | $0 | $0 |
| Total People | 0 | 0 | 0 | 0 | 0 | 0 | 0 | 0 | 0 | 0 | 0 | 0 | |
| Total Payroll | $8,000 | $8,000 | $8,000 | $8,000 | $8,000 | $8,000 | $8,000 | $8,000 | $8,000 | $8,000 | $8,000 | $8,000 | |
| General Assumptions | |||||||||||||
| Month 1 | Month 2 | Month 3 | Month 4 | Month 5 | Month 6 | Month 7 | Month 8 | Month 9 | Month 10 | Month 11 | Month 12 | ||
| Plan Month | 1 | 2 | 3 | 4 | 5 | 6 | 7 | 8 | 9 | 10 | 11 | 12 | |
| Current Interest Rate | 7.00% | 7.00% | 7.00% | 7.00% | 7.00% | 7.00% | 7.00% | 7.00% | 7.00% | 7.00% | 7.00% | 7.00% | |
| Long-term Interest Rate | 6.00% | 6.00% | 6.00% | 6.00% | 6.00% | 6.00% | 6.00% | 6.00% | 6.00% | 6.00% | 6.00% | 6.00% | |
| Tax Rate | 30.00% | 25.00% | 25.00% | 25.00% | 25.00% | 25.00% | 25.00% | 25.00% | 25.00% | 25.00% | 25.00% | 25.00% | |
| Other | 0 | 0 | 0 | 0 | 0 | 0 | 0 | 0 | 0 | 0 | 0 | 0 | |
| Pro Forma Profit and Loss | |||||||||||||
| Month 1 | Month 2 | Month 3 | Month 4 | Month 5 | Month 6 | Month 7 | Month 8 | Month 9 | Month 10 | Month 11 | Month 12 | ||
| Sales | $10,800 | $11,460 | $12,165 | $12,918 | $13,724 | $14,586 | $15,509 | $16,497 | $17,555 | $18,690 | $19,908 | $21,214 | |
| Direct Cost of Sales | $6,000 | $6,000 | $6,000 | $6,000 | $6,000 | $6,000 | $6,000 | $6,000 | $6,000 | $6,000 | $6,000 | $6,000 | |
| Other Costs of Sales | $0 | $0 | $0 | $0 | $0 | $0 | $0 | $0 | $0 | $0 | $0 | $0 | |
| Total Cost of Sales | $6,000 | $6,000 | $6,000 | $6,000 | $6,000 | $6,000 | $6,000 | $6,000 | $6,000 | $6,000 | $6,000 | $6,000 | |
| Gross Margin | $4,800 | $5,460 | $6,165 | $6,918 | $7,724 | $8,586 | $9,509 | $10,497 | $11,555 | $12,690 | $13,908 | $15,214 | |
| Gross Margin % | 44.44% | 47.64% | 50.68% | 53.55% | 56.28% | 58.86% | 61.31% | 63.63% | 65.82% | 67.90% | 69.86% | 71.72% | |
| Expenses | |||||||||||||
| Payroll | $8,000 | $8,000 | $8,000 | $8,000 | $8,000 | $8,000 | $8,000 | $8,000 | $8,000 | $8,000 | $8,000 | $8,000 | |
| Sales and Marketing and Other Expenses | $0 | $0 | $0 | $0 | $0 | $0 | $0 | $0 | $0 | $0 | $0 | $0 | |
| Depreciation | $0 | $0 | $0 | $0 | $0 | $0 | $0 | $0 | $0 | $0 | $0 | $0 | |
| Rent | $0 | $0 | $0 | $0 | $0 | $0 | $0 | $0 | $0 | $0 | $0 | $0 | |
| Utilities | $0 | $0 | $0 | $0 | $0 | $0 | $0 | $0 | $0 | $0 | $0 | $0 | |
| Insurance | $0 | $0 | $0 | $0 | $0 | $0 | $0 | $0 | $0 | $0 | $0 | $0 | |
| Payroll Taxes | 15% | $1,200 | $1,200 | $1,200 | $1,200 | $1,200 | $1,200 | $1,200 | $1,200 | $1,200 | $1,200 | $1,200 | $1,200 |
| Other | $0 | $0 | $0 | $0 | $0 | $0 | $0 | $0 | $0 | $0 | $0 | $0 | |
| Total Operating Expenses | $9,200 | $9,200 | $9,200 | $9,200 | $9,200 | $9,200 | $9,200 | $9,200 | $9,200 | $9,200 | $9,200 | $9,200 | |
| Profit Before Interest and Taxes | ($4,400) | ($3,740) | ($3,035) | ($2,282) | ($1,476) | ($614) | $309 | $1,297 | $2,355 | $3,490 | $4,708 | $6,014 | |
| EBITDA | ($4,400) | ($3,740) | ($3,035) | ($2,282) | ($1,476) | ($614) | $309 | $1,297 | $2,355 | $3,490 | $4,708 | $6,014 | |
| Interest Expense | $0 | $0 | $0 | $0 | $0 | $0 | $0 | $0 | $0 | $0 | $0 | $0 | |
| Taxes Incurred | ($1,320) | ($935) | ($759) | ($570) | ($369) | ($154) | $77 | $324 | $589 | $873 | $1,177 | $1,504 | |
| Other Income | |||||||||||||
| Interest Income | $0 | $0 | $0 | $0 | $0 | $0 | $0 | $0 | $0 | $0 | $0 | $0 | |
| Other Income Account Name | $0 | $0 | $0 | $0 | $0 | $0 | $0 | $0 | $0 | $0 | $0 | $0 | |
| Total Other Income | $0 | $0 | $0 | $0 | $0 | $0 | $0 | $0 | $0 | $0 | $0 | $0 | |
| Other Expense | |||||||||||||
| Account Name | $0 | $0 | $0 | $0 | $0 | $0 | $0 | $0 | $0 | $0 | $0 | $0 | |
| Other Expense Account Name | $0 | $0 | $0 | $0 | $0 | $0 | $0 | $0 | $0 | $0 | $0 | $0 | |
| Total Other Expense | $0 | $0 | $0 | $0 | $0 | $0 | $0 | $0 | $0 | $0 | $0 | $0 | |
| Net Other Income | $0 | $0 | $0 | $0 | $0 | $0 | $0 | $0 | $0 | $0 | $0 | $0 | |
| Net Profit | ($3,080) | ($2,805) | ($2,276) | ($1,711) | ($1,107) | ($461) | $231 | $972 | $1,766 | $2,618 | $3,531 | $4,511 | |
| Net Profit/Sales | -28.52% | -24.48% | -18.71% | -13.25% | -8.07% | -3.16% | 1.49% | 5.89% | 10.06% | 14.01% | 17.74% | 21.26% | |
| Pro Forma Cash Flow | |||||||||||||
| Month 1 | Month 2 | Month 3 | Month 4 | Month 5 | Month 6 | Month 7 | Month 8 | Month 9 | Month 10 | Month 11 | Month 12 | ||
| Cash Received | |||||||||||||
| Cash from Operations | |||||||||||||
| Cash Sales | $2,700 | $2,865 | $3,041 | $3,230 | $3,431 | $3,646 | $3,877 | $4,124 | $4,389 | $4,673 | $4,977 | $5,304 | |
| Cash from Receivables | $0 | $270 | $8,117 | $8,613 | $9,143 | $9,709 | $10,315 | $10,963 | $11,656 | $12,399 | $13,195 | $14,048 | |
| Subtotal Cash from Operations | $2,700 | $3,135 | $11,158 | $11,842 | $12,574 | $13,355 | $14,192 | $15,087 | $16,045 | $17,071 | $18,172 | $19,352 | |
| Additional Cash Received | |||||||||||||
| Non Operating (Other) Income | $0 | $0 | $0 | $0 | $0 | $0 | $0 | $0 | $0 | $0 | $0 | $0 | |
| Sales Tax, VAT, HST/GST Received | 0.00% | $0 | $0 | $0 | $0 | $0 | $0 | $0 | $0 | $0 | $0 | $0 | $0 |
| New Current Borrowing | $0 | $0 | $0 | $0 | $0 | $0 | $0 | $0 | $0 | $0 | $0 | $0 | |
| New Other Liabilities (interest-free) | $0 | $0 | $0 | $0 | $0 | $0 | $0 | $0 | $0 | $0 | $0 | $0 | |
| New Long-term Liabilities | $0 | $0 | $0 | $0 | $0 | $0 | $0 | $0 | $0 | $0 | $0 | $0 | |
| Sales of Other Current Assets | $0 | $0 | $0 | $0 | $0 | $0 | $0 | $0 | $0 | $0 | $0 | $0 | |
| Sales of Long-term Assets | $0 | $0 | $0 | $0 | $0 | $0 | $0 | $0 | $0 | $0 | $0 | $0 | |
| New Investment Received | $0 | $0 | $0 | $0 | $0 | $0 | $0 | $0 | $0 | $0 | $0 | $0 | |
| Subtotal Cash Received | $2,700 | $3,135 | $11,158 | $11,842 | $12,574 | $13,355 | $14,192 | $15,087 | $16,045 | $17,071 | $18,172 | $19,352 | |
| Expenditures | Month 1 | Month 2 | Month 3 | Month 4 | Month 5 | Month 6 | Month 7 | Month 8 | Month 9 | Month 10 | Month 11 | Month 12 | |
| Expenditures from Operations | |||||||||||||
| Cash Spending | $8,000 | $8,000 | $8,000 | $8,000 | $8,000 | $8,000 | $8,000 | $8,000 | $8,000 | $8,000 | $8,000 | $8,000 | |
| Bill Payments | $196 | $5,893 | $6,271 | $6,448 | $6,636 | $6,838 | $7,054 | $7,285 | $7,533 | $7,798 | $8,083 | $8,388 | |
| Subtotal Spent on Operations | $8,196 | $13,893 | $14,271 | $14,448 | $14,636 | $14,838 | $15,054 | $15,285 | $15,533 | $15,798 | $16,083 | $16,388 | |
| Additional Cash Spent | |||||||||||||
| Non Operating (Other) Expense | $0 | $0 | $0 | $0 | $0 | $0 | $0 | $0 | $0 | $0 | $0 | $0 | |
| Sales Tax, VAT, HST/GST Paid Out | $0 | $0 | $0 | $0 | $0 | $0 | $0 | $0 | $0 | $0 | $0 | $0 | |
| Principal Repayment of Current Borrowing | $0 | $0 | $0 | $0 | $0 | $0 | $0 | $0 | $0 | $0 | $0 | $0 | |
| Other Liabilities Principal Repayment | $0 | $0 | $0 | $0 | $0 | $0 | $0 | $0 | $0 | $0 | $0 | $0 | |
| Long-term Liabilities Principal Repayment | $0 | $0 | $0 | $0 | $0 | $0 | $0 | $0 | $0 | $0 | $0 | $0 | |
| Purchase Other Current Assets | $0 | $0 | $0 | $0 | $0 | $0 | $0 | $0 | $0 | $0 | $0 | $0 | |
| Purchase Long-term Assets | $0 | $0 | $0 | $0 | $0 | $0 | $0 | $0 | $0 | $0 | $0 | $0 | |
| Dividends | $0 | $0 | $0 | $0 | $0 | $0 | $0 | $0 | $0 | $0 | $0 | $0 | |
| Subtotal Cash Spent | $8,196 | $13,893 | $14,271 | $14,448 | $14,636 | $14,838 | $15,054 | $15,285 | $15,533 | $15,798 | $16,083 | $16,388 | |
| Net Cash Flow | ($5,496) | ($10,758) | ($3,113) | ($2,605) | ($2,063) | ($1,483) | ($862) | ($199) | $512 | $1,273 | $2,089 | $2,964 | |
| Cash Balance | $34,504 | $23,746 | $20,633 | $18,028 | $15,965 | $14,482 | $13,620 | $13,421 | $13,933 | $15,206 | $17,295 | $20,259 | |
| Pro Forma Balance Sheet | |||||||||||||
| Month 1 | Month 2 | Month 3 | Month 4 | Month 5 | Month 6 | Month 7 | Month 8 | Month 9 | Month 10 | Month 11 | Month 12 | ||
| Assets | Starting Balances | ||||||||||||
| Current Assets | |||||||||||||
| Cash | $40,000 | $34,504 | $23,746 | $20,633 | $18,028 | $15,965 | $14,482 | $13,620 | $13,421 | $13,933 | $15,206 | $17,295 | $20,259 |
| Accounts Receivable | $0 | $8,100 | $16,425 | $17,432 | $18,508 | $19,659 | $20,889 | $22,206 | $23,616 | $25,126 | $26,745 | $28,481 | $30,344 |
| Other Current Assets | $0 | $0 | $0 | $0 | $0 | $0 | $0 | $0 | $0 | $0 | $0 | $0 | $0 |
| Total Current Assets | $40,000 | $42,604 | $40,171 | $38,065 | $36,536 | $35,624 | $35,372 | $35,826 | $37,037 | $39,060 | $41,952 | $45,777 | $50,603 |
| Long-term Assets | |||||||||||||
| Long-term Assets | $0 | $0 | $0 | $0 | $0 | $0 | $0 | $0 | $0 | $0 | $0 | $0 | $0 |
| Accumulated Depreciation | $0 | $0 | $0 | $0 | $0 | $0 | $0 | $0 | $0 | $0 | $0 | $0 | $0 |
| Total Long-term Assets | $0 | $0 | $0 | $0 | $0 | $0 | $0 | $0 | $0 | $0 | $0 | $0 | $0 |
| Total Assets | $40,000 | $42,604 | $40,171 | $38,065 | $36,536 | $35,624 | $35,372 | $35,826 | $37,037 | $39,060 | $41,952 | $45,777 | $50,603 |
| Liabilities and Capital | Month 1 | Month 2 | Month 3 | Month 4 | Month 5 | Month 6 | Month 7 | Month 8 | Month 9 | Month 10 | Month 11 | Month 12 | |
| Current Liabilities | |||||||||||||
| Accounts Payable | $0 | $5,684 | $6,056 | $6,227 | $6,409 | $6,603 | $6,812 | $7,035 | $7,273 | $7,529 | $7,803 | $8,098 | $8,413 |
| Current Borrowing | $0 | $0 | $0 | $0 | $0 | $0 | $0 | $0 | $0 | $0 | $0 | $0 | $0 |
| Other Current Liabilities | $0 | $0 | $0 | $0 | $0 | $0 | $0 | $0 | $0 | $0 | $0 | $0 | $0 |
| Subtotal Current Liabilities | $0 | $5,684 | $6,056 | $6,227 | $6,409 | $6,603 | $6,812 | $7,035 | $7,273 | $7,529 | $7,803 | $8,098 | $8,413 |
| Long-term Liabilities | $0 | $0 | $0 | $0 | $0 | $0 | $0 | $0 | $0 | $0 | $0 | $0 | $0 |
| Total Liabilities | $0 | $5,684 | $6,056 | $6,227 | $6,409 | $6,603 | $6,812 | $7,035 | $7,273 | $7,529 | $7,803 | $8,098 | $8,413 |
| Paid-in Capital | $50,000 | $50,000 | $50,000 | $50,000 | $50,000 | $50,000 | $50,000 | $50,000 | $50,000 | $50,000 | $50,000 | $50,000 | $50,000 |
| Retained Earnings | ($10,000) | ($10,000) | ($10,000) | ($10,000) | ($10,000) | ($10,000) | ($10,000) | ($10,000) | ($10,000) | ($10,000) | ($10,000) | ($10,000) | ($10,000) |
| Earnings | $0 | ($3,080) | ($5,885) | ($8,161) | ($9,872) | ($10,979) | ($11,440) | ($11,208) | ($10,236) | ($8,470) | ($5,852) | ($2,321) | $2,190 |
| Total Capital | $40,000 | $36,920 | $34,115 | $31,839 | $30,128 | $29,021 | $28,560 | $28,792 | $29,764 | $31,530 | $34,148 | $37,679 | $42,190 |
| Total Liabilities and Capital | $40,000 | $42,604 | $40,171 | $38,065 | $36,536 | $35,624 | $35,372 | $35,826 | $37,037 | $39,060 | $41,952 | $45,777 | $50,603 |
| Net Worth | $40,000 | $36,920 | $34,115 | $31,839 | $30,128 | $29,021 | $28,560 | $28,792 | $29,764 | $31,530 | $34,148 | $37,679 | $42,190 |

