
Pioneer Consulting
Executive Summary
A marketing plan must be a “winner.” If the plan does not help management to gain market share, increase sales, lower marketing costs or otherwise “win”, the plan is a waste of time. This is crucial for small businesses that must get the highest return on every marketing dollar spent. Pioneer Marketing will provides its clients with a broad range of “winning” marketing consulting services. These services include strategic planning as well as tactical implementation. Strategic planning utilizes those processes that lead to an executable marketing plan including identifying areas of opportunity, market segmentation, product line analysis, financial planning, competitive analysis, and culminate in the design of a project implementation plan. This will serve as a detailed road map for the planning and supervision of all marketing activities. Once completed, the tactical process is initiated leading to the real-world execution of the plan.
Pioneer Consulting consists of five graduate students from the Marshall School of Management at State University. Marshall’s Marketing Program is ranked in the top 15 in the country and its graduates have gone on to take positions with the nation’s largest marketing firms. The members of Pioneer Consulting won this year’s Andrew Stiegman Marketing Competition. This prestigious award is given each year to the best strategic marketing plan for a proposed small business. Teams from the region’s five graduate marketing programs submitted proposals that were then evaluated by a panel of top marketing professionals.
The target client of Pioneer Consulting is the small business that can rarely afford the cost of contracting the services of a marketing firm to maximize the effectiveness of their marketing expenditures. Pioneer Consulting will be a results-driven marketing firm. We provide a complete range of services. This allows us to evaluate a variety of marketing communications tools, choosing those that are best suited to the client’s requirements. We then combine those tools in such a way so as to create meaningful, effective marketing for optimal results.
1.1 Mission
Our primary focus is to work closely with clients and help them succeed in setting and meeting their marketing goals. We offer total support and a commitment to communicate their ideas in a strategic, creative, and cost-effective manner.
1.2 Keys to Success
- Have the technical expertise to minimize the learning curve for our clients and minimize their expenses.
- Be a part of our client’s business team.
- Insure the timely launch of each client’s marketing program.
- Generate new innovative strategies for our clients that result in a high-quality and cost-effective product.
Company Summary
Pioneer Consulting consists of five Masters program students from the Marshall School of Management at State University.
2.1 Company Ownership
Pioneer Consulting’s co-owners are Susan Noyes, Elizabeth Rayburn, Issac Harris, Al Takemoto, and Chris Pin.
2.2 Start-up Summary
Pioneer Consulting’s co-owners will each invest $200. The start-up costs are primarily for marketing material and a company cell phone and messaging service.

| Start-up | |
| Requirements | |
| Start-up Expenses | |
| Legal | $100 |
| Stationery etc. | $150 |
| Brochures | $300 |
| Cell Phone Setup | $100 |
| Other | $0 |
| Total Start-up Expenses | $650 |
| Start-up Assets | |
| Cash Required | $350 |
| Other Current Assets | $0 |
| Long-term Assets | $0 |
| Total Assets | $350 |
| Total Requirements | $1,000 |
| Start-up Funding | |
| Start-up Expenses to Fund | $650 |
| Start-up Assets to Fund | $350 |
| Total Funding Required | $1,000 |
| Assets | |
| Non-cash Assets from Start-up | $0 |
| Cash Requirements from Start-up | $350 |
| Additional Cash Raised | $0 |
| Cash Balance on Starting Date | $350 |
| Total Assets | $350 |
| Liabilities and Capital | |
| Liabilities | |
| Current Borrowing | $0 |
| Long-term Liabilities | $0 |
| Accounts Payable (Outstanding Bills) | $0 |
| Other Current Liabilities (interest-free) | $0 |
| Total Liabilities | $0 |
| Capital | |
| Planned Investment | |
| Susan Noyes | $200 |
| Elizabeth Rayburn | $200 |
| Issac Harris | $200 |
| Al Takemoto | $200 |
| Chris Pin | $200 |
| Additional Investment Requirement | $0 |
| Total Planned Investment | $1,000 |
| Loss at Start-up (Start-up Expenses) | ($650) |
| Total Capital | $350 |
| Total Capital and Liabilities | $350 |
| Total Funding | $1,000 |
Services
Pioneer Consulting will offer the following services:
- Development and preparation of strategic marketing plans and programs.
- Key market segment identification plans and programs.
- Design of overall advertising/public relations strategies.
- Industry trend analysis.
- Execution of marketing implementation plans and programs.
Market Analysis Summary
Pioneer Consulting will be focusing on a very specific part of the business market:
- Small Start-up Companies.
- Existing Small Businesses.
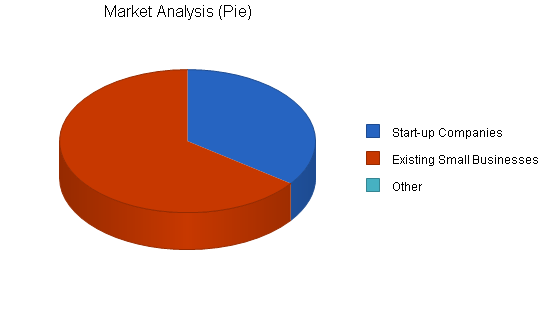
4.1 Market Segmentation
Pioneer Consulting will focus on two groups of businesses:
- Small Start-up Companies – These small start-up businesses can rarely afford marketing consulting services and don’t have the in-house expertise to create strategic marketing plans. Their focus is always on getting a product or service out to customers. The city is growing at a rate of 10% annually and the numbers of start-ups increase each year in all the city’s major industries and service areas. Pioneer Consulting believes that this is an underserved market segment and that they could provide an invaluable service to these target clients.
- Existing Small Businesses – These companies have already reached some limited success and are planning to expand their operations. Typically, they haven’t used marketing consulting services in the past. Perhaps the success of their product or service is only hiding marketing problems in the operation that will emerge as greater pressure is placed on the company performance. Each stage of growth in a company presents challenges that can hurt its performance and success. Pioneer Consulting can provide these companies a focused marketing approach that is responsive to unique client demands, assisting them in achieving their future sales goals.
| Market Analysis | |||||||
| Year 1 | Year 2 | Year 3 | Year 4 | Year 5 | |||
| Potential Customers | Growth | CAGR | |||||
| Start-up Companies | 15% | 130 | 150 | 173 | 199 | 229 | 15.21% |
| Existing Small Businesses | 10% | 240 | 264 | 290 | 319 | 351 | 9.97% |
| Other | 0% | 0 | 0 | 0 | 0 | 0 | 0.00% |
| Total | 11.89% | 370 | 414 | 463 | 518 | 580 | 11.89% |
Strategy and Implementation Summary
Pioneer Consulting will focus on the small start-up companies and existing small businesses that need marketing consulting but heretofore could not afford outsourcing the development of strategic marketing plans.
5.1 Competitive Edge
Pioneer Consulting’s competitive advantage is twofold:
- Pioneer Consulting is targeting customers that the large professional marketing consulting firms don’t actively pursue. There is no direct competition to Pioneer Consulting’s services.
- The broad range of services that Pioneer Consulting can provide to its customers.
5.2 Sales Strategy
Pioneer Consulting’s sales strategy will be based on systematic person-to-person contacts with new and growing businesses. A list of potential customers has already been compiled and will serve as a launching pad for marketing the group’s services.
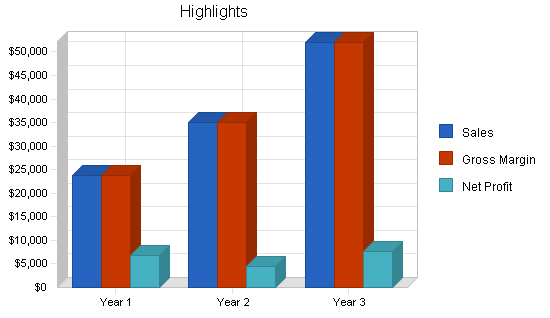
5.2.1 Sales Forecast
The following table and chart highlight forecasted sales for three years.

| Sales Forecast | |||
| Year 1 | Year 2 | Year 3 | |
| Sales | |||
| Start-up Businesses | $9,550 | $15,000 | $22,000 |
| Existing Small Businesses | $14,300 | $20,000 | $30,000 |
| Total Sales | $23,850 | $35,000 | $52,000 |
| Direct Cost of Sales | Year 1 | Year 2 | Year 3 |
| Start-up Businesses | $0 | $0 | $0 |
| Existing Small Businesses | $0 | $0 | $0 |
| Subtotal Direct Cost of Sales | $0 | $0 | $0 |
Management Summary
Pioneer Consulting will be managed by project managers Susan Noyes and Issac Harris.
Susan Noyes was co-leader of the marketing team that won this year’s Andrew Stiegman Marketing Competition. Susan has worked for MediaHound as a marketing assistant for the past three years and has participated in number of successful direct-mail campaigns.
Issac Harris worked for Dynamic Marketing Research as a research assistant for two years before entering Marshall School of Management’s Marketing Graduate Program. He was also co-leader of the marketing team that won this year’s Andrew Stiegman Marketing Competition.
The remaining team members are:
- Elizabeth Rayburn – Elizabeth has three years of experience in media marketing as a former employee of Premier Marketing Consultants.
- Al Takemoto – Al’s skill focus is Internet and e-mail marketing. He has worked as a staff member of Gold Online Marketing Services for three years prior to his admission to Marshall School of Management.
- Chris Pin – Chris has been a marketing assistant at Quick Silver Advertising for the past two years. His area of expertise is print advertising.
6.1 Personnel Plan
Pioneer Consulting will have a staff of five, the co-founders. They will pay themselves a moderate straight salary beginning with the fourth month after start-up.

| Personnel Plan | |||
| Year 1 | Year 2 | Year 3 | |
| Susan Noyes | $2,400 | $4,800 | $7,000 |
| Elizabeth Rayburn | $2,400 | $4,800 | $7,000 |
| Issac Harris | $2,400 | $4,800 | $7,000 |
| Al Takemoto | $2,400 | $4,800 | $7,000 |
| Chris Pin | $2,400 | $4,800 | $7,000 |
| Total People | 0 | 0 | 0 |
| Total Payroll | $12,000 | $24,000 | $35,000 |
Financial Plan
The following sections will present the break-even analysis, profit and loss, cash flow, and the balance sheet.
7.1 Break-even Analysis
The Break-even Analysis is laid out in the following table and chart.

| Break-even Analysis | |
| Monthly Revenue Break-even | $1,190 |
| Assumptions: | |
| Average Percent Variable Cost | 0% |
| Estimated Monthly Fixed Cost | $1,190 |
7.2 Projected Profit and Loss
The following table will indicate projected profit and loss for three years.


| Pro Forma Profit and Loss | |||
| Year 1 | Year 2 | Year 3 | |
| Sales | $23,850 | $35,000 | $52,000 |
| Direct Cost of Sales | $0 | $0 | $0 |
| Other Production Expenses | $0 | $0 | $0 |
| Total Cost of Sales | $0 | $0 | $0 |
| Gross Margin | $23,850 | $35,000 | $52,000 |
| Gross Margin % | 100.00% | 100.00% | 100.00% |
| Expenses | |||
| Payroll | $12,000 | $24,000 | $35,000 |
| Sales and Marketing and Other Expenses | $0 | $500 | $500 |
| Depreciation | $0 | $0 | $0 |
| Cell Phone | $480 | $480 | $480 |
| Utilities | $0 | $0 | $0 |
| Insurance | $0 | $0 | $0 |
| Rent | $0 | $0 | $0 |
| Payroll Taxes | $1,800 | $3,600 | $5,250 |
| Other | $0 | $0 | $0 |
| Total Operating Expenses | $14,280 | $28,580 | $41,230 |
| Profit Before Interest and Taxes | $9,570 | $6,420 | $10,770 |
| EBITDA | $9,570 | $6,420 | $10,770 |
| Interest Expense | $0 | $0 | $0 |
| Taxes Incurred | $2,871 | $1,926 | $3,231 |
| Net Profit | $6,699 | $4,494 | $7,539 |
| Net Profit/Sales | 28.09% | 12.84% | 14.50% |
7.3 Projected Cash Flow
The following chart and table indicates projected cash flow.

| Pro Forma Cash Flow | |||
| Year 1 | Year 2 | Year 3 | |
| Cash Received | |||
| Cash from Operations | |||
| Cash Sales | $5,963 | $8,750 | $13,000 |
| Cash from Receivables | $14,643 | $24,733 | $36,687 |
| Subtotal Cash from Operations | $20,605 | $33,483 | $49,687 |
| Additional Cash Received | |||
| Sales Tax, VAT, HST/GST Received | $0 | $0 | $0 |
| New Current Borrowing | $0 | $0 | $0 |
| New Other Liabilities (interest-free) | $0 | $0 | $0 |
| New Long-term Liabilities | $0 | $0 | $0 |
| Sales of Other Current Assets | $0 | $0 | $0 |
| Sales of Long-term Assets | $0 | $0 | $0 |
| New Investment Received | $0 | $0 | $0 |
| Subtotal Cash Received | $20,605 | $33,483 | $49,687 |
| Expenditures | Year 1 | Year 2 | Year 3 |
| Expenditures from Operations | |||
| Cash Spending | $12,000 | $24,000 | $35,000 |
| Bill Payments | $4,863 | $6,259 | $9,218 |
| Subtotal Spent on Operations | $16,863 | $30,259 | $44,218 |
| Additional Cash Spent | |||
| Sales Tax, VAT, HST/GST Paid Out | $0 | $0 | $0 |
| Principal Repayment of Current Borrowing | $0 | $0 | $0 |
| Other Liabilities Principal Repayment | $0 | $0 | $0 |
| Long-term Liabilities Principal Repayment | $0 | $0 | $0 |
| Purchase Other Current Assets | $0 | $0 | $0 |
| Purchase Long-term Assets | $0 | $0 | $0 |
| Dividends | $0 | $0 | $0 |
| Subtotal Cash Spent | $16,863 | $30,259 | $44,218 |
| Net Cash Flow | $3,742 | $3,224 | $5,469 |
| Cash Balance | $4,092 | $7,316 | $12,785 |
7.4 Projected Balance Sheet
The following is the projected balance sheet for three years.
| Pro Forma Balance Sheet | |||
| Year 1 | Year 2 | Year 3 | |
| Assets | |||
| Current Assets | |||
| Cash | $4,092 | $7,316 | $12,785 |
| Accounts Receivable | $3,245 | $4,762 | $7,075 |
| Other Current Assets | $0 | $0 | $0 |
| Total Current Assets | $7,337 | $12,078 | $19,860 |
| Long-term Assets | |||
| Long-term Assets | $0 | $0 | $0 |
| Accumulated Depreciation | $0 | $0 | $0 |
| Total Long-term Assets | $0 | $0 | $0 |
| Total Assets | $7,337 | $12,078 | $19,860 |
| Liabilities and Capital | Year 1 | Year 2 | Year 3 |
| Current Liabilities | |||
| Accounts Payable | $288 | $535 | $778 |
| Current Borrowing | $0 | $0 | $0 |
| Other Current Liabilities | $0 | $0 | $0 |
| Subtotal Current Liabilities | $288 | $535 | $778 |
| Long-term Liabilities | $0 | $0 | $0 |
| Total Liabilities | $288 | $535 | $778 |
| Paid-in Capital | $1,000 | $1,000 | $1,000 |
| Retained Earnings | ($650) | $6,049 | $10,543 |
| Earnings | $6,699 | $4,494 | $7,539 |
| Total Capital | $7,049 | $11,543 | $19,082 |
| Total Liabilities and Capital | $7,337 | $12,078 | $19,860 |
| Net Worth | $7,049 | $11,543 | $19,082 |
7.5 Business Ratios
The following table provides important ratios for the real estate industry, as determined by the Standard Industry Classification (SIC) Index, 7319, Advertising, nec.
| Ratio Analysis | ||||
| Year 1 | Year 2 | Year 3 | Industry Profile | |
| Sales Growth | 0.00% | 46.75% | 48.57% | 8.50% |
| Percent of Total Assets | ||||
| Accounts Receivable | 44.23% | 39.43% | 35.63% | 36.10% |
| Other Current Assets | 0.00% | 0.00% | 0.00% | 42.70% |
| Total Current Assets | 100.00% | 100.00% | 100.00% | 80.20% |
| Long-term Assets | 0.00% | 0.00% | 0.00% | 19.80% |
| Total Assets | 100.00% | 100.00% | 100.00% | 100.00% |
| Current Liabilities | 3.93% | 4.43% | 3.92% | 46.70% |
| Long-term Liabilities | 0.00% | 0.00% | 0.00% | 9.80% |
| Total Liabilities | 3.93% | 4.43% | 3.92% | 56.50% |
| Net Worth | 96.07% | 95.57% | 96.08% | 43.50% |
| Percent of Sales | ||||
| Sales | 100.00% | 100.00% | 100.00% | 100.00% |
| Gross Margin | 100.00% | 100.00% | 100.00% | 0.00% |
| Selling, General & Administrative Expenses | 71.91% | 87.16% | 85.50% | 79.10% |
| Advertising Expenses | 0.00% | 1.43% | 0.96% | 4.20% |
| Profit Before Interest and Taxes | 40.13% | 18.34% | 20.71% | 1.60% |
| Main Ratios | ||||
| Current | 25.47 | 22.59 | 25.54 | 1.70 |
| Quick | 25.47 | 22.59 | 25.54 | 1.43 |
| Total Debt to Total Assets | 3.93% | 4.43% | 3.92% | 56.50% |
| Pre-tax Return on Net Worth | 135.76% | 55.62% | 56.44% | 4.60% |
| Pre-tax Return on Assets | 130.43% | 53.16% | 54.23% | 10.50% |
| Additional Ratios | Year 1 | Year 2 | Year 3 | |
| Net Profit Margin | 28.09% | 12.84% | 14.50% | n.a |
| Return on Equity | 95.03% | 38.93% | 39.51% | n.a |
| Activity Ratios | ||||
| Accounts Receivable Turnover | 5.51 | 5.51 | 5.51 | n.a |
| Collection Days | 57 | 56 | 55 | n.a |
| Accounts Payable Turnover | 17.88 | 12.17 | 12.17 | n.a |
| Payment Days | 27 | 23 | 25 | n.a |
| Total Asset Turnover | 3.25 | 2.90 | 2.62 | n.a |
| Debt Ratios | ||||
| Debt to Net Worth | 0.04 | 0.05 | 0.04 | n.a |
| Current Liab. to Liab. | 1.00 | 1.00 | 1.00 | n.a |
| Liquidity Ratios | ||||
| Net Working Capital | $7,049 | $11,543 | $19,082 | n.a |
| Interest Coverage | 0.00 | 0.00 | 0.00 | n.a |
| Additional Ratios | ||||
| Assets to Sales | 0.31 | 0.35 | 0.38 | n.a |
| Current Debt/Total Assets | 4% | 4% | 4% | n.a |
| Acid Test | 14.21 | 13.68 | 16.44 | n.a |
| Sales/Net Worth | 3.38 | 3.03 | 2.73 | n.a |
| Dividend Payout | 0.00 | 0.00 | 0.00 | n.a |
Appendix
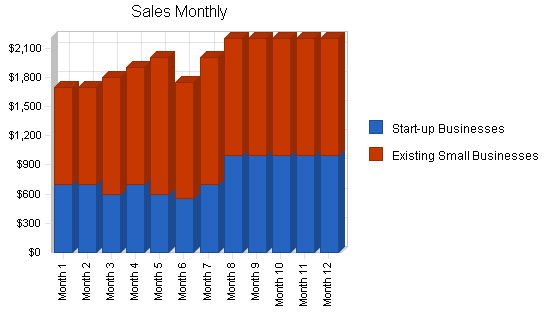
| Sales Forecast | |||||||||||||
| Month 1 | Month 2 | Month 3 | Month 4 | Month 5 | Month 6 | Month 7 | Month 8 | Month 9 | Month 10 | Month 11 | Month 12 | ||
| Sales | |||||||||||||
| Start-up Businesses | 0% | $700 | $700 | $600 | $700 | $600 | $550 | $700 | $1,000 | $1,000 | $1,000 | $1,000 | $1,000 |
| Existing Small Businesses | 0% | $1,000 | $1,000 | $1,200 | $1,200 | $1,400 | $1,200 | $1,300 | $1,200 | $1,200 | $1,200 | $1,200 | $1,200 |
| Total Sales | $1,700 | $1,700 | $1,800 | $1,900 | $2,000 | $1,750 | $2,000 | $2,200 | $2,200 | $2,200 | $2,200 | $2,200 | |
| Direct Cost of Sales | Month 1 | Month 2 | Month 3 | Month 4 | Month 5 | Month 6 | Month 7 | Month 8 | Month 9 | Month 10 | Month 11 | Month 12 | |
| Start-up Businesses | $0 | $0 | $0 | $0 | $0 | $0 | $0 | $0 | $0 | $0 | $0 | $0 | |
| Existing Small Businesses | $0 | $0 | $0 | $0 | $0 | $0 | $0 | $0 | $0 | $0 | $0 | $0 | |
| Subtotal Direct Cost of Sales | $0 | $0 | $0 | $0 | $0 | $0 | $0 | $0 | $0 | $0 | $0 | $0 | |
| Personnel Plan | |||||||||||||
| Month 1 | Month 2 | Month 3 | Month 4 | Month 5 | Month 6 | Month 7 | Month 8 | Month 9 | Month 10 | Month 11 | Month 12 | ||
| Susan Noyes | 0% | $0 | $0 | $0 | $200 | $200 | $200 | $200 | $200 | $200 | $400 | $400 | $400 |
| Elizabeth Rayburn | 0% | $0 | $0 | $0 | $200 | $200 | $200 | $200 | $200 | $200 | $400 | $400 | $400 |
| Issac Harris | 0% | $0 | $0 | $0 | $200 | $200 | $200 | $200 | $200 | $200 | $400 | $400 | $400 |
| Al Takemoto | 0% | $0 | $0 | $0 | $200 | $200 | $200 | $200 | $200 | $200 | $400 | $400 | $400 |
| Chris Pin | 0% | $0 | $0 | $0 | $200 | $200 | $200 | $200 | $200 | $200 | $400 | $400 | $400 |
| Total People | 0 | 0 | 0 | 0 | 0 | 0 | 0 | 0 | 0 | 0 | 0 | 0 | |
| Total Payroll | $0 | $0 | $0 | $1,000 | $1,000 | $1,000 | $1,000 | $1,000 | $1,000 | $2,000 | $2,000 | $2,000 | |
| General Assumptions | |||||||||||||
| Month 1 | Month 2 | Month 3 | Month 4 | Month 5 | Month 6 | Month 7 | Month 8 | Month 9 | Month 10 | Month 11 | Month 12 | ||
| Plan Month | 1 | 2 | 3 | 4 | 5 | 6 | 7 | 8 | 9 | 10 | 11 | 12 | |
| Current Interest Rate | 10.00% | 10.00% | 10.00% | 10.00% | 10.00% | 10.00% | 10.00% | 10.00% | 10.00% | 10.00% | 10.00% | 10.00% | |
| Long-term Interest Rate | 10.00% | 10.00% | 10.00% | 10.00% | 10.00% | 10.00% | 10.00% | 10.00% | 10.00% | 10.00% | 10.00% | 10.00% | |
| Tax Rate | 30.00% | 30.00% | 30.00% | 30.00% | 30.00% | 30.00% | 30.00% | 30.00% | 30.00% | 30.00% | 30.00% | 30.00% | |
| Other | 0 | 0 | 0 | 0 | 0 | 0 | 0 | 0 | 0 | 0 | 0 | 0 | |
| Pro Forma Profit and Loss | |||||||||||||
| Month 1 | Month 2 | Month 3 | Month 4 | Month 5 | Month 6 | Month 7 | Month 8 | Month 9 | Month 10 | Month 11 | Month 12 | ||
| Sales | $1,700 | $1,700 | $1,800 | $1,900 | $2,000 | $1,750 | $2,000 | $2,200 | $2,200 | $2,200 | $2,200 | $2,200 | |
| Direct Cost of Sales | $0 | $0 | $0 | $0 | $0 | $0 | $0 | $0 | $0 | $0 | $0 | $0 | |
| Other Production Expenses | $0 | $0 | $0 | $0 | $0 | $0 | $0 | $0 | $0 | $0 | $0 | $0 | |
| Total Cost of Sales | $0 | $0 | $0 | $0 | $0 | $0 | $0 | $0 | $0 | $0 | $0 | $0 | |
| Gross Margin | $1,700 | $1,700 | $1,800 | $1,900 | $2,000 | $1,750 | $2,000 | $2,200 | $2,200 | $2,200 | $2,200 | $2,200 | |
| Gross Margin % | 100.00% | 100.00% | 100.00% | 100.00% | 100.00% | 100.00% | 100.00% | 100.00% | 100.00% | 100.00% | 100.00% | 100.00% | |
| Expenses | |||||||||||||
| Payroll | $0 | $0 | $0 | $1,000 | $1,000 | $1,000 | $1,000 | $1,000 | $1,000 | $2,000 | $2,000 | $2,000 | |
| Sales and Marketing and Other Expenses | $0 | $0 | $0 | $0 | $0 | $0 | $0 | $0 | $0 | $0 | $0 | $0 | |
| Depreciation | $0 | $0 | $0 | $0 | $0 | $0 | $0 | $0 | $0 | $0 | $0 | $0 | |
| Cell Phone | $40 | $40 | $40 | $40 | $40 | $40 | $40 | $40 | $40 | $40 | $40 | $40 | |
| Utilities | $0 | $0 | $0 | $0 | $0 | $0 | $0 | $0 | $0 | $0 | $0 | $0 | |
| Insurance | $0 | $0 | $0 | $0 | $0 | $0 | $0 | $0 | $0 | $0 | $0 | $0 | |
| Rent | $0 | $0 | $0 | $0 | $0 | $0 | $0 | $0 | $0 | $0 | $0 | $0 | |
| Payroll Taxes | 15% | $0 | $0 | $0 | $150 | $150 | $150 | $150 | $150 | $150 | $300 | $300 | $300 |
| Other | $0 | $0 | $0 | $0 | $0 | $0 | $0 | $0 | $0 | $0 | $0 | $0 | |
| Total Operating Expenses | $40 | $40 | $40 | $1,190 | $1,190 | $1,190 | $1,190 | $1,190 | $1,190 | $2,340 | $2,340 | $2,340 | |
| Profit Before Interest and Taxes | $1,660 | $1,660 | $1,760 | $710 | $810 | $560 | $810 | $1,010 | $1,010 | ($140) | ($140) | ($140) | |
| EBITDA | $1,660 | $1,660 | $1,760 | $710 | $810 | $560 | $810 | $1,010 | $1,010 | ($140) | ($140) | ($140) | |
| Interest Expense | $0 | $0 | $0 | $0 | $0 | $0 | $0 | $0 | $0 | $0 | $0 | $0 | |
| Taxes Incurred | $498 | $498 | $528 | $213 | $243 | $168 | $243 | $303 | $303 | ($42) | ($42) | ($42) | |
| Net Profit | $1,162 | $1,162 | $1,232 | $497 | $567 | $392 | $567 | $707 | $707 | ($98) | ($98) | ($98) | |
| Net Profit/Sales | 68.35% | 68.35% | 68.44% | 26.16% | 28.35% | 22.40% | 28.35% | 32.14% | 32.14% | -4.45% | -4.45% | -4.45% | |
| Pro Forma Cash Flow | |||||||||||||
| Month 1 | Month 2 | Month 3 | Month 4 | Month 5 | Month 6 | Month 7 | Month 8 | Month 9 | Month 10 | Month 11 | Month 12 | ||
| Cash Received | |||||||||||||
| Cash from Operations | |||||||||||||
| Cash Sales | $425 | $425 | $450 | $475 | $500 | $438 | $500 | $550 | $550 | $550 | $550 | $550 | |
| Cash from Receivables | $0 | $43 | $1,275 | $1,278 | $1,353 | $1,428 | $1,494 | $1,319 | $1,505 | $1,650 | $1,650 | $1,650 | |
| Subtotal Cash from Operations | $425 | $468 | $1,725 | $1,753 | $1,853 | $1,865 | $1,994 | $1,869 | $2,055 | $2,200 | $2,200 | $2,200 | |
| Additional Cash Received | |||||||||||||
| Sales Tax, VAT, HST/GST Received | 0.00% | $0 | $0 | $0 | $0 | $0 | $0 | $0 | $0 | $0 | $0 | $0 | $0 |
| New Current Borrowing | $0 | $0 | $0 | $0 | $0 | $0 | $0 | $0 | $0 | $0 | $0 | $0 | |
| New Other Liabilities (interest-free) | $0 | $0 | $0 | $0 | $0 | $0 | $0 | $0 | $0 | $0 | $0 | $0 | |
| New Long-term Liabilities | $0 | $0 | $0 | $0 | $0 | $0 | $0 | $0 | $0 | $0 | $0 | $0 | |
| Sales of Other Current Assets | $0 | $0 | $0 | $0 | $0 | $0 | $0 | $0 | $0 | $0 | $0 | $0 | |
| Sales of Long-term Assets | $0 | $0 | $0 | $0 | $0 | $0 | $0 | $0 | $0 | $0 | $0 | $0 | |
| New Investment Received | $0 | $0 | $0 | $0 | $0 | $0 | $0 | $0 | $0 | $0 | $0 | $0 | |
| Subtotal Cash Received | $425 | $468 | $1,725 | $1,753 | $1,853 | $1,865 | $1,994 | $1,869 | $2,055 | $2,200 | $2,200 | $2,200 | |
| Expenditures | Month 1 | Month 2 | Month 3 | Month 4 | Month 5 | Month 6 | Month 7 | Month 8 | Month 9 | Month 10 | Month 11 | Month 12 | |
| Expenditures from Operations | |||||||||||||
| Cash Spending | $0 | $0 | $0 | $1,000 | $1,000 | $1,000 | $1,000 | $1,000 | $1,000 | $2,000 | $2,000 | $2,000 | |
| Bill Payments | $18 | $538 | $539 | $563 | $404 | $431 | $361 | $435 | $493 | $487 | $298 | $298 | |
| Subtotal Spent on Operations | $18 | $538 | $539 | $1,563 | $1,404 | $1,431 | $1,361 | $1,435 | $1,493 | $2,487 | $2,298 | $2,298 | |
| Additional Cash Spent | |||||||||||||
| Sales Tax, VAT, HST/GST Paid Out | $0 | $0 | $0 | $0 | $0 | $0 | $0 | $0 | $0 | $0 | $0 | $0 | |
| Principal Repayment of Current Borrowing | $0 | $0 | $0 | $0 | $0 | $0 | $0 | $0 | $0 | $0 | $0 | $0 | |
| Other Liabilities Principal Repayment | $0 | $0 | $0 | $0 | $0 | $0 | $0 | $0 | $0 | $0 | $0 | $0 | |
| Long-term Liabilities Principal Repayment | $0 | $0 | $0 | $0 | $0 | $0 | $0 | $0 | $0 | $0 | $0 | $0 | |
| Purchase Other Current Assets | $0 | $0 | $0 | $0 | $0 | $0 | $0 | $0 | $0 | $0 | $0 | $0 | |
| Purchase Long-term Assets | $0 | $0 | $0 | $0 | $0 | $0 | $0 | $0 | $0 | $0 | $0 | $0 | |
| Dividends | $0 | $0 | $0 | $0 | $0 | $0 | $0 | $0 | $0 | $0 | $0 | $0 | |
| Subtotal Cash Spent | $18 | $538 | $539 | $1,563 | $1,404 | $1,431 | $1,361 | $1,435 | $1,493 | $2,487 | $2,298 | $2,298 | |
| Net Cash Flow | $407 | ($71) | $1,186 | $190 | $449 | $435 | $633 | $434 | $562 | ($287) | ($98) | ($98) | |
| Cash Balance | $757 | $687 | $1,873 | $2,063 | $2,511 | $2,946 | $3,579 | $4,013 | $4,575 | $4,288 | $4,190 | $4,092 | |
| Pro Forma Balance Sheet | |||||||||||||
| Month 1 | Month 2 | Month 3 | Month 4 | Month 5 | Month 6 | Month 7 | Month 8 | Month 9 | Month 10 | Month 11 | Month 12 | ||
| Assets | Starting Balances | ||||||||||||
| Current Assets | |||||||||||||
| Cash | $350 | $757 | $687 | $1,873 | $2,063 | $2,511 | $2,946 | $3,579 | $4,013 | $4,575 | $4,288 | $4,190 | $4,092 |
| Accounts Receivable | $0 | $1,275 | $2,508 | $2,583 | $2,730 | $2,878 | $2,763 | $2,769 | $3,100 | $3,245 | $3,245 | $3,245 | $3,245 |
| Other Current Assets | $0 | $0 | $0 | $0 | $0 | $0 | $0 | $0 | $0 | $0 | $0 | $0 | $0 |
| Total Current Assets | $350 | $2,032 | $3,194 | $4,455 | $4,793 | $5,389 | $5,708 | $6,348 | $7,113 | $7,820 | $7,533 | $7,435 | $7,337 |
| Long-term Assets | |||||||||||||
| Long-term Assets | $0 | $0 | $0 | $0 | $0 | $0 | $0 | $0 | $0 | $0 | $0 | $0 | $0 |
| Accumulated Depreciation | $0 | $0 | $0 | $0 | $0 | $0 | $0 | $0 | $0 | $0 | $0 | $0 | $0 |
| Total Long-term Assets | $0 | $0 | $0 | $0 | $0 | $0 | $0 | $0 | $0 | $0 | $0 | $0 | $0 |
| Total Assets | $350 | $2,032 | $3,194 | $4,455 | $4,793 | $5,389 | $5,708 | $6,348 | $7,113 | $7,820 | $7,533 | $7,435 | $7,337 |
| Liabilities and Capital | Month 1 | Month 2 | Month 3 | Month 4 | Month 5 | Month 6 | Month 7 | Month 8 | Month 9 | Month 10 | Month 11 | Month 12 | |
| Current Liabilities | |||||||||||||
| Accounts Payable | $0 | $520 | $520 | $549 | $390 | $419 | $346 | $419 | $477 | $477 | $288 | $288 | $288 |
| Current Borrowing | $0 | $0 | $0 | $0 | $0 | $0 | $0 | $0 | $0 | $0 | $0 | $0 | $0 |
| Other Current Liabilities | $0 | $0 | $0 | $0 | $0 | $0 | $0 | $0 | $0 | $0 | $0 | $0 | $0 |
| Subtotal Current Liabilities | $0 | $520 | $520 | $549 | $390 | $419 | $346 | $419 | $477 | $477 | $288 | $288 | $288 |
| Long-term Liabilities | $0 | $0 | $0 | $0 | $0 | $0 | $0 | $0 | $0 | $0 | $0 | $0 | $0 |
| Total Liabilities | $0 | $520 | $520 | $549 | $390 | $419 | $346 | $419 | $477 | $477 | $288 | $288 | $288 |
| Paid-in Capital | $1,000 | $1,000 | $1,000 | $1,000 | $1,000 | $1,000 | $1,000 | $1,000 | $1,000 | $1,000 | $1,000 | $1,000 | $1,000 |
| Retained Earnings | ($650) | ($650) | ($650) | ($650) | ($650) | ($650) | ($650) | ($650) | ($650) | ($650) | ($650) | ($650) | ($650) |
| Earnings | $0 | $1,162 | $2,324 | $3,556 | $4,053 | $4,620 | $5,012 | $5,579 | $6,286 | $6,993 | $6,895 | $6,797 | $6,699 |
| Total Capital | $350 | $1,512 | $2,674 | $3,906 | $4,403 | $4,970 | $5,362 | $5,929 | $6,636 | $7,343 | $7,245 | $7,147 | $7,049 |
| Total Liabilities and Capital | $350 | $2,032 | $3,194 | $4,455 | $4,793 | $5,389 | $5,708 | $6,348 | $7,113 | $7,820 | $7,533 | $7,435 | $7,337 |
| Net Worth | $350 | $1,512 | $2,674 | $3,906 | $4,403 | $4,970 | $5,362 | $5,929 | $6,636 | $7,343 | $7,245 | $7,147 | $7,049 |


