
Everywhere Assistant
Executive Summary
Everywhere Assistant is a new start up virtual assistant business. The company is a sole proprietorship with Sadie Clark as the founder and sole employee. The company was formed and will serve a diverse geographic customer segment.
The Market
Everywhere Assistant has identified three distinct market segments which will be targeted. The first segment is companies of various sizes. In the current business climate, there has been a common occurrence to have wide scale corporate downsizing. This is helpful for Everywhere Assistant because the downsizing means that people kept within the company are busier than ever. Typical in a downsizing climate there is the outsourcing of projects/jobs that the current staff cannot handle. Everywhere Assistant believes that the majority of their sales (relative to the other customer segments) will come from the companies.
The second customer segment is individuals. This is an attractive segment because as our daily lives become busier and busier we have less and less free time. Using a virtual assistant (VA) is one way to create more free time, or at least not have to do tasks that we may not prefer to. It is anticipated that the services provided to individuals will be more menial relative to the services provided to companies.
The last customer segment is not for profit organizations. These organizations, in large part due to their status as a not for profit do not have excess capital. As a consequence, they have tried to maximize employee’s tasks and responsibilities as much as possible. This means most employees are quite busy. When a random tasks comes up the organization typically does not have an employee that can just take handle the task. This is good for VA’s who can quickly and seamlessly take over tasks. This saves the company money because they are only paying for the labor needed to complete the task.
Services
Everywhere Assistant offers a wide range of services. The bulk of the services are administrative in nature, whether data entry, mailing list updates, etc. These will be the services that will be billed out at the lower end of the billing spectrum of $25-$45. Services that are billed out near the top of the range are those that require higher levels of skills such as accounting, marketing, and graphic design. In the middle will be services such as concierge services and travel arrangements which are in themselves a wide range of services. The offered services will be things that the customer does not have time for or things that they choose not to do, something they would prefer someone else to take care.
Competitive Edge
The majority of VA services are secretarial in nature. They are jobs that an administrative assistant can handle. Everywhere Assistant will be using their competitive edge of a wide range of skills to their fullest. In addition to the more menial tasks, Everywhere Assistant is able to offer clients a wide range of more technical skills such as a proficiency with QuickBooks Pro for accounting issues, graphic design with skill in both Photoshop and PageMaker, and well-honed marketing and research skills. This is a competitive edge because once a client has found a VA they have an economic incentive to continue to use them as opposed to finding someone else (assuming that they are happy with the level of service and the work product). The problem occurs when the client is happy with the VA but needs work on a project that the VA does not have skills in, consequently, the client must look elsewhere. An advantage is created when the VA (Everywhere Assistant) has a wider and more complex range of skills, they are then able to offer more value to the client.
Everywhere Assistant is an exciting application of the virtual assistant business model, providing a wide range of customer services from a remote location, leveraging the power of the Internet. This is a very efficient business model and will provide Sadie with reasonable income and the flexibility to handle the jobs when and how she chooses. The sales forecast indicates revenue will rise for year two and year three along with corresponding net profit increases.

1.1 Keys to Success
- Offer a wide range of services allowing Everywhere Assistant to handle any type of task.
- Maintain a flexible enough schedule so last minute projects can be completed.
- Ensure accurate billing and project estimates.
1.2 Mission
Everywhere Assistant’s mission is to offer the highest level of administrative assistant services from a remote location. Everywhere Assistant will be able to handle a wide range of tasks with a level of professionalism and trust that is hard to come by in today’s world. Everywhere Assistant will exceed customer’s expectations.
1.3 Objectives
- To generate over $35,000 in the first year.
- To develop enough income to make the job full time position.
- To be able to decrease the marketing expenses after couple of years because there is sufficient word of mouth projects to remain busy.
Company Summary
Everywhere Assistant has been formed as a sole proprietorship by Sadie Clark. The company will incur some start expenses detailed in section 2.2.
2.1 Company Ownership
Sadie Clark has formed Everywhere Assistant as a sole proprietorship. Sadie will invest money of her own as well as money received from her family.
2.2 Start-up Summary
The following equipment/services will be needed for purchase to allow Everywhere Assistant to begin operations:
- Windows computer
- Mac computer
- Laser printer
- Broadband Internet connection
- Scanner
- Fax machine
- Copier
- Various software including Adobe Acrobat, Photoshop and PageMaker, Microsoft Office, Word Perfect, and QuickBooks Pro
- Attorney services to develop a standard contract template for clients

| Start-up | |
| Requirements | |
| Start-up Expenses | |
| Legal | $1,000 |
| Website Development | $5,000 |
| Insurance | $50 |
| Rent | $150 |
| Total Start-up Expenses | $6,200 |
| Start-up Assets | |
| Cash Required | $16,800 |
| Other Current Assets | $0 |
| Long-term Assets | $7,000 |
| Total Assets | $23,800 |
| Total Requirements | $30,000 |
| Start-up Funding | |
| Start-up Expenses to Fund | $6,200 |
| Start-up Assets to Fund | $23,800 |
| Total Funding Required | $30,000 |
| Assets | |
| Non-cash Assets from Start-up | $7,000 |
| Cash Requirements from Start-up | $16,800 |
| Additional Cash Raised | $0 |
| Cash Balance on Starting Date | $16,800 |
| Total Assets | $23,800 |
| Liabilities and Capital | |
| Liabilities | |
| Current Borrowing | $0 |
| Long-term Liabilities | $0 |
| Accounts Payable (Outstanding Bills) | $0 |
| Other Current Liabilities (interest-free) | $0 |
| Total Liabilities | $0 |
| Capital | |
| Planned Investment | |
| Sadie | $20,000 |
| Family | $10,000 |
| Additional Investment Requirement | $0 |
| Total Planned Investment | $30,000 |
| Loss at Start-up (Start-up Expenses) | ($6,200) |
| Total Capital | $23,800 |
| Total Capital and Liabilities | $23,800 |
| Total Funding | $30,000 |
Services
Everywhere Assistant provides a wide range of administrative assistant functions from a remote location. Everywhere Assistant will serve a wide range of clients from businesses to individuals to not-for-profit organizations. The following is a list (not exhaustive) of the different services offered. Please note that as long as Sadie has the skills to complete a task, she will be willing to undertake whatever project the client may wish:
- Data entry
- Word processing
- Accounting/bookkeeping
- Marketing
- Billing
- Desktop publishing
- Travel arrangements
- Mailing services
- Research
- Maintain electronic mailing lists
- Maintain vendor files
- Concierge services
Everywhere Assistant has the ability to provide any needed service for a client. Some of the services will be tasks that the client does not have time or staff for. Other tasks may be things that the client just does not have the desire to do. Either way, Everywhere Assistant will offer a remote service to seamlessly assist clients with a wide range of tasks.

This is of considerable value to the customer. The client incurs no payroll taxes, no insurance costs as well as no fringe benefit expenses. The client is not responsible for providing office space or equipment. This is contained in Everywhere Assistant hourly rate. The hourly rate is $25-$45 depending on the activity. More menial tasks such as data entry will be billed out at $25, activities such as graphic design, accounting, and other more skilled tasks will be billed out at $45.
Everywhere Assistant will be operating out of Sadie’s home. A room has been dedicated to the business in the house and rent will be paid for the use of the room.
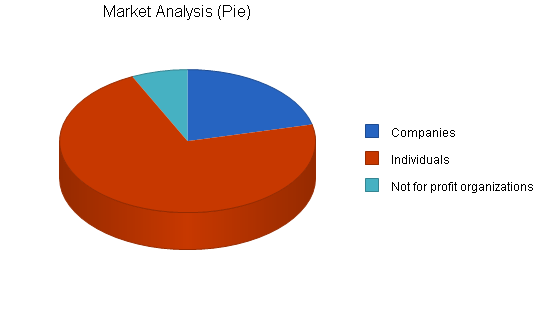
Market Analysis Summary
Everywhere Assistant has segmented the market into three attractive, distinct, customer segments. Services will targeted to companies, individuals, and not for profit organizations. Market research indicates that these are the most likely consumers of remote administrative assistants. The virtual assistant is fairly new, proliferating with the Internet which allows service providers in remote locations to serve a large geographic range of clients. Membership records within the larger virtual assistant associations indicates that there are typically 10-15 virtual assistants within each state.
4.1 Market Segmentation
Everywhere Assistant has identified three customer segments which are the most attractive for the virtual assistant industry. These segments are customers who tend to consume the largest amount of virtual assistant services.
Companies
For a variety of reason companies are an attractive segment. Some companies have been going through corporate downsizing as a means for decreasing overhead/ the burn rate. While this does assist reducing monthly expenditures, often the company soon there after realizes that were certain necessary services being provided by the personnel that were let go. Companies also use virtual assistants for projects that come up with little notice and they need a helping hand. The virtual assistants are particularly useful because the companies only pay for the services rendered, there is no continual employment or equipment overhead.
- There are 36,554 potential customers
- Sizes for companies range from small organizations of a few people to large corporations
- Some companies will use Everywhere Assistant on a random basis, others may sign Everywhere Assistant initially on a retainer basis. This arrangement is initial because once business become more full, the highest billing rate work will be sought out since the number of hours available is limited.
Individuals
Virtual assistants are also useful to may different individuals. The individuals are likely to use the assistants for tasks that they do not have time for or tasks that they simply do not enjoy. These tasks could be business related, but research indicates that many of the requested tasks are personal in nature, assisting the individual with something that they do not have time for. One unexpected tasks is trip planning. The client provides the assistant with some guidelines and the assistant performs a comprehensive search of options as well as discounts/ specials.
- Typically ages 30-55
- Median individual income is $51,000
- 91% of the individuals have a college degree
- 32% have a graduate degree
Not-for-Profit Organizations
These organizations are attractive customers because they are often in a funding crunch. They often do not have the funding to have some sort of assistant always on staff ready to do work as it comes along. The not-for-profit organizations are often as trim as possible regarding staffing. This sets up an excellent opportunity for Everywhere Assistant who can provide administrative services when needed, but are not a resource drain when there is no work. Everywhere Assistant will serve a wide range of not-for-profit organizations.
| Market Analysis | |||||||
| Year 1 | Year 2 | Year 3 | Year 4 | Year 5 | |||
| Potential Customers | Growth | CAGR | |||||
| Companies | 6% | 36,554 | 38,747 | 41,072 | 43,536 | 46,148 | 6.00% |
| Individuals | 5% | 123,554 | 129,732 | 136,219 | 143,030 | 150,182 | 5.00% |
| Not for profit organizations | 4% | 12,151 | 12,637 | 13,142 | 13,668 | 14,215 | 4.00% |
| Total | 5.15% | 172,259 | 181,116 | 190,433 | 200,234 | 210,545 | 5.15% |
4.2 Target Market Segment Strategy
The targeted customers: companies, individuals, and not for profits were chosen because they all are likely to have a need for a virtual assistant, all for different reasons. As companies continue to become as efficient as possible, they are keeping their current employees as busy as possible. Often they are to busy to take care of projects that come up randomly, that is were Everywhere Assistant comes in.
Individuals will have a demand for Everywhere Assistant for tasks that they either do not have the time for or do not want to do. This is especially true as we (Americans) have less and less free. This then fuels our desire to pick and choose the activities that we have time for or care to do, and then subcontracted out the things we do not do. Not for profits are also attractive as they are the organizations who often have the least funds so creative options to complete tasks are always considered. Everywhere Assistant allows them to have someone complete the task with out the typical overhead associated with the worker.
4.3 Service Business Analysis
Virtual Assistants is a fairly new industry that has arisen from the convenience of the Internet. The Internet created a medium where people could communicate, transfer files electronically, do research, and find people all from one’s home. In essence the Internet has created a “web” connecting people in remote locations.
The other factor that fueled the growth of virtual assistants was the downsizing of the business world. This created a lot of opportunities for virtual assistants because companies were getting slimmer and slimmer and for the small, random projects that would pop up they would just subcontract out the work. When you combine the market need for projects and the Internet as the connection to these remote people, you have a new business model.
There has also been the development of a few organizations that specifically serve virtual assistants that has assisted the growth and legitimacy of the industry. The associations have developed certification programs that has assisted growth by helping establish trust between two unknown parties. The certifications provide indications of minimum levels of skills as well as work product.
As technology increases, more and more tasks will be able to be accomplished remotely, sending the finished product electronically as well as even having face to face video conferences remotely allowing to simulate a face to face meeting, however, the two parties could be half way around the world.
4.3.1 Competition and Buying Patterns
By virtue of the nature of virtual assistants (VA), competition does not have a significant physical boundaries. While there typically is 10-20 registered/ certified VA’s per state, there is no advantage in choosing a VA from one state relative to another state. VAs therefore compete on availability, costs, work product and skill set.
If the projects are easy costs is likely going to be a main choice factor. If time is of the essence then availability will rule, lastly is the task is difficult the VA is likely to be chosen on their ability to handle the task. Please note that these considerations are primarily for the initial selection of a VA. Once a VA has been found and has been used a couple of times, it is likely that the client will not be looking for a new VA but will maintain a working relationship with the existing VA, assuming of course that the client’s satisfaction is maintained.
Strategy and Implementation Summary
Everywhere Assistant will leverage their competitive edge of having a wide range of services offered. This will be especially useful since once a client has found a VA that they are happy with they will tend to continue to use them assuming the VA can handle all of the tasks that the client has.
Everywhere Assistant’s marketing strategy will develop visibility and awareness for the company as a virtual assistant. This will be accomplished by using several marketing mediums. Lastly, Everywhere Assistant will highlight in their sales strategy the high level of customer satisfaction that Everywhere Assistant offers. This is especially important since because repeat business from a customer is likely if they are kept happy.
5.1 Competitive Edge
Everywhere Assistant’s competitive edge is the wide range of skills that they offer to clients. While many of the VA’s can offer basic administrative skills and tasks, Everywhere Assistant has an expanded selection of skills that includes accounting/bookkeeping, graphic design, and marketing.
Having the wider range of skills is significant because the nature of the industry is that once a good service provider is found the client tends to use the VA for all of the needs the VA can fill. If there are tasks that the VA cannot do the client will look elsewhere to have those tasks completed. Here in lays the danger, the possibility that the client will find a new VA, one that is more diverse and stay with the new VA. By offering a wide range of services Everywhere Assistant can be the one stop VA serving all of the client’s needs.
5.2 Marketing Strategy
Everywhere Assistant marketing strategy will seek to raise awareness of Everywhere Assistant as a premier VA. The first method that they will use is membership to the International Virtual Assistant Association (IVAA). This association offers a certification process which is useful when you are trying to sell the services over the Internet and the prospective customer does not know you.
The certification develops some degree of trust because the certification provides an indication of professionalism, acceptable work products, and appropriate skills. This will tend to speed up the process of developing trust between Everywhere Assistant and the remote client. Being a member of the association is also useful because it includes Everywhere Assistant in their VA directory. This comes into play when clients are looking for a VA an they will often visit an associations website looking for a VA and they will see Everywhere Assistant’s listing.
Everywhere Assistant will also have a website developed that will be a showcase for the services that they offer. This must be a professional site because other than phone conversations, this is the impression that is initially left on the client, the more professional the site looks, the better the image that is bestowed on Everywhere Assistant.
Everywhere Assistant will also place some advertisements in a couple newspapers. The choice of newspaper will be based on several factors:
- Low cost, high readership
- In a region that has had significant corporate downsizing
- A concentrated urban area
The effectiveness of a newspaper advertisement in somewhat unknown. The ads will be run a few times and a costs benefit analysis will be done to decide future use.
5.3 Sales Strategy
The sales strategy will be based on ensuring complete customer satisfaction. This will be addressed because the chance of repeat business is very high. This is intuitive because once you have found a remote assistant and have used them for a while a trust relationship builds where you begin to feel more and more comfortable with this new person.
There then is a decreased chance of looking for a different VA because the switching costs increase because of the time it takes to find someone new and build trust. Everywhere Assistant will be successful in developing superior customer satisfaction so that the majority of their clients will become repeat clients. As more and more business is repeat business, marketing costs fall because with a one person business, there is a finite amount of business that Everywhere Assistant can handle in a month.
The more business that is received through repeat business, the less business Everywhere Assistant will have to market them selves. Additionally, the more business that comes to Everywhere Assistant the more selective they can be (assuming they are reaching full capacity) in choosing the projects. Projects with higher billing can be chosen increasing revenue for the same amount of hours worked.
The key to customer satisfaction is ensuring that all customers are more than happy. If it turns out of the customers is not happy with the project it is worthwhile to correct the situation, even if it is costly in the short run. In the long term, the customer should be convinced to remain with Everywhere Assistant and is even likely to tell others about how Everywhere Assistant went out of their way to correct the problem. This develops incredible good will. Even if services have to be given away to ensure complete satisfaction, that short term cost will be a worthwhile investment for the long term sustainability of the business.
5.3.1 Sales Forecast
A sales forecast has been developed to measure the sales by month for the first year and yearly for years two and three. The sales forecast has been used to help predict the Break-even Point by measuring revenue against expenses.
A conservative forecast has been adopted to increase the chance of meeting the sales goals. The sales has been broken down by the specific customers as a method of tracking where the business is coming from. The following charts and graphs provide quantifiable data and graphic representations of the sales.


| Sales Forecast | |||
| Year 1 | Year 2 | Year 3 | |
| Sales | |||
| Companies | $9,414 | $18,450 | $23,450 |
| Not for profit organizations | $5,743 | $11,255 | $14,305 |
| Individuals | $5,084 | $9,963 | $12,663 |
| Total Sales | $20,240 | $39,668 | $50,418 |
| Direct Cost of Sales | Year 1 | Year 2 | Year 3 |
| Companies | $471 | $923 | $1,173 |
| Not for profit organizations | $287 | $563 | $715 |
| Individuals | $254 | $498 | $633 |
| Subtotal Direct Cost of Sales | $1,012 | $1,983 | $2,521 |
5.4 Milestones
Everywhere Assistant has chosen several different quantifiable milestones for the company. Milestones are being used as a method of setting goals as well as then tracking progress toward the attainment of the goals. The following goals have been chosen:
- Business plan completion
- First customer
- Profitability
- Full time employment
- Decreased marketing costs
Please review the following table for more detail regarding the milestones.

| Milestones | |||||
| Milestone | Start Date | End Date | Budget | Manager | Department |
| Business plan completion | 1/1/2004 | 2/15/2004 | $0 | Sadie | Busines Development |
| First customer | 2/15/2004 | 3/1/2004 | $0 | Sadie | Operations |
| Profitability | 3/1/2004 | 12/31/2004 | $0 | Sadie | Accounting |
| Full time employment | 12/31/2004 | 3/30/2005 | $0 | Sadie | Sales |
| Decreased marketing costs | 3/30/2005 | 1/30/2006 | $0 | Sadie | Marketing |
| Totals | $0 | ||||
Web Plan Summary
A website will be developed and used as a marketing tool to put a “face” on Everywhere Assistant. By virtue of the type of company that Everywhere Assistant is, the only interaction or visibility that Everywhere Assistant will have with clients is conversation over the phone, an exchange of work product, as well as viewing the website.
The website will be developed to provide information of Everywhere Assistant and the services that they offer. In addition to providing information, the website will serve as a way of creating an image or facade of Everywhere Assistant to customers who are in remote locations. Said another way, the more professional that the website is, the more professionalism that is exuded toward Everywhere Assistant. For many the website will be the first impression of Everywhere Assistant. As we all know first impressions can be quite important so Everywhere Assistant has decided to invest money into the site to ensure a professional looking site.
6.1 Website Marketing Strategy
The website will be primarily marketed through the following methods:
- Search engine submission. When someone is interested in finding a virtual assistant they will often type “virtual assistant” into a search engine such as Google! and they will receive a list of sights that have relevance to the key word. Everywhere Assistant will submit their site and applicable key words to various search engines to ensure that they are high on the list of results.
- URL on all printed material. For advertisements in the news paper or any correspondence from Everywhere Assistant, the website will be listed on the printed material encouraging people to visit the site and find more information.
- Association membership. One of the values of being a member of a VA association is being included in their directory of service provider websites. Some people will go right to the association’s web page to research various VAs. In this case they will find links to Everywhere Assistant’s site.
6.2 Development Requirements
The site will be professionally developed for the cost of $5,000.
Management Summary
Sadie Clark received her undergraduate degree in business administration from the University of Washington. Upon graduation Sadie went to work for the Microsoft Corporation supporting their marketing department. While her position had the majority of responsibilities as an administrative assistant, she was cross trained in a variety of areas including some graphic design, accounting and marketing.
This was fairly unusual for Microsoft which typically has narrow job descriptions for their employees. However, in the marketing department, it was smaller, closer knit group of people so when the group needed something done they would often have it accomplished by someone within the group. If the person did not know the skill but there was someone in the group that did, they would often train the other person which would in effect increase the flexibility of the department. It was the time spent in this department that Sadie developed her large repertoire of skills. After five years at Microsoft Sadie had a child and took two years off to raise the child.
Upon entering back into the working world, Sadie began to realize that jobs were more difficult to come by. At the same time Sadie began considering a non traditional job that would give her more flexibility to spend wit her family. A friend of hers was telling her about an acquaintance of theirs who started her own VA company. This intrigued Sadie, she had the skills to pull it off, it just made her a bit nervous to start her own business, the process seamed overwhelming.
At this point Sadie had to decide something so she began to write a business plan and then make the decision as to whether to continue with the VA idea or to find something else. When she was working on the business plan, forced to consider and make decisions regarding a wide range of topics that effect a business, she began to feel more comfortable about starting her own business. The writing of the plan forced her to conceptualize a lot of topics and she quickly realized that starting a business was well within her ability. The plan was completed, and she started operations.
7.1 Personnel Plan
Sadie will be the sole employee. While the business could generate more revenue if she hired and trained additional people, her need for reasonable income, flexibility, enjoyable work, and full time employment was satiated so it will remain a one person business. Sadie will be taking a base salary with the expectation that she will also be able to use some of the net profit one it starts accumulating.
| Personnel Plan | |||
| Year 1 | Year 2 | Year 3 | |
| Sadie | $24,000 | $24,000 | $24,000 |
| Other | $0 | $0 | $0 |
| Total People | 0 | 0 | 0 |
| Total Payroll | $24,000 | $24,000 | $24,000 |
Financial Plan
The following sections will outline important financial information.
8.1 Important Assumptions
The following table details important Financial Assumptions.
| General Assumptions | |||
| Year 1 | Year 2 | Year 3 | |
| Plan Month | 1 | 2 | 3 |
| Current Interest Rate | 10.00% | 10.00% | 10.00% |
| Long-term Interest Rate | 10.00% | 10.00% | 10.00% |
| Tax Rate | 30.00% | 30.00% | 30.00% |
| Other | 0 | 0 | 0 |
8.2 Break-even Analysis
The Break-even Analysis indicates what will be needed in monthly revenue to reach the break-even point.

| Break-even Analysis | |
| Monthly Revenue Break-even | $2,913 |
| Assumptions: | |
| Average Percent Variable Cost | 5% |
| Estimated Monthly Fixed Cost | $2,767 |
8.3 Projected Profit and Loss
The following table and charts will indicate Projected Profit and Loss.


| Pro Forma Profit and Loss | |||
| Year 1 | Year 2 | Year 3 | |
| Sales | $20,240 | $39,668 | $50,418 |
| Direct Cost of Sales | $1,012 | $1,983 | $2,521 |
| Other Costs of Sales | $0 | $0 | $0 |
| Total Cost of Sales | $1,012 | $1,983 | $2,521 |
| Gross Margin | $19,228 | $37,684 | $47,897 |
| Gross Margin % | 95.00% | 95.00% | 95.00% |
| Expenses | |||
| Payroll | $24,000 | $24,000 | $24,000 |
| Sales and Marketing and Other Expenses | $1,200 | $1,200 | $750 |
| Depreciation | $1,404 | $1,404 | $1,404 |
| Rent | $1,800 | $1,800 | $1,800 |
| Utilities | $600 | $600 | $600 |
| Insurance | $600 | $600 | $600 |
| Payroll Taxes | $3,600 | $3,600 | $3,600 |
| Other | $0 | $0 | $0 |
| Total Operating Expenses | $33,204 | $33,204 | $32,754 |
| Profit Before Interest and Taxes | ($13,976) | $4,480 | $15,143 |
| EBITDA | ($12,572) | $5,884 | $16,547 |
| Interest Expense | $0 | $0 | $0 |
| Taxes Incurred | $0 | $1,344 | $4,543 |
| Net Profit | ($13,976) | $3,136 | $10,600 |
| Net Profit/Sales | -69.05% | 7.91% | 21.02% |
8.4 Projected Cash Flow
The following table and chart will indicate Projected Cash Flow.

| Pro Forma Cash Flow | |||
| Year 1 | Year 2 | Year 3 | |
| Cash Received | |||
| Cash from Operations | |||
| Cash Sales | $5,060 | $9,917 | $12,604 |
| Cash from Receivables | $10,641 | $25,393 | $35,402 |
| Subtotal Cash from Operations | $15,701 | $35,310 | $48,006 |
| Additional Cash Received | |||
| Sales Tax, VAT, HST/GST Received | $0 | $0 | $0 |
| New Current Borrowing | $0 | $0 | $0 |
| New Other Liabilities (interest-free) | $0 | $0 | $0 |
| New Long-term Liabilities | $0 | $0 | $0 |
| Sales of Other Current Assets | $0 | $0 | $0 |
| Sales of Long-term Assets | $0 | $0 | $0 |
| New Investment Received | $0 | $0 | $0 |
| Subtotal Cash Received | $15,701 | $35,310 | $48,006 |
| Expenditures | Year 1 | Year 2 | Year 3 |
| Expenditures from Operations | |||
| Cash Spending | $24,000 | $24,000 | $24,000 |
| Bill Payments | $8,026 | $10,999 | $14,144 |
| Subtotal Spent on Operations | $32,026 | $34,999 | $38,144 |
| Additional Cash Spent | |||
| Sales Tax, VAT, HST/GST Paid Out | $0 | $0 | $0 |
| Principal Repayment of Current Borrowing | $0 | $0 | $0 |
| Other Liabilities Principal Repayment | $0 | $0 | $0 |
| Long-term Liabilities Principal Repayment | $0 | $0 | $0 |
| Purchase Other Current Assets | $0 | $0 | $0 |
| Purchase Long-term Assets | $0 | $0 | $0 |
| Dividends | $0 | $0 | $0 |
| Subtotal Cash Spent | $32,026 | $34,999 | $38,144 |
| Net Cash Flow | ($16,326) | $312 | $9,863 |
| Cash Balance | $474 | $786 | $10,649 |
8.5 Projected Balance Sheet
The following table provides information regarding the Projected Balance Sheet.
| Pro Forma Balance Sheet | |||
| Year 1 | Year 2 | Year 3 | |
| Assets | |||
| Current Assets | |||
| Cash | $474 | $786 | $10,649 |
| Accounts Receivable | $4,539 | $8,897 | $11,308 |
| Other Current Assets | $0 | $0 | $0 |
| Total Current Assets | $5,014 | $9,683 | $21,957 |
| Long-term Assets | |||
| Long-term Assets | $7,000 | $7,000 | $7,000 |
| Accumulated Depreciation | $1,404 | $2,808 | $4,212 |
| Total Long-term Assets | $5,596 | $4,192 | $2,788 |
| Total Assets | $10,610 | $13,875 | $24,745 |
| Liabilities and Capital | Year 1 | Year 2 | Year 3 |
| Current Liabilities | |||
| Accounts Payable | $786 | $915 | $1,185 |
| Current Borrowing | $0 | $0 | $0 |
| Other Current Liabilities | $0 | $0 | $0 |
| Subtotal Current Liabilities | $786 | $915 | $1,185 |
| Long-term Liabilities | $0 | $0 | $0 |
| Total Liabilities | $786 | $915 | $1,185 |
| Paid-in Capital | $30,000 | $30,000 | $30,000 |
| Retained Earnings | ($6,200) | ($20,176) | ($17,040) |
| Earnings | ($13,976) | $3,136 | $10,600 |
| Total Capital | $9,824 | $12,960 | $23,560 |
| Total Liabilities and Capital | $10,610 | $13,875 | $24,745 |
| Net Worth | $9,824 | $12,960 | $23,560 |
8.6 Business Ratios
The following table provides information regarding business ratios specific to Everywhere Assistant as well as rations specific to the Administrative Service Consultant industry. Please note that making a comparison of a virtual assistant and a administrative service consultant is a difficult comparison. It is expected that the ratios will be quite different between the two as a VA is a home based, in this case single individual business.
| Ratio Analysis | ||||
| Year 1 | Year 2 | Year 3 | Industry Profile | |
| Sales Growth | 0.00% | 95.98% | 27.10% | 6.98% |
| Percent of Total Assets | ||||
| Accounts Receivable | 42.79% | 64.12% | 45.70% | 26.80% |
| Other Current Assets | 0.00% | 0.00% | 0.00% | 43.95% |
| Total Current Assets | 47.26% | 69.79% | 88.73% | 75.76% |
| Long-term Assets | 52.74% | 30.21% | 11.27% | 24.24% |
| Total Assets | 100.00% | 100.00% | 100.00% | 100.00% |
| Current Liabilities | 7.41% | 6.59% | 4.79% | 31.78% |
| Long-term Liabilities | 0.00% | 0.00% | 0.00% | 17.26% |
| Total Liabilities | 7.41% | 6.59% | 4.79% | 49.04% |
| Net Worth | 92.59% | 93.41% | 95.21% | 50.96% |
| Percent of Sales | ||||
| Sales | 100.00% | 100.00% | 100.00% | 100.00% |
| Gross Margin | 95.00% | 95.00% | 95.00% | 100.00% |
| Selling, General & Administrative Expenses | 164.05% | 87.09% | 73.98% | 85.31% |
| Advertising Expenses | 0.00% | 0.00% | 0.00% | 1.02% |
| Profit Before Interest and Taxes | -69.05% | 11.29% | 30.03% | 1.90% |
| Main Ratios | ||||
| Current | 6.38 | 10.59 | 18.53 | 1.88 |
| Quick | 6.38 | 10.59 | 18.53 | 1.48 |
| Total Debt to Total Assets | 7.41% | 6.59% | 4.79% | 3.41% |
| Pre-tax Return on Net Worth | -142.26% | 34.57% | 64.27% | 55.78% |
| Pre-tax Return on Assets | -131.73% | 32.29% | 61.20% | 7.72% |
| Additional Ratios | Year 1 | Year 2 | Year 3 | |
| Net Profit Margin | -69.05% | 7.91% | 21.02% | n.a |
| Return on Equity | -142.26% | 24.20% | 44.99% | n.a |
| Activity Ratios | ||||
| Accounts Receivable Turnover | 3.34 | 3.34 | 3.34 | n.a |
| Collection Days | 55 | 82 | 98 | n.a |
| Accounts Payable Turnover | 11.21 | 12.17 | 12.17 | n.a |
| Payment Days | 27 | 28 | 27 | n.a |
| Total Asset Turnover | 1.91 | 2.86 | 2.04 | n.a |
| Debt Ratios | ||||
| Debt to Net Worth | 0.08 | 0.07 | 0.05 | n.a |
| Current Liab. to Liab. | 1.00 | 1.00 | 1.00 | n.a |
| Liquidity Ratios | ||||
| Net Working Capital | $4,228 | $8,768 | $20,772 | n.a |
| Interest Coverage | 0.00 | 0.00 | 0.00 | n.a |
| Additional Ratios | ||||
| Assets to Sales | 0.52 | 0.35 | 0.49 | n.a |
| Current Debt/Total Assets | 7% | 7% | 5% | n.a |
| Acid Test | 0.60 | 0.86 | 8.99 | n.a |
| Sales/Net Worth | 2.06 | 3.06 | 2.14 | n.a |
| Dividend Payout | 0.00 | 0.00 | 0.00 | n.a |
Appendix
| Sales Forecast | |||||||||||||
| Month 1 | Month 2 | Month 3 | Month 4 | Month 5 | Month 6 | Month 7 | Month 8 | Month 9 | Month 10 | Month 11 | Month 12 | ||
| Sales | |||||||||||||
| Companies | 0% | $200 | $325 | $450 | $500 | $625 | $745 | $780 | $850 | $925 | $1,154 | $1,345 | $1,515 |
| Not for profit organizations | 0% | $122 | $198 | $275 | $305 | $381 | $454 | $476 | $519 | $564 | $704 | $820 | $924 |
| Individuals | 0% | $108 | $176 | $243 | $270 | $338 | $402 | $421 | $459 | $500 | $623 | $726 | $818 |
| Total Sales | $430 | $699 | $968 | $1,075 | $1,344 | $1,602 | $1,677 | $1,828 | $1,989 | $2,481 | $2,892 | $3,257 | |
| Direct Cost of Sales | Month 1 | Month 2 | Month 3 | Month 4 | Month 5 | Month 6 | Month 7 | Month 8 | Month 9 | Month 10 | Month 11 | Month 12 | |
| Companies | $10 | $16 | $23 | $25 | $31 | $37 | $39 | $43 | $46 | $58 | $67 | $76 | |
| Not for profit organizations | $6 | $10 | $14 | $15 | $19 | $23 | $24 | $26 | $28 | $35 | $41 | $46 | |
| Individuals | $5 | $9 | $12 | $14 | $17 | $20 | $21 | $23 | $25 | $31 | $36 | $41 | |
| Subtotal Direct Cost of Sales | $22 | $35 | $48 | $54 | $67 | $80 | $84 | $91 | $99 | $124 | $145 | $163 | |
| Personnel Plan | |||||||||||||
| Month 1 | Month 2 | Month 3 | Month 4 | Month 5 | Month 6 | Month 7 | Month 8 | Month 9 | Month 10 | Month 11 | Month 12 | ||
| Sadie | 0% | $2,000 | $2,000 | $2,000 | $2,000 | $2,000 | $2,000 | $2,000 | $2,000 | $2,000 | $2,000 | $2,000 | $2,000 |
| Other | 0% | $0 | $0 | $0 | $0 | $0 | $0 | $0 | $0 | $0 | $0 | $0 | $0 |
| Total People | 0 | 0 | 0 | 0 | 0 | 0 | 0 | 0 | 0 | 0 | 0 | 0 | |
| Total Payroll | $2,000 | $2,000 | $2,000 | $2,000 | $2,000 | $2,000 | $2,000 | $2,000 | $2,000 | $2,000 | $2,000 | $2,000 | |
| General Assumptions | |||||||||||||
| Month 1 | Month 2 | Month 3 | Month 4 | Month 5 | Month 6 | Month 7 | Month 8 | Month 9 | Month 10 | Month 11 | Month 12 | ||
| Plan Month | 1 | 2 | 3 | 4 | 5 | 6 | 7 | 8 | 9 | 10 | 11 | 12 | |
| Current Interest Rate | 10.00% | 10.00% | 10.00% | 10.00% | 10.00% | 10.00% | 10.00% | 10.00% | 10.00% | 10.00% | 10.00% | 10.00% | |
| Long-term Interest Rate | 10.00% | 10.00% | 10.00% | 10.00% | 10.00% | 10.00% | 10.00% | 10.00% | 10.00% | 10.00% | 10.00% | 10.00% | |
| Tax Rate | 30.00% | 30.00% | 30.00% | 30.00% | 30.00% | 30.00% | 30.00% | 30.00% | 30.00% | 30.00% | 30.00% | 30.00% | |
| Other | 0 | 0 | 0 | 0 | 0 | 0 | 0 | 0 | 0 | 0 | 0 | 0 | |
| Pro Forma Profit and Loss | |||||||||||||
| Month 1 | Month 2 | Month 3 | Month 4 | Month 5 | Month 6 | Month 7 | Month 8 | Month 9 | Month 10 | Month 11 | Month 12 | ||
| Sales | $430 | $699 | $968 | $1,075 | $1,344 | $1,602 | $1,677 | $1,828 | $1,989 | $2,481 | $2,892 | $3,257 | |
| Direct Cost of Sales | $22 | $35 | $48 | $54 | $67 | $80 | $84 | $91 | $99 | $124 | $145 | $163 | |
| Other Costs of Sales | $0 | $0 | $0 | $0 | $0 | $0 | $0 | $0 | $0 | $0 | $0 | $0 | |
| Total Cost of Sales | $22 | $35 | $48 | $54 | $67 | $80 | $84 | $91 | $99 | $124 | $145 | $163 | |
| Gross Margin | $409 | $664 | $919 | $1,021 | $1,277 | $1,522 | $1,593 | $1,736 | $1,889 | $2,357 | $2,747 | $3,094 | |
| Gross Margin % | 95.00% | 95.00% | 95.00% | 95.00% | 95.00% | 95.00% | 95.00% | 95.00% | 95.00% | 95.00% | 95.00% | 95.00% | |
| Expenses | |||||||||||||
| Payroll | $2,000 | $2,000 | $2,000 | $2,000 | $2,000 | $2,000 | $2,000 | $2,000 | $2,000 | $2,000 | $2,000 | $2,000 | |
| Sales and Marketing and Other Expenses | $100 | $100 | $100 | $100 | $100 | $100 | $100 | $100 | $100 | $100 | $100 | $100 | |
| Depreciation | $117 | $117 | $117 | $117 | $117 | $117 | $117 | $117 | $117 | $117 | $117 | $117 | |
| Rent | $150 | $150 | $150 | $150 | $150 | $150 | $150 | $150 | $150 | $150 | $150 | $150 | |
| Utilities | $50 | $50 | $50 | $50 | $50 | $50 | $50 | $50 | $50 | $50 | $50 | $50 | |
| Insurance | $50 | $50 | $50 | $50 | $50 | $50 | $50 | $50 | $50 | $50 | $50 | $50 | |
| Payroll Taxes | 15% | $300 | $300 | $300 | $300 | $300 | $300 | $300 | $300 | $300 | $300 | $300 | $300 |
| Other | $0 | $0 | $0 | $0 | $0 | $0 | $0 | $0 | $0 | $0 | $0 | $0 | |
| Total Operating Expenses | $2,767 | $2,767 | $2,767 | $2,767 | $2,767 | $2,767 | $2,767 | $2,767 | $2,767 | $2,767 | $2,767 | $2,767 | |
| Profit Before Interest and Taxes | ($2,359) | ($2,103) | ($1,848) | ($1,746) | ($1,490) | ($1,245) | ($1,174) | ($1,031) | ($878) | ($410) | ($20) | $327 | |
| EBITDA | ($2,242) | ($1,986) | ($1,731) | ($1,629) | ($1,373) | ($1,128) | ($1,057) | ($914) | ($761) | ($293) | $97 | $444 | |
| Interest Expense | $0 | $0 | $0 | $0 | $0 | $0 | $0 | $0 | $0 | $0 | $0 | $0 | |
| Taxes Incurred | $0 | $0 | $0 | $0 | $0 | $0 | $0 | $0 | $0 | $0 | $0 | $0 | |
| Net Profit | ($2,359) | ($2,103) | ($1,848) | ($1,746) | ($1,490) | ($1,245) | ($1,174) | ($1,031) | ($878) | ($410) | ($20) | $327 | |
| Net Profit/Sales | -548.49% | -300.99% | -190.99% | -162.40% | -110.92% | -77.75% | -70.00% | -56.41% | -44.13% | -16.52% | -0.69% | 10.05% | |
| Pro Forma Cash Flow | |||||||||||||
| Month 1 | Month 2 | Month 3 | Month 4 | Month 5 | Month 6 | Month 7 | Month 8 | Month 9 | Month 10 | Month 11 | Month 12 | ||
| Cash Received | |||||||||||||
| Cash from Operations | |||||||||||||
| Cash Sales | $108 | $175 | $242 | $269 | $336 | $400 | $419 | $457 | $497 | $620 | $723 | $814 | |
| Cash from Receivables | $0 | $11 | $329 | $531 | $728 | $813 | $1,014 | $1,203 | $1,262 | $1,375 | $1,504 | $1,871 | |
| Subtotal Cash from Operations | $108 | $185 | $571 | $800 | $1,064 | $1,213 | $1,434 | $1,660 | $1,759 | $1,995 | $2,227 | $2,685 | |
| Additional Cash Received | |||||||||||||
| Sales Tax, VAT, HST/GST Received | 0.00% | $0 | $0 | $0 | $0 | $0 | $0 | $0 | $0 | $0 | $0 | $0 | $0 |
| New Current Borrowing | $0 | $0 | $0 | $0 | $0 | $0 | $0 | $0 | $0 | $0 | $0 | $0 | |
| New Other Liabilities (interest-free) | $0 | $0 | $0 | $0 | $0 | $0 | $0 | $0 | $0 | $0 | $0 | $0 | |
| New Long-term Liabilities | $0 | $0 | $0 | $0 | $0 | $0 | $0 | $0 | $0 | $0 | $0 | $0 | |
| Sales of Other Current Assets | $0 | $0 | $0 | $0 | $0 | $0 | $0 | $0 | $0 | $0 | $0 | $0 | |
| Sales of Long-term Assets | $0 | $0 | $0 | $0 | $0 | $0 | $0 | $0 | $0 | $0 | $0 | $0 | |
| New Investment Received | $0 | $0 | $0 | $0 | $0 | $0 | $0 | $0 | $0 | $0 | $0 | $0 | |
| Subtotal Cash Received | $108 | $185 | $571 | $800 | $1,064 | $1,213 | $1,434 | $1,660 | $1,759 | $1,995 | $2,227 | $2,685 | |
| Expenditures | Month 1 | Month 2 | Month 3 | Month 4 | Month 5 | Month 6 | Month 7 | Month 8 | Month 9 | Month 10 | Month 11 | Month 12 | |
| Expenditures from Operations | |||||||||||||
| Cash Spending | $2,000 | $2,000 | $2,000 | $2,000 | $2,000 | $2,000 | $2,000 | $2,000 | $2,000 | $2,000 | $2,000 | $2,000 | |
| Bill Payments | $22 | $672 | $685 | $699 | $704 | $718 | $730 | $734 | $742 | $750 | $775 | $795 | |
| Subtotal Spent on Operations | $2,022 | $2,672 | $2,685 | $2,699 | $2,704 | $2,718 | $2,730 | $2,734 | $2,742 | $2,750 | $2,775 | $2,795 | |
| Additional Cash Spent | |||||||||||||
| Sales Tax, VAT, HST/GST Paid Out | $0 | $0 | $0 | $0 | $0 | $0 | $0 | $0 | $0 | $0 | $0 | $0 | |
| Principal Repayment of Current Borrowing | $0 | $0 | $0 | $0 | $0 | $0 | $0 | $0 | $0 | $0 | $0 | $0 | |
| Other Liabilities Principal Repayment | $0 | $0 | $0 | $0 | $0 | $0 | $0 | $0 | $0 | $0 | $0 | $0 | |
| Long-term Liabilities Principal Repayment | $0 | $0 | $0 | $0 | $0 | $0 | $0 | $0 | $0 | $0 | $0 | $0 | |
| Purchase Other Current Assets | $0 | $0 | $0 | $0 | $0 | $0 | $0 | $0 | $0 | $0 | $0 | $0 | |
| Purchase Long-term Assets | $0 | $0 | $0 | $0 | $0 | $0 | $0 | $0 | $0 | $0 | $0 | $0 | |
| Dividends | $0 | $0 | $0 | $0 | $0 | $0 | $0 | $0 | $0 | $0 | $0 | $0 | |
| Subtotal Cash Spent | $2,022 | $2,672 | $2,685 | $2,699 | $2,704 | $2,718 | $2,730 | $2,734 | $2,742 | $2,750 | $2,775 | $2,795 | |
| Net Cash Flow | ($1,915) | ($2,487) | ($2,114) | ($1,899) | ($1,640) | ($1,504) | ($1,297) | ($1,074) | ($983) | ($755) | ($548) | ($110) | |
| Cash Balance | $14,885 | $12,399 | $10,284 | $8,385 | $6,745 | $5,241 | $3,944 | $2,870 | $1,887 | $1,132 | $584 | $474 | |
| Pro Forma Balance Sheet | |||||||||||||
| Month 1 | Month 2 | Month 3 | Month 4 | Month 5 | Month 6 | Month 7 | Month 8 | Month 9 | Month 10 | Month 11 | Month 12 | ||
| Assets | Starting Balances | ||||||||||||
| Current Assets | |||||||||||||
| Cash | $16,800 | $14,885 | $12,399 | $10,284 | $8,385 | $6,745 | $5,241 | $3,944 | $2,870 | $1,887 | $1,132 | $584 | $474 |
| Accounts Receivable | $0 | $323 | $836 | $1,232 | $1,508 | $1,787 | $2,176 | $2,419 | $2,586 | $2,817 | $3,303 | $3,968 | $4,539 |
| Other Current Assets | $0 | $0 | $0 | $0 | $0 | $0 | $0 | $0 | $0 | $0 | $0 | $0 | $0 |
| Total Current Assets | $16,800 | $15,208 | $13,234 | $11,517 | $9,893 | $8,533 | $7,417 | $6,363 | $5,457 | $4,704 | $4,435 | $4,552 | $5,014 |
| Long-term Assets | |||||||||||||
| Long-term Assets | $7,000 | $7,000 | $7,000 | $7,000 | $7,000 | $7,000 | $7,000 | $7,000 | $7,000 | $7,000 | $7,000 | $7,000 | $7,000 |
| Accumulated Depreciation | $0 | $117 | $234 | $351 | $468 | $585 | $702 | $819 | $936 | $1,053 | $1,170 | $1,287 | $1,404 |
| Total Long-term Assets | $7,000 | $6,883 | $6,766 | $6,649 | $6,532 | $6,415 | $6,298 | $6,181 | $6,064 | $5,947 | $5,830 | $5,713 | $5,596 |
| Total Assets | $23,800 | $22,091 | $20,000 | $18,166 | $16,425 | $14,948 | $13,715 | $12,544 | $11,521 | $10,651 | $10,265 | $10,265 | $10,610 |
| Liabilities and Capital | Month 1 | Month 2 | Month 3 | Month 4 | Month 5 | Month 6 | Month 7 | Month 8 | Month 9 | Month 10 | Month 11 | Month 12 | |
| Current Liabilities | |||||||||||||
| Accounts Payable | $0 | $649 | $662 | $675 | $680 | $693 | $706 | $709 | $717 | $724 | $748 | $768 | $786 |
| Current Borrowing | $0 | $0 | $0 | $0 | $0 | $0 | $0 | $0 | $0 | $0 | $0 | $0 | $0 |
| Other Current Liabilities | $0 | $0 | $0 | $0 | $0 | $0 | $0 | $0 | $0 | $0 | $0 | $0 | $0 |
| Subtotal Current Liabilities | $0 | $649 | $662 | $675 | $680 | $693 | $706 | $709 | $717 | $724 | $748 | $768 | $786 |
| Long-term Liabilities | $0 | $0 | $0 | $0 | $0 | $0 | $0 | $0 | $0 | $0 | $0 | $0 | $0 |
| Total Liabilities | $0 | $649 | $662 | $675 | $680 | $693 | $706 | $709 | $717 | $724 | $748 | $768 | $786 |
| Paid-in Capital | $30,000 | $30,000 | $30,000 | $30,000 | $30,000 | $30,000 | $30,000 | $30,000 | $30,000 | $30,000 | $30,000 | $30,000 | $30,000 |
| Retained Earnings | ($6,200) | ($6,200) | ($6,200) | ($6,200) | ($6,200) | ($6,200) | ($6,200) | ($6,200) | ($6,200) | ($6,200) | ($6,200) | ($6,200) | ($6,200) |
| Earnings | $0 | ($2,359) | ($4,462) | ($6,310) | ($8,055) | ($9,546) | ($10,791) | ($11,965) | ($12,996) | ($13,874) | ($14,283) | ($14,303) | ($13,976) |
| Total Capital | $23,800 | $21,442 | $19,338 | $17,490 | $15,745 | $14,254 | $13,009 | $11,835 | $10,804 | $9,927 | $9,517 | $9,497 | $9,824 |
| Total Liabilities and Capital | $23,800 | $22,091 | $20,000 | $18,166 | $16,425 | $14,948 | $13,715 | $12,544 | $11,521 | $10,651 | $10,265 | $10,265 | $10,610 |
| Net Worth | $23,800 | $21,442 | $19,338 | $17,490 | $15,745 | $14,254 | $13,009 | $11,835 | $10,804 | $9,926 | $9,517 | $9,497 | $9,824 |


