
Enchanted Vineyard B & B
Executive Summary
The Enchanted Vineyard Bed & Breakfast is a charming bed and breakfast (B&B) located in the Lorane Valley, outside of Eugene, OR. The valley is well known for its beauty and concentration of vineyards. The B&B will be set up as a sole proprietorship of Missy Stewart. The B&B will reside in The Stewart’s newly renovated home. Their home is the center piece for the entire B&B experience. Each of the five rooms have their own private bath. The facility has a wonderful centralized living room for the socialization of the guests, a private garden patio, and an on-site winery on the Stewart’s 10 acres of land. To top things off, every room has 65% of their walls as windows offering guests an unprecedented view of the valley.
The Market
Within the hospitality industry, The Enchanted Vineyard will be competing with hotels and other B&Bs. Although The Enchanted Vineyard competes with hotels, their direct competitors are other B&Bs. Enchanted’s facilities are far nicer than other B&Bs for its size. All of the smaller (less than 9 rooms) B&B are a fairly standard house converted into a B&B, nothing noteworthy. Enchanted Vineyard on the other hand is a newly renovated house and vineyard in a picturesque setting.
The Enchanted Vineyard will be targeting three distinct groups. The first is weekend getaway travelers, generally people from Eugene looking to escape for the weekend. Eugene is a wonderful town in the Willamette River valley nationally renowned for its wineries, cycling and old growth trees. This customer group is growing at 11% a year with 12,000 potential customers. The second group is out-of-town travelers which is growing at 10% with 18,000 potential customers. The last group of customers the B&B is targeting are University of Oregon travelers. The university brings thousands of visitors to Eugene whether they are professors, speakers, or parents. Once a relationship has been established with the U of O, it will be a constant stream of business. This customer group is growing at 17% with 12,000 potential customers.
Competitive Edge
The Enchanted Vineyard has two distinct competitive edges that differentiates it from the competition. The first is the never-ending attention to detail and customer service. The Stewarts recognize that their mission is to ensure that their customers have the finest stay with them. Both Missy and John will do whatever it takes to ensure the customer’s happiness. Their second competitive edge is the unique facility. The facility is so wonderful in part because of the actual structure which is a wonderful place to stay. It is also unique because of the location, overlooking the Lorane Valley, a beautiful area filled with wineries and vineyards.
Management Team
The Enchanted Vineyard will be able to execute on its strong business model because of its management. Missy has earned her MBA providing her with invaluable business skills. While Missy was pursuing her MBA, she was on a team of five students that opened up their own service business. Lastly, Missy has spent numerous years in the B&B industry, providing her with amazing insight and experience directly related to what she is doing now.
The Enchanted Vineyard will be able to leverage its amazing facility and turn it into a beautiful, special B&B serving the Eugene community. This will be done by the passion and experience of Missy Stewart, the sole proprietor. The B&B will become profitable by year two and will earn over $77,000 in revenue by the end of year three.
1.1 Mission
The Mission of The Enchanted Vineyard Bed & Breakfast is to provide the finest B&B experience. We exist to attract and maintain customers. When we adhere to this maxim, everything else will fall into place. Our services will exceed the expectations of our customers.
1.2 Objectives
The objectives of The Enchanted Vineyard Bed & Breakfast for the first three years of operation include:
- To create a B&B whose primary goal is to exceed customer’s expectations.
- The usage of The Enchanted Vineyard Bed & Breakfast by visitors every week through out the year.
- To increase our number of clients by 20% per year through superior service.
- To develop a sustainable business, surviving off its own cash flow.
Company Summary
The Enchanted Vineyard Bed & Breakfast, located in the Lorane Valley, will offer a luxurious, quaint B&B for people to enjoy. The Enchanted Vineyard Bed & Breakfast will have four individual rooms with private baths, a central living room/socializing area, a garden patio, and an adjoining vineyard for its guests.
2.1 Company Ownership
The Enchanted Vineyard Bed & Breakfast is a sole proprietorship of Missy Stewart. The B&B uses John and Missy’s home as the Inn.
2.2 Start-up Summary
The Enchanted Vineyard Bed & Breakfast start-up expenses include:
- Home office equipment including: computer, copier, fax machine, extra telephone line, desk and filing cabinet.
- Extra computer for the living room with Internet access via a DSL line.
- Website creation.
- Advertising/association dues for the local B&B association.
- Remodeling of the house to add two individual bedrooms with baths, a patio and to enlarge the common areas.
Please note that the cost of the remodeling will be depreciated using the straight line method over a 30-year schedule. Although the Inn will have to finish their research into tax law, it does appear that the Inn will be allowed to depreciate the remodeling as the additions will be used only for business.
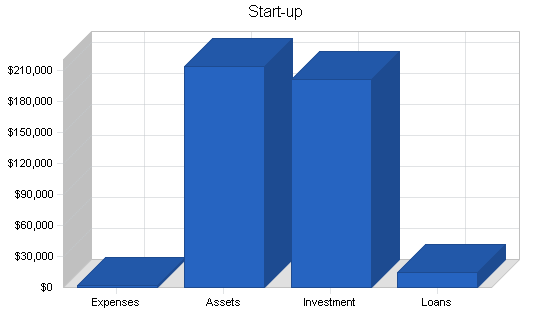
| Start-up | |
| Requirements | |
| Start-up Expenses | |
| Legal | $300 |
| Stationery etc. | $300 |
| Brochures | $300 |
| Consultants | $300 |
| Insurance | $600 |
| Rent | $0 |
| Research and Development | $0 |
| Expensed Equipment | $0 |
| Other | $0 |
| Total Start-up Expenses | $1,800 |
| Start-up Assets | |
| Cash Required | $11,200 |
| Start-up Inventory | $1,500 |
| Other Current Assets | $1,500 |
| Long-term Assets | $200,000 |
| Total Assets | $214,200 |
| Total Requirements | $216,000 |
| Start-up Funding | |
| Start-up Expenses to Fund | $1,800 |
| Start-up Assets to Fund | $214,200 |
| Total Funding Required | $216,000 |
| Assets | |
| Non-cash Assets from Start-up | $203,000 |
| Cash Requirements from Start-up | $11,200 |
| Additional Cash Raised | $0 |
| Cash Balance on Starting Date | $11,200 |
| Total Assets | $214,200 |
| Liabilities and Capital | |
| Liabilities | |
| Current Borrowing | $2,400 |
| Long-term Liabilities | $10,000 |
| Accounts Payable (Outstanding Bills) | $0 |
| Other Current Liabilities (interest-free) | $2,000 |
| Total Liabilities | $14,400 |
| Capital | |
| Planned Investment | |
| Investor 1 | $201,600 |
| Investor 2 | $0 |
| Other | $0 |
| Additional Investment Requirement | $0 |
| Total Planned Investment | $201,600 |
| Loss at Start-up (Start-up Expenses) | ($1,800) |
| Total Capital | $199,800 |
| Total Capital and Liabilities | $214,200 |
| Total Funding | $216,000 |
Services
The Enchanted Vineyard Bed & Breakfast is a small, attractive B&B that offers travelers a secluded, relaxed setting for a weekend getaway, change of scenery, sports or cultural events, family occassions, U of O events, etc. The Enchanted Vineyard Bed & Breakfast has a large central gathering room that allows travelers to socialize. The customers will receive the personal attention of the Stewarts, who will meet any need a traveler has.
The Enchanted Vineyard Bed & Breakfast provides a wonderful breakfast feast and can meet any dietary restriction. The Enchanted Vineyard Bed & Breakfast is centrally located about 15 minutes from downtown Eugene in the heart of the Lorane Valley wine country. In fact, The Enchanted Vineyard Bed & Breakfast has its own vineyard which grows grapes for local wineries and clients are encouraged to explore The Enchanted Vineyard Bed & Breakfast’s 10 acres of land.
Market Analysis Summary
The Enchanted Vineyard Bed & Breakfast has three different target groups that it is attempting to attract. The first are people from the region that just want to get away for the weekend. They may have activities planned for the weekend, or just chose to vegetate. The second group are travelers who are passing through Eugene and prefer to stay in B&Bs instead of a hotel/motel. The last group is any customer affiliated with the local school, the University of Oregon. This group may be parents of students or visiting the University on official business and the University is the entity that sets up the reservation. While The Enchanted Vineyard Bed & Breakfast will certainly get customers that fall outside of these groups, this classification should be fairly accurate.
Brought to you by
Create a professional business plan
Using AI and step-by-step instructions
Create Your PlanSecure funding
Validate ideas
Build a strategy
4.1 Market Segmentation
Our customers can be broadly divided into three groups (please note it is possible to divide the customers in to much smaller groups, but we have chosen not to):
- Weekend getaway customers. These people are from the region and are looking to get away from their life so they come to The Enchanted Vineyard Bed & Breakfast to be pampered and escape.
- Travelers. These people, for whatever reason, are passing through Eugene and prefer to stay in a B&B instead of a hotel/motel.
- University of Oregon travelers. The University brings a large number of people through Eugene, and The Enchanted Vineyard Bed & Breakfast believes that a good portion of their business will be from the University. Occassions include parent weekend, orientation, parents visiting, and graduation. Lastly, the University will often set up rooms for administrative visitors.

| Market Analysis | |||||||
| Year 1 | Year 2 | Year 3 | Year 4 | Year 5 | |||
| Potential Customers | Growth | CAGR | |||||
| Weekend-Getaway Customers | 11% | 12,000 | 13,320 | 14,785 | 16,411 | 18,216 | 11.00% |
| Travelers | 10% | 18,000 | 19,800 | 21,780 | 23,958 | 26,354 | 10.00% |
| University of Oregon Travelers | 17% | 12,000 | 14,040 | 16,427 | 19,220 | 22,487 | 17.00% |
| Total | 12.41% | 42,000 | 47,160 | 52,992 | 59,589 | 67,057 | 12.41% |
4.2 Target Market Segment Strategy
The Enchanted Vineyard Bed & Breakfast intends to target these three customer groups as they make up the largest population of people who utilize B&Bs. The Enchanted Vineyard Bed & Breakfast has a three pronged strategy that will work for all three groups:
- Association membership and advertising. A large number of visitors will look to regional B&B associations for information about the different B&Bs in the area. Most associations publish a guide to the local B&Bs and The Enchanted Vineyard Bed & Breakfast wants to be in this guide. One of the other perks of membership is visibility on the associations website with a link to ours. Additionally, we will be a member of the Chamber of Commerce because people will typically inquire with the local Chamber when planning a vacation.
- Website. The Enchanted Vineyard Bed & Breakfast will have a full-service website that allows the visitor to view the B&B, read details about what it has to offer, provide information on regional activities, and even allow the visitor to book a reservation. With the growing use of the Internet, the Web has become an indispensable tool for planning vacations to areas that are not close enough to check out in person.
- Strategic relationship with the University of Oregon. The Enchanted Vineyard Bed & Breakfast will develop a partnership with the University so when the school is in need of finding rooms for guests they will use The Enchanted Vineyard Bed & Breakfast. We will also be advertising with the University so when students are searching for places for their parents to stay, they will come across The Enchanted Vineyard Bed & Breakfast in a school related publication and feel more comfortable with booking a reservation sight unseen because of the trust bond they have formed with the University.
4.3 Competition and Buying Patterns
Competition comes in several forms:
- Other B&Bs. Typically B&Bs have a set of unique features, something that makes them stand out.
Some B&Bs will create uniqueness down to the level of different rooms within the B&B. The size of a B&Bs range from one or two room (traditionally called a home stay) to a country inn with 30 rooms.
On average most B&Bs have only a couple of rooms and are often booked up in advance. Particularly during special events, demand outstrips supply for the B&Bs.
The B&Bs differentiate themselves by personal service offerings and the general ambiance of the Inn. Finally, B&Bs usually have a very nice sit down breakfast for their guests. This is not a simple continental breakfast of juice, coffee, and a bagel, but an elaborate spread of gourmet food such as quiche, a portabello mushroom, fresh roasted garlic and sun-dried tomato omelette, or some sort of fresh smoked fish.
Guests of B&Bs are looking not just for a room to sleep in but the whole experience in staying in a lovely setting, with interesting people to chat with and people present to pamper them in any way possible.
- Hotels/motels. These facilities are generally much more sterile in character relative to B&Bs.
The rooms are typically the same throughout the facility (unlike B&Bs where each room is typically different). The guests of hotels generally use the hotel as a place to stay at night.
The operator will usually see the guest when they check in and when they check out. This differs from a B&B where the guests are encouraged to spend time in communal rooms and socialize with the operators and the other guests.
Breakfasts, if included, are sparse. The typical guests are looking for a room to stay in at night and not much more than that.
Strategy and Implementation Summary
The Enchanted Vineyard Bed & Breakfast will be using advertising and membership in associations to drive in prospective customers. They will also use their website as a complete source of information about the B&B. Missy will then turn these leads into customers through unsurpassed attentiveness in one-on-one phone inquiries/conversations.
5.1 Competitive Edge
The Enchanted Vineyard Bed & Breakfast’s two competitive advantages are:
- Attention to personalized service. While anyone at a B&B should reasonably expect good service, there are ways of setting yourself apart.
This will be done through the unrelenting pursuit of personal attention. In the Eugene area there are several larger (more than six rooms) B&Bs that offer outstanding service, but it is not personal. The service is provided by employees, not the owner.
At The Enchanted Vineyard Bed & Breakfast all interactions with the customer will be with Missy or John who see it as their duty to do whatever it takes to make the customer feel at home.
The feeling of personal attention, or more accurately defined as a sense of person concern, really adds a positive dimension to the B&B experience. Not only will the Stewarts be offering personal concern, but they will be providing the concern, not some employee.
- Uniqueness and beauty of the facility. The Enchanted Vineyard Bed & Breakfast will be housed in the Stewart’s home. The Stewarts will be renovating their farm house to accommodate their new guests. They will be building two more bedrooms with private baths, a patio, and enlarging the common area.
One unique aspect of The Enchanted Vineyard Bed & Breakfast is the setting within the Lorane Valley region, known for its outstanding wine production housing both vineyards and wineries.
To compliment this setting, The Enchanted Vineyard Bed & Breakfast will have a large outside patio allowing guests to spend relaxing time outside with a nice view of the valley. Guests can also wander through The Enchanted Vineyard Bed & Breakfast’s own vineyard.
Each room in the B&B is 65% glass overlooking the hillside and vineyard. There is not a room in the house that doesn’t have a breath-taking view.
5.2 Sales Strategy
The Enchanted Vineyard Bed & Breakfast’s sales strategy will be two pronged:
- Personal attention in regard to calls of inquiry. It is Missy’s strategy to be willing to spend a fair amount of time on the phone to prospective clients. While most B&Bs will be pleasant on the phone and willing to answer any question, the sooner they are off the phone, the sooner they can get back to the work they were previously doing.
Missy has the attitude that the more time she can spend on the phone with inquiries, the more likely she will be able to turn them into customers.
- Very detailed website. Missy recognizes that over 95% of her clients have Web access and 80% used the Web to research their vacations. This usage is compelling enough to have a comprehensive website that offers enough information to allow the visitor to make a decision to stay with The Enchanted Vineyard Bed & Breakfast.
The website will have 3D walk-through tours allowing people to see the different bedrooms as well as common areas. Online pricing and reservations are also available as well as a resource page that details the different activities in the area.
While Missy would like to encourage people to call with questions, if they do not they will be able answer almost all questions with the website.
5.2.1 Sales Forecast
The first three months will be used for the renovation of the home to fully accommodate guests. Once complete the house will have five different rooms. There will be no sales activity during this time. By month four, the B&B will be ready to go. Missy will have already been advertising, become a B&B association member, as well as have formed a strategic relationship with the University so business will ramp up fairly quickly. From month five on, business will steadily grow. Beginning with month five, Missy will hire one full-time employee. This employee will perform housecleaning as well as outdoor maintenance. This will free up Missy’s time so she can spend it with the clients.

| Sales Forecast | |||
| Year 1 | Year 2 | Year 3 | |
| Sales | |||
| Weekend-Getaway Customers | $11,396 | $42,000 | $54,000 |
| Travelers | $13,089 | $60,000 | $62,000 |
| University of Oregon Travelers | $11,265 | $46,000 | $49,000 |
| Total Sales | $35,750 | $148,000 | $165,000 |
| Direct Cost of Sales | Year 1 | Year 2 | Year 3 |
| Weekend-Getaway Customers | $6,117 | $22,260 | $28,620 |
| Travelers | $7,031 | $31,800 | $32,860 |
| University of Oregon Travelers | $6,044 | $24,380 | $25,970 |
| Subtotal Direct Cost of Sales | $19,193 | $78,440 | $87,450 |
5.3 Milestones
The Enchanted Vineyard Bed & Breakfast will have several milestones early on:
- Business plan completion. This will be done as a road map for the organization. While we do not need a business plan to raise capital, it will be an indispensable tool for the ongoing performance and improvement of the company.
- Joining the different associations. This is, in effect, the coming out party for announcing to the world that you are a real B&B, ready for business.
- Completion of the facility renovations.
- Our 100th client.
| Milestones | |||||
| Milestone | Start Date | End Date | Budget | Manager | Department |
| Business Plan Completion | 1/1/2001 | 1/1/2001 | $0 | ABC | Department |
| Join Different Associations | 2/1/2001 | 2/1/2001 | $600 | ABC | Department |
| Completion of Facility Renovations | 1/1/2001 | 4/1/2001 | $200,000 | ABC | Department |
| 100th Client | 7/1/2001 | 7/1/2001 | $0 | ABC | Department |
| Name me | 1/1/2003 | 1/15/2003 | $0 | ABC | Department |
| Name me | 1/1/2003 | 1/15/2003 | $0 | ABC | Department |
| Name me | 1/1/2003 | 1/15/2003 | $0 | ABC | Department |
| Name me | 1/1/2003 | 1/15/2003 | $0 | ABC | Department |
| Name me | 1/1/2003 | 1/15/2003 | $0 | ABC | Department |
| Name me | 1/1/2003 | 1/15/2003 | $0 | ABC | Department |
| Totals | $200,600 | ||||
Management Summary
The Enchanted Vineyard Bed & Breakfast is owned and operated by Missy Stewart. It will be a sole proprietorship. Missy has a degree in philosophy from Ponoma College and an MBA from University of Oregon. While Missy was pursuing her undergraduate degree, she worked in a B&B and had a wide range of responsibilities. This is the experience where she was first bit by the B&B bug. She dreamed of some day having a B&B run from her house, with the excitement of taking care of travelers.
Missy’s concentration in school was in general management with the intent of someday opening her own business. Missy participated in the PACE, a group project where teams of five students worked together for two entire semesters creating their own company and then eventually selling it at the end of the year. Missy’s group formed a service-based company which was an invaluable experience for the needs she would face in opening up her own B&B.
Missy’s education coupled with her practical experiences has given her the ideal skill-set required for operating a B&B. The only other thing that is truly required is passion, and Missy recognized her passion over seven years ago while working at a B&B. Missy has everything needed to succeed and will fulfill her destiny.
6.1 Personnel Plan
Missy will be the sole employee from months one to five. At month five things will be getting busier and the need will develop for an additional person. This new employee will be used for house cleaning and outside maintenance. This will free up Missy’s time so she can spend more time with the customers. John will be helping when possible, but John’s contribution to the company will be primarily emotional and financial support of Missy’s dream. John will be covering their living expenses while Missy is building the business. At some point within the first year the revenue from the B&B will exceed the mortgage payments for the remodel and at some point will cover the entire mortgage for the home.
| Personnel Plan | |||
| Year 1 | Year 2 | Year 3 | |
| Missy | $3,000 | $6,000 | $12,000 |
| Housekeeping/Outdoor Maintenance | $12,000 | $18,000 | $18,000 |
| Total People | 2 | 2 | 2 |
| Total Payroll | $15,000 | $24,000 | $30,000 |
Financial Plan
The following sections will detail important financial information.
7.1 Important Assumptions
The following table highlights some of the important financial assumptions for The Enchanted Vineyard Bed & Breakfast.
| General Assumptions | |||
| Year 1 | Year 2 | Year 3 | |
| Plan Month | 1 | 2 | 3 |
| Current Interest Rate | 10.00% | 10.00% | 10.00% |
| Long-term Interest Rate | 10.00% | 10.00% | 10.00% |
| Tax Rate | 25.00% | 25.00% | 25.00% |
| Other | 0 | 0 | 0 |
7.2 Break-even Analysis
The Break-even Analysis indicates that monthly revenue must exceed $8,600 to break even.

| Break-even Analysis | |
| Monthly Revenue Break-even | $8,674 |
| Assumptions: | |
| Average Percent Variable Cost | 54% |
| Estimated Monthly Fixed Cost | $4,017 |
7.3 Projected Profit and Loss
The following table will indicate projected profit and loss.
| Pro Forma Profit and Loss | |||
| Year 1 | Year 2 | Year 3 | |
| Sales | $35,750 | $148,000 | $165,000 |
| Direct Cost of Sales | $19,193 | $78,440 | $87,450 |
| Other | $0 | $0 | $0 |
| Total Cost of Sales | $19,193 | $78,440 | $87,450 |
| Gross Margin | $16,557 | $69,560 | $77,550 |
| Gross Margin % | 46.31% | 47.00% | 47.00% |
| Expenses | |||
| Payroll | $15,000 | $24,000 | $30,000 |
| Sales and Marketing and Other Expenses | $1,800 | $3,200 | $3,800 |
| Depreciation | $20,004 | $20,004 | $20,004 |
| Leased Equipment | $0 | $0 | $2,000 |
| Utilities | $2,400 | $2,400 | $2,400 |
| Insurance | $1,470 | $1,470 | $1,470 |
| mortgage | $5,280 | $5,280 | $5,280 |
| Payroll Taxes | $2,250 | $3,600 | $4,500 |
| Other | $0 | $0 | $0 |
| Total Operating Expenses | $48,204 | $59,954 | $69,454 |
| Profit Before Interest and Taxes | ($31,647) | $9,606 | $8,096 |
| EBITDA | ($11,643) | $29,610 | $28,100 |
| Interest Expense | $1,225 | $1,265 | $1,065 |
| Taxes Incurred | $0 | $2,085 | $1,758 |
| Net Profit | ($32,873) | $6,256 | $5,273 |
| Net Profit/Sales | -91.95% | 4.23% | 3.20% |
7.4 Projected Cash Flow
The following chart and table will indicate projected cash flow.

| Pro Forma Cash Flow | |||
| Year 1 | Year 2 | Year 3 | |
| Cash Received | |||
| Cash from Operations | |||
| Cash Sales | $25,025 | $103,600 | $115,500 |
| Cash from Receivables | $6,978 | $32,634 | $47,718 |
| Subtotal Cash from Operations | $32,003 | $136,234 | $163,218 |
| Additional Cash Received | |||
| Sales Tax, VAT, HST/GST Received | $0 | $0 | $0 |
| New Current Borrowing | $2,000 | $0 | $0 |
| New Other Liabilities (interest-free) | $3,800 | $0 | $0 |
| New Long-term Liabilities | $0 | $0 | $0 |
| Sales of Other Current Assets | $0 | $0 | $0 |
| Sales of Long-term Assets | $0 | $0 | $0 |
| New Investment Received | $0 | $0 | $0 |
| Subtotal Cash Received | $37,803 | $136,234 | $163,218 |
| Expenditures | Year 1 | Year 2 | Year 3 |
| Expenditures from Operations | |||
| Cash Spending | $15,000 | $24,000 | $30,000 |
| Bill Payments | $31,690 | $102,287 | $110,868 |
| Subtotal Spent on Operations | $46,690 | $126,287 | $140,868 |
| Additional Cash Spent | |||
| Sales Tax, VAT, HST/GST Paid Out | $0 | $0 | $0 |
| Principal Repayment of Current Borrowing | $0 | $1,000 | $1,000 |
| Other Liabilities Principal Repayment | $0 | $0 | $0 |
| Long-term Liabilities Principal Repayment | $750 | $1,000 | $1,000 |
| Purchase Other Current Assets | $0 | $0 | $0 |
| Purchase Long-term Assets | $0 | $6,000 | $10,000 |
| Dividends | $0 | $0 | $5,000 |
| Subtotal Cash Spent | $47,440 | $134,287 | $157,868 |
| Net Cash Flow | ($9,637) | $1,947 | $5,350 |
| Cash Balance | $1,563 | $3,510 | $8,860 |
7.5 Projected Balance Sheet
The following table will indicate the projected balance sheet.
| Pro Forma Balance Sheet | |||
| Year 1 | Year 2 | Year 3 | |
| Assets | |||
| Current Assets | |||
| Cash | $1,563 | $3,510 | $8,860 |
| Accounts Receivable | $3,747 | $15,513 | $17,295 |
| Inventory | $3,573 | $12,920 | $14,404 |
| Other Current Assets | $1,500 | $1,500 | $1,500 |
| Total Current Assets | $10,383 | $33,443 | $42,059 |
| Long-term Assets | |||
| Long-term Assets | $200,000 | $206,000 | $216,000 |
| Accumulated Depreciation | $20,004 | $40,008 | $60,012 |
| Total Long-term Assets | $179,996 | $165,992 | $155,988 |
| Total Assets | $190,379 | $199,435 | $198,047 |
| Liabilities and Capital | Year 1 | Year 2 | Year 3 |
| Current Liabilities | |||
| Accounts Payable | $4,001 | $8,802 | $9,140 |
| Current Borrowing | $4,400 | $3,400 | $2,400 |
| Other Current Liabilities | $5,800 | $5,800 | $5,800 |
| Subtotal Current Liabilities | $14,201 | $18,002 | $17,340 |
| Long-term Liabilities | $9,250 | $8,250 | $7,250 |
| Total Liabilities | $23,451 | $26,252 | $24,590 |
| Paid-in Capital | $201,600 | $201,600 | $201,600 |
| Retained Earnings | ($1,800) | ($34,673) | ($33,417) |
| Earnings | ($32,873) | $6,256 | $5,273 |
| Total Capital | $166,927 | $173,183 | $173,456 |
| Total Liabilities and Capital | $190,379 | $199,435 | $198,047 |
| Net Worth | $166,927 | $173,183 | $173,456 |
Brought to you by
Create a professional business plan
Using AI and step-by-step instructions
Create Your PlanSecure funding
Validate ideas
Build a strategy
7.6 Business Ratios
The business ratios reflect both a cross-sectional analysis and time-series analysis of the company’s risk and profitability. The cross-sectional analysis consists of a comparison of our firm’s ratios and those of the hotel and motel industry averages. The reader will note that there are some significant differences in the ratios, especially in regards to the way our company is leveraged. This is due to the fact that industry averages also include very large hotel chains that usually have much higher capital costs and investments in long-term assets. Furthermore, Enchanted Vineyards B&B has lower SG&A costs than other hotels and motels since B&Bs usually provide fewer services than larger competitors.
| Ratio Analysis | ||||
| Year 1 | Year 2 | Year 3 | Industry Profile | |
| Sales Growth | 0.00% | 313.99% | 11.49% | 5.90% |
| Percent of Total Assets | ||||
| Accounts Receivable | 1.97% | 7.78% | 8.73% | 5.00% |
| Inventory | 1.88% | 6.48% | 7.27% | 1.00% |
| Other Current Assets | 0.79% | 0.75% | 0.76% | 26.00% |
| Total Current Assets | 5.45% | 16.77% | 21.24% | 32.00% |
| Long-term Assets | 94.55% | 83.23% | 78.76% | 68.00% |
| Total Assets | 100.00% | 100.00% | 100.00% | 100.00% |
| Current Liabilities | 7.46% | 9.03% | 8.76% | 19.40% |
| Long-term Liabilities | 4.86% | 4.14% | 3.66% | 34.60% |
| Total Liabilities | 12.32% | 13.16% | 12.42% | 54.00% |
| Net Worth | 87.68% | 86.84% | 87.58% | 46.00% |
| Percent of Sales | ||||
| Sales | 100.00% | 100.00% | 100.00% | 100.00% |
| Gross Margin | 46.31% | 47.00% | 47.00% | 0.00% |
| Selling, General & Administrative Expenses | 138.22% | 42.64% | 43.67% | 75.10% |
| Advertising Expenses | 5.03% | 1.22% | 1.09% | 1.90% |
| Profit Before Interest and Taxes | -88.52% | 6.49% | 4.91% | 2.50% |
| Main Ratios | ||||
| Current | 0.73 | 1.86 | 2.43 | 1.45 |
| Quick | 0.48 | 1.14 | 1.59 | 1.05 |
| Total Debt to Total Assets | 12.32% | 13.16% | 12.42% | 54.00% |
| Pre-tax Return on Net Worth | -19.69% | 4.82% | 4.05% | 1.70% |
| Pre-tax Return on Assets | -17.27% | 4.18% | 3.55% | 3.70% |
| Additional Ratios | Year 1 | Year 2 | Year 3 | |
| Net Profit Margin | -91.95% | 4.23% | 3.20% | n.a |
| Return on Equity | -19.69% | 3.61% | 3.04% | n.a |
| Activity Ratios | ||||
| Accounts Receivable Turnover | 2.86 | 2.86 | 2.86 | n.a |
| Collection Days | 55 | 79 | 121 | n.a |
| Inventory Turnover | 8.85 | 9.51 | 6.40 | n.a |
| Accounts Payable Turnover | 8.92 | 12.17 | 12.17 | n.a |
| Payment Days | 27 | 22 | 29 | n.a |
| Total Asset Turnover | 0.19 | 0.74 | 0.83 | n.a |
| Debt Ratios | ||||
| Debt to Net Worth | 0.14 | 0.15 | 0.14 | n.a |
| Current Liab. to Liab. | 0.61 | 0.69 | 0.71 | n.a |
| Liquidity Ratios | ||||
| Net Working Capital | ($3,819) | $15,441 | $24,718 | n.a |
| Interest Coverage | -25.83 | 7.59 | 7.60 | n.a |
| Additional Ratios | ||||
| Assets to Sales | 5.33 | 1.35 | 1.20 | n.a |
| Current Debt/Total Assets | 7% | 9% | 9% | n.a |
| Acid Test | 0.22 | 0.28 | 0.60 | n.a |
| Sales/Net Worth | 0.21 | 0.85 | 0.95 | n.a |
| Dividend Payout | 0.00 | 0.00 | 0.95 | n.a |
Appendix
| Sales Forecast | |||||||||||||
| Month 1 | Month 2 | Month 3 | Month 4 | Month 5 | Month 6 | Month 7 | Month 8 | Month 9 | Month 10 | Month 11 | Month 12 | ||
| Sales | |||||||||||||
| Weekend-Getaway Customers | 0% | $0 | $0 | $0 | $654 | $745 | $784 | $804 | $1,245 | $1,587 | $1,874 | $2,245 | $1,458 |
| Travelers | 0% | $0 | $0 | $0 | $654 | $702 | $754 | $815 | $1,345 | $1,698 | $1,985 | $2,458 | $2,678 |
| University of Oregon Travelers | 0% | $0 | $0 | $0 | $598 | $965 | $654 | $712 | $800 | $1,874 | $1,787 | $1,987 | $1,888 |
| Total Sales | $0 | $0 | $0 | $1,906 | $2,412 | $2,192 | $2,331 | $3,390 | $5,159 | $5,646 | $6,690 | $6,024 | |
| Direct Cost of Sales | Month 1 | Month 2 | Month 3 | Month 4 | Month 5 | Month 6 | Month 7 | Month 8 | Month 9 | Month 10 | Month 11 | Month 12 | |
| Weekend-Getaway Customers | $0 | $0 | $0 | $340 | $387 | $423 | $434 | $671 | $856 | $1,010 | $1,211 | $786 | |
| Travelers | $0 | $0 | $0 | $340 | $365 | $407 | $439 | $725 | $916 | $1,070 | $1,325 | $1,444 | |
| University of Oregon Travelers | $0 | $0 | $0 | $311 | $502 | $353 | $384 | $431 | $1,010 | $964 | $1,071 | $1,018 | |
| Subtotal Direct Cost of Sales | $0 | $0 | $0 | $991 | $1,254 | $1,182 | $1,257 | $1,828 | $2,782 | $3,044 | $3,607 | $3,248 | |
| Personnel Plan | |||||||||||||
| Month 1 | Month 2 | Month 3 | Month 4 | Month 5 | Month 6 | Month 7 | Month 8 | Month 9 | Month 10 | Month 11 | Month 12 | ||
| Missy | 0% | $250 | $250 | $250 | $250 | $250 | $250 | $250 | $250 | $250 | $250 | $250 | $250 |
| Housekeeping/Outdoor Maintenance | 0% | $0 | $0 | $0 | $0 | $1,500 | $1,500 | $1,500 | $1,500 | $1,500 | $1,500 | $1,500 | $1,500 |
| Total People | 1 | 1 | 1 | 1 | 2 | 2 | 2 | 2 | 2 | 2 | 2 | 2 | |
| Total Payroll | $250 | $250 | $250 | $250 | $1,750 | $1,750 | $1,750 | $1,750 | $1,750 | $1,750 | $1,750 | $1,750 | |
| General Assumptions | |||||||||||||
| Month 1 | Month 2 | Month 3 | Month 4 | Month 5 | Month 6 | Month 7 | Month 8 | Month 9 | Month 10 | Month 11 | Month 12 | ||
| Plan Month | 1 | 2 | 3 | 4 | 5 | 6 | 7 | 8 | 9 | 10 | 11 | 12 | |
| Current Interest Rate | 10.00% | 10.00% | 10.00% | 10.00% | 10.00% | 10.00% | 10.00% | 10.00% | 10.00% | 10.00% | 10.00% | 10.00% | |
| Long-term Interest Rate | 10.00% | 10.00% | 10.00% | 10.00% | 10.00% | 10.00% | 10.00% | 10.00% | 10.00% | 10.00% | 10.00% | 10.00% | |
| Tax Rate | 25.00% | 25.00% | 25.00% | 25.00% | 25.00% | 25.00% | 25.00% | 25.00% | 25.00% | 25.00% | 25.00% | 25.00% | |
| Other | 0 | 0 | 0 | 0 | 0 | 0 | 0 | 0 | 0 | 0 | 0 | 0 | |
| Pro Forma Profit and Loss | |||||||||||||
| Month 1 | Month 2 | Month 3 | Month 4 | Month 5 | Month 6 | Month 7 | Month 8 | Month 9 | Month 10 | Month 11 | Month 12 | ||
| Sales | $0 | $0 | $0 | $1,906 | $2,412 | $2,192 | $2,331 | $3,390 | $5,159 | $5,646 | $6,690 | $6,024 | |
| Direct Cost of Sales | $0 | $0 | $0 | $991 | $1,254 | $1,182 | $1,257 | $1,828 | $2,782 | $3,044 | $3,607 | $3,248 | |
| Other | $0 | $0 | $0 | $0 | $0 | $0 | $0 | $0 | $0 | $0 | $0 | $0 | |
| Total Cost of Sales | $0 | $0 | $0 | $991 | $1,254 | $1,182 | $1,257 | $1,828 | $2,782 | $3,044 | $3,607 | $3,248 | |
| Gross Margin | $0 | $0 | $0 | $915 | $1,158 | $1,010 | $1,074 | $1,562 | $2,377 | $2,602 | $3,083 | $2,776 | |
| Gross Margin % | 0.00% | 0.00% | 0.00% | 48.01% | 48.01% | 46.08% | 46.08% | 46.08% | 46.08% | 46.08% | 46.08% | 46.08% | |
| Expenses | |||||||||||||
| Payroll | $250 | $250 | $250 | $250 | $1,750 | $1,750 | $1,750 | $1,750 | $1,750 | $1,750 | $1,750 | $1,750 | |
| Sales and Marketing and Other Expenses | $150 | $150 | $150 | $150 | $150 | $150 | $150 | $150 | $150 | $150 | $150 | $150 | |
| Depreciation | $1,667 | $1,667 | $1,667 | $1,667 | $1,667 | $1,667 | $1,667 | $1,667 | $1,667 | $1,667 | $1,667 | $1,667 | |
| Leased Equipment | $0 | $0 | $0 | $0 | $0 | $0 | $0 | $0 | $0 | $0 | $0 | $0 | |
| Utilities | $200 | $200 | $200 | $200 | $200 | $200 | $200 | $200 | $200 | $200 | $200 | $200 | |
| Insurance | $150 | $120 | $120 | $120 | $120 | $120 | $120 | $120 | $120 | $120 | $120 | $120 | |
| mortgage | $440 | $440 | $440 | $440 | $440 | $440 | $440 | $440 | $440 | $440 | $440 | $440 | |
| Payroll Taxes | 15% | $38 | $38 | $38 | $38 | $263 | $263 | $263 | $263 | $263 | $263 | $263 | $263 |
| Other | $0 | $0 | $0 | $0 | $0 | $0 | $0 | $0 | $0 | $0 | $0 | $0 | |
| Total Operating Expenses | $2,895 | $2,865 | $2,865 | $2,865 | $4,590 | $4,590 | $4,590 | $4,590 | $4,590 | $4,590 | $4,590 | $4,590 | |
| Profit Before Interest and Taxes | ($2,895) | ($2,865) | ($2,865) | ($1,950) | ($3,432) | ($3,579) | ($3,515) | ($3,027) | ($2,212) | ($1,988) | ($1,507) | ($1,814) | |
| EBITDA | ($1,228) | ($1,198) | ($1,198) | ($283) | ($1,765) | ($1,912) | ($1,848) | ($1,360) | ($545) | ($321) | $160 | ($147) | |
| Interest Expense | $103 | $103 | $103 | $103 | $102 | $101 | $101 | $100 | $99 | $98 | $98 | $114 | |
| Taxes Incurred | $0 | $0 | $0 | $0 | $0 | $0 | $0 | $0 | $0 | $0 | $0 | $0 | |
| Net Profit | ($2,998) | ($2,968) | ($2,968) | ($2,052) | ($3,533) | ($3,681) | ($3,616) | ($3,127) | ($2,311) | ($2,086) | ($1,605) | ($1,927) | |
| Net Profit/Sales | 0.00% | 0.00% | 0.00% | -107.67% | -146.49% | -167.91% | -155.12% | -92.25% | -44.80% | -36.95% | -23.98% | -32.00% | |
| Pro Forma Cash Flow | |||||||||||||
| Month 1 | Month 2 | Month 3 | Month 4 | Month 5 | Month 6 | Month 7 | Month 8 | Month 9 | Month 10 | Month 11 | Month 12 | ||
| Cash Received | |||||||||||||
| Cash from Operations | |||||||||||||
| Cash Sales | $0 | $0 | $0 | $1,334 | $1,688 | $1,534 | $1,632 | $2,373 | $3,611 | $3,952 | $4,683 | $4,217 | |
| Cash from Receivables | $0 | $0 | $0 | $0 | $19 | $577 | $721 | $659 | $710 | $1,035 | $1,553 | $1,704 | |
| Subtotal Cash from Operations | $0 | $0 | $0 | $1,334 | $1,707 | $2,111 | $2,353 | $3,032 | $4,321 | $4,987 | $6,236 | $5,921 | |
| Additional Cash Received | |||||||||||||
| Sales Tax, VAT, HST/GST Received | 0.00% | $0 | $0 | $0 | $0 | $0 | $0 | $0 | $0 | $0 | $0 | $0 | $0 |
| New Current Borrowing | $0 | $0 | $0 | $0 | $0 | $0 | $0 | $0 | $0 | $0 | $0 | $2,000 | |
| New Other Liabilities (interest-free) | $0 | $0 | $0 | $0 | $0 | $0 | $0 | $0 | $3,800 | $0 | $0 | $0 | |
| New Long-term Liabilities | $0 | $0 | $0 | $0 | $0 | $0 | $0 | $0 | $0 | $0 | $0 | $0 | |
| Sales of Other Current Assets | $0 | $0 | $0 | $0 | $0 | $0 | $0 | $0 | $0 | $0 | $0 | $0 | |
| Sales of Long-term Assets | $0 | $0 | $0 | $0 | $0 | $0 | $0 | $0 | $0 | $0 | $0 | $0 | |
| New Investment Received | $0 | $0 | $0 | $0 | $0 | $0 | $0 | $0 | $0 | $0 | $0 | $0 | |
| Subtotal Cash Received | $0 | $0 | $0 | $1,334 | $1,707 | $2,111 | $2,353 | $3,032 | $8,121 | $4,987 | $6,236 | $7,921 | |
| Expenditures | Month 1 | Month 2 | Month 3 | Month 4 | Month 5 | Month 6 | Month 7 | Month 8 | Month 9 | Month 10 | Month 11 | Month 12 | |
| Expenditures from Operations | |||||||||||||
| Cash Spending | $250 | $250 | $250 | $250 | $1,750 | $1,750 | $1,750 | $1,750 | $1,750 | $1,750 | $1,750 | $1,750 | |
| Bill Payments | $36 | $1,080 | $1,051 | $1,084 | $2,062 | $2,398 | $2,384 | $2,650 | $3,774 | $5,086 | $4,634 | $5,451 | |
| Subtotal Spent on Operations | $286 | $1,330 | $1,301 | $1,334 | $3,812 | $4,148 | $4,134 | $4,400 | $5,524 | $6,836 | $6,384 | $7,201 | |
| Additional Cash Spent | |||||||||||||
| Sales Tax, VAT, HST/GST Paid Out | $0 | $0 | $0 | $0 | $0 | $0 | $0 | $0 | $0 | $0 | $0 | $0 | |
| Principal Repayment of Current Borrowing | $0 | $0 | $0 | $0 | $0 | $0 | $0 | $0 | $0 | $0 | $0 | $0 | |
| Other Liabilities Principal Repayment | $0 | $0 | $0 | $0 | $0 | $0 | $0 | $0 | $0 | $0 | $0 | $0 | |
| Long-term Liabilities Principal Repayment | $0 | $0 | $0 | $83 | $83 | $83 | $83 | $83 | $83 | $83 | $83 | $83 | |
| Purchase Other Current Assets | $0 | $0 | $0 | $0 | $0 | $0 | $0 | $0 | $0 | $0 | $0 | $0 | |
| Purchase Long-term Assets | $0 | $0 | $0 | $0 | $0 | $0 | $0 | $0 | $0 | $0 | $0 | $0 | |
| Dividends | $0 | $0 | $0 | $0 | $0 | $0 | $0 | $0 | $0 | $0 | $0 | $0 | |
| Subtotal Cash Spent | $286 | $1,330 | $1,301 | $1,417 | $3,895 | $4,231 | $4,218 | $4,483 | $5,608 | $6,919 | $6,467 | $7,285 | |
| Net Cash Flow | ($286) | ($1,330) | ($1,301) | ($83) | ($2,188) | ($2,120) | ($1,864) | ($1,451) | $2,514 | ($1,932) | ($232) | $636 | |
| Cash Balance | $10,914 | $9,584 | $8,283 | $8,200 | $6,012 | $3,892 | $2,028 | $577 | $3,091 | $1,158 | $926 | $1,563 | |
| Pro Forma Balance Sheet | |||||||||||||
| Month 1 | Month 2 | Month 3 | Month 4 | Month 5 | Month 6 | Month 7 | Month 8 | Month 9 | Month 10 | Month 11 | Month 12 | ||
| Assets | Starting Balances | ||||||||||||
| Current Assets | |||||||||||||
| Cash | $11,200 | $10,914 | $9,584 | $8,283 | $8,200 | $6,012 | $3,892 | $2,028 | $577 | $3,091 | $1,158 | $926 | $1,563 |
| Accounts Receivable | $0 | $0 | $0 | $0 | $572 | $1,276 | $1,357 | $1,335 | $1,693 | $2,531 | $3,190 | $3,644 | $3,747 |
| Inventory | $1,500 | $1,500 | $1,500 | $1,500 | $1,509 | $1,379 | $1,300 | $1,383 | $2,011 | $3,060 | $3,349 | $3,968 | $3,573 |
| Other Current Assets | $1,500 | $1,500 | $1,500 | $1,500 | $1,500 | $1,500 | $1,500 | $1,500 | $1,500 | $1,500 | $1,500 | $1,500 | $1,500 |
| Total Current Assets | $14,200 | $13,914 | $12,584 | $11,283 | $11,781 | $10,168 | $8,049 | $6,245 | $5,780 | $10,181 | $9,197 | $10,039 | $10,383 |
| Long-term Assets | |||||||||||||
| Long-term Assets | $200,000 | $200,000 | $200,000 | $200,000 | $200,000 | $200,000 | $200,000 | $200,000 | $200,000 | $200,000 | $200,000 | $200,000 | $200,000 |
| Accumulated Depreciation | $0 | $1,667 | $3,334 | $5,001 | $6,668 | $8,335 | $10,002 | $11,669 | $13,336 | $15,003 | $16,670 | $18,337 | $20,004 |
| Total Long-term Assets | $200,000 | $198,333 | $196,666 | $194,999 | $193,332 | $191,665 | $189,998 | $188,331 | $186,664 | $184,997 | $183,330 | $181,663 | $179,996 |
| Total Assets | $214,200 | $212,247 | $209,250 | $206,282 | $205,113 | $201,833 | $198,047 | $194,576 | $192,444 | $195,178 | $192,527 | $191,702 | $190,379 |
| Liabilities and Capital | Month 1 | Month 2 | Month 3 | Month 4 | Month 5 | Month 6 | Month 7 | Month 8 | Month 9 | Month 10 | Month 11 | Month 12 | |
| Current Liabilities | |||||||||||||
| Accounts Payable | $0 | $1,045 | $1,016 | $1,016 | $1,982 | $2,319 | $2,297 | $2,525 | $3,604 | $4,933 | $4,451 | $5,314 | $4,001 |
| Current Borrowing | $2,400 | $2,400 | $2,400 | $2,400 | $2,400 | $2,400 | $2,400 | $2,400 | $2,400 | $2,400 | $2,400 | $2,400 | $4,400 |
| Other Current Liabilities | $2,000 | $2,000 | $2,000 | $2,000 | $2,000 | $2,000 | $2,000 | $2,000 | $2,000 | $5,800 | $5,800 | $5,800 | $5,800 |
| Subtotal Current Liabilities | $4,400 | $5,445 | $5,416 | $5,416 | $6,382 | $6,719 | $6,697 | $6,925 | $8,004 | $13,133 | $12,651 | $13,514 | $14,201 |
| Long-term Liabilities | $10,000 | $10,000 | $10,000 | $10,000 | $9,917 | $9,833 | $9,750 | $9,667 | $9,583 | $9,500 | $9,417 | $9,333 | $9,250 |
| Total Liabilities | $14,400 | $15,445 | $15,416 | $15,416 | $16,298 | $16,552 | $16,447 | $16,592 | $17,587 | $22,633 | $22,067 | $22,847 | $23,451 |
| Paid-in Capital | $201,600 | $201,600 | $201,600 | $201,600 | $201,600 | $201,600 | $201,600 | $201,600 | $201,600 | $201,600 | $201,600 | $201,600 | $201,600 |
| Retained Earnings | ($1,800) | ($1,800) | ($1,800) | ($1,800) | ($1,800) | ($1,800) | ($1,800) | ($1,800) | ($1,800) | ($1,800) | ($1,800) | ($1,800) | ($1,800) |
| Earnings | $0 | ($2,998) | ($5,966) | ($8,934) | ($10,986) | ($14,519) | ($18,200) | ($21,816) | ($24,943) | ($27,254) | ($29,341) | ($30,945) | ($32,873) |
| Total Capital | $199,800 | $196,802 | $193,834 | $190,867 | $188,814 | $185,281 | $181,600 | $177,984 | $174,857 | $172,546 | $170,459 | $168,855 | $166,927 |
| Total Liabilities and Capital | $214,200 | $212,247 | $209,250 | $206,282 | $205,113 | $201,833 | $198,047 | $194,576 | $192,444 | $195,178 | $192,527 | $191,702 | $190,379 |
| Net Worth | $199,800 | $196,802 | $193,834 | $190,867 | $188,814 | $185,281 | $181,600 | $177,984 | $174,857 | $172,546 | $170,459 | $168,855 | $166,927 |


