
Mixed Greens Salad Gardens
Executive Summary
Mixed Greens Salad Gardens (MGSG) is an exciting new company that meets an unsatiated need for quality salad greens. The close proximity to Eugene ensures a steady flow of customers. MGSG is a start-up grower and distributor of exotic salad greens for restaurants and individual consumers. MGSG is located in Blue River, Oregon and serves the southern Willamette Valley. MGSG’s objectives are to develop a product-based company whose goal is to exceed customer’s expectations, increase production efficiency by 10% a year, and lastly, and develop a sustainable farm business, able to survive off their cash flow.
Products
MGSG will sell a spring mix of salad field greens. These greens will include but are not limited to: red leaf, arugula, radicchio, mustard greens, endive, and chicory. These greens are grown for use in salad mixtures, purchased by the end consumer as well as by restaurants who then serve it to their patrons.
The Market
MGSG has decided to target two distinct market segments, individual customers and restaurants. The individual customers will purchase greens from MGSG at the Tuesday and Saturday Farmer’s Market. This segment is growing at 12% and has 12,000 potential customers. The second segment is local restaurants. This market is smaller at only 28 potential customers, but is more consistent in demand throughout the year.
Competitive Edge
MGSG has two competitive edges that will help them maintain strong growth rates, increasing their market penetration. The first edge is quality. MGSG prides themselves on the high quality of exotic salad greens. Greens that do not meet MGSG high standards of quality are rejected as imperfects and go to a not-for-profit food bank. MGSG’s second competitive edge is their flexibility. The entire farm has been set up to allow them to change crops or scale existing crops to meet demand. This is highly unusual as most farms are unable to change crops mid year.
Management
MGSG is led by Heidi Ponic. Heidi initially got her start in growing while working at a greenhouse. After college, Heidi went to work for a large grass seed company. This experience is what solidified Heidi’s desire to continue working in an agricultural capacity. Soon after her experience at the Willamette Seed Company she decided to enroll in Oregon State University’s Master of Horticulture Program. Heidi’s Masters provided her with requisite detail and skills to develop her own farm business.
1.1 Objectives
The objectives for the first three years of operation include:
- To create a product-based company whose goal is to exceed customers’ expectations.
- The utilization of Mixed Greens’ lettuce products in at least 20% of the top restaurants in Eugene as listed in local paper’s restaurant reviews.
- To increase the efficiency of our production by 10% a year.
- To develop a sustainable farm, surviving off its own cash flow.
1.2 Mission
Mixed Greens Salad Gardens’ mission is to provide the highest-quality salad greens. We exist to attract and maintain customers. When we adhere to this maxim, everything else will fall in to place. Our services will exceed the expectations of our customers.
Company Summary
Mixed Greens Salad Gardens, soon to be located in Blue River, OR, is a grower and seller of exotic salad field greens. MGSG grows a wide variety of field greens including red leaf, arugula, radicchio, mustard greens, endive, and chicory. MGSG sells the greens both at farmer markets as well as direct to restaurants.
The business will be based out of Heidi Ponic’s home. The office will be within her home and the greenhouse will be on her adjoining 20 acres of land.
2.1 Company Ownership
Mixed Greens Salad Gardens will be a sole proprietorship with Heidi Ponic as the founder and owner. Heidi will be funding the business with a $50,000 investment of her own. An additional $10,000 will be invested by family member O.G. Tylthe with exit/repayment initially scheduled for year five.
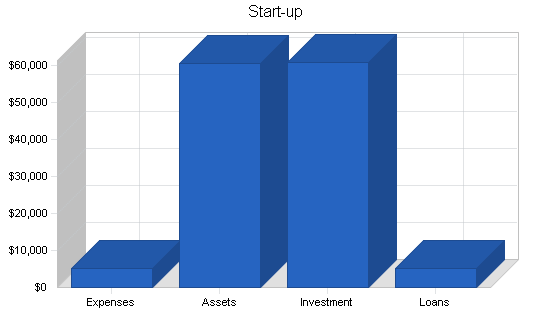
2.2 Start-up Summary
Mixed Greens Salad Gardens’ start-up costs will include all the equipment needed for the home-based office, the construction of the greenhouse and all the necessary equipment, and other essentials for growing.
The home office equipment will be the largest chunk of the start-up expenses. This equipment includes a computer system, fax machine, office supplies, cellular phone, and pager. The computer should have at least a 500 megahertz Celeron/Pentium processor, 64 megabytes of RAM (preferably 128), 6 gigabyte hard drive, and a rewritable CD-ROM for backing up the system. The home office will also require a few pieces of furniture such as a desk, chair, and book shelf to transform a standard room into an office. Lastly, an additional land phone line will be required.
The greenhouse will need the following equipment: a 25′ x 100′ greenhouse structure made out of poly carbonate, a ventilation system, a heater, a mister system, supplemental lighting, fertilizer injector, pruners, pots, trays, soil, seeds, and assorted chemicals.
Please note that of the $25,300 of long-term assets, $20,000 will be depreciated straight line for 27.5 years (real estate) and the remaining $5,300 will be depreciated on a seven year straight-line schedule.
| Start-up | |
| Requirements | |
| Start-up Expenses | |
| Legal | $300 |
| Stationery | $200 |
| Insurance | $200 |
| Untilities Upgrades | $150 |
| Rent | $250 |
| Expensed Computer Equipment | $3,500 |
| Other | $500 |
| Total Start-up Expenses | $5,100 |
| Start-up Assets | |
| Cash Required | $34,700 |
| Start-up Inventory | $0 |
| Other Current Assets | $500 |
| Long-term Assets | $25,300 |
| Total Assets | $60,500 |
| Total Requirements | $65,600 |
| Start-up Funding | |
| Start-up Expenses to Fund | $5,100 |
| Start-up Assets to Fund | $60,500 |
| Total Funding Required | $65,600 |
| Assets | |
| Non-cash Assets from Start-up | $25,800 |
| Cash Requirements from Start-up | $34,700 |
| Additional Cash Raised | $0 |
| Cash Balance on Starting Date | $34,700 |
| Total Assets | $60,500 |
| Liabilities and Capital | |
| Liabilities | |
| Current Borrowing | $5,000 |
| Long-term Liabilities | $0 |
| Accounts Payable (Outstanding Bills) | $0 |
| Other Current Liabilities (interest-free) | $0 |
| Total Liabilities | $5,000 |
| Capital | |
| Planned Investment | |
| Heidi Ponic | $50,000 |
| Investor 2 | $10,000 |
| Other | $0 |
| Additional Investment Requirement | $600 |
| Total Planned Investment | $60,600 |
| Loss at Start-up (Start-up Expenses) | ($5,100) |
| Total Capital | $55,500 |
| Total Capital and Liabilities | $60,500 |
| Total Funding | $65,600 |
Products
MGSG will sell a spring mix of salad field greens. These greens will include but are not limited to: red leaf, arugula, radicchio, mustard greens, endive, and chicory. These greens are grown for use in salad mixtures, purchased by the end consumer as well as by restaurants who then serve it to their patrons. While the greens are washed at the farm, they are not certified washed and the patrons are told to wash them an additional time.
Market Analysis Summary
MGSG will be focusing on two distinct users of greens, individual consumers, and restaurants. The consumer market is seasonal so we will have production shifts during the consumer off season and all of the production will go toward wholesale restaurant distribution. During the spring and the summer MGSG will be serving both the consumer markets through farmer market stands and the restaurants through direct distribution.
4.1 Market Segmentation
Mixed Greens Salad Gardens has two distinct customers:
- Individual Consumers. This group of people buy exotic salad greens because they have a more sophisticated pallette. Average Americans have been raised on iceberg lettuce and this is their green of choice (unfortunately). When people from this class get a little “crazy” they might even try romaine lettuce. These people are typically unsophisticated or unadventurous in terms of culinary habits. These are NOT the people MGSG serves. MGSG is going after people that appreciate healthier, tastier alternatives to the standby of iceberg lettuce. This group of consumers is more likely to make their own meals instead of going out, appreciates fine dining, and generally is from a higher socio/economic class. Mixed Greens Salad Gardens’ field greens are more expensive than choices like iceberg or romaine, therefore one can conclude that the consumer typically makes more money if they are willing to pay significantly more for their salad greens, and second, people with more sophisticated palates typically are more educated.
- Restaurants. Not all restaurants use exotic field greens mixes, generally it is a restaurant of fine dining that serves the finer greens. To be even more specific, it is typically an adventurous American or nouveau cuisine restaurant as opposed to a nicer French or German restaurant that appreciates the exotic field greens mix. For what ever reason (probably attributable to demand of their customers), the French and German restaurants, even the finer ones tend to serve “peasant greens.” The restaurants are a year round customer which is helpful to balance the seasonal demand of individual consumers (group 1 above). Another advantage of having the restaurants as a customer is that even though they get a better price, MGSG has a long term contract with them which helps out in terms of stability.
Brought to you by
Create a professional business plan
Using AI and step-by-step instructions
Create Your PlanSecure funding
Validate ideas
Build a strategy

| Market Analysis | |||||||
| Year 1 | Year 2 | Year 3 | Year 4 | Year 5 | |||
| Potential Customers | Growth | CAGR | |||||
| Individual Consumers | 12% | 12,000 | 13,440 | 15,053 | 16,859 | 18,882 | 12.00% |
| Restaurants | 8% | 28 | 30 | 32 | 35 | 38 | 7.93% |
| Other | 0% | 0 | 0 | 0 | 0 | 0 | 0.00% |
| Total | 11.99% | 12,028 | 13,470 | 15,085 | 16,894 | 18,920 | 11.99% |
4.2 Target Market Segment Strategy
Mixed Greens Salad Gardens’ target market segment strategy is fairly easy. Our two different customer groups purchase from two distinct locations so it is quite easy to target them individually.
Individuals. These customers will be buying MGSG products from the different farmer markets located in Eugene, OR. The main one is “The Farmers Market” held downtown twice a week in the spring, summer, and the early autumn. This market gets quite a bit of traffic because there is a nice selection of different farmers and products and it is in a central location in the heart of Eugene. Additionally, there are several other smaller farmer markets that exist in outlining communities. By setting up a booth in these markets, there is already a steady flow of interested customers. There obviously is a fee to set up a stand, but what you get for the fee is all of your marketing taken care of and a line of customers. In addition to individuals frequenting the farmer markets, some restaurants will go there as well. This occurs when a restaurant needs certain ingredients but did not have the time to order it in advance.
Restaurants. MGSG will target these customers by introducing MGSG and their products to the restaurants through meetings with the buyers at each restaurant. There are about 25-30 different restaurants in Eugene that use field greens in their salad and MGSG intends to approach these to form long-term relationships.
4.3 Industry Analysis
There are three different types of competitors that MGSG faces:
- Supermarkets. These stores sell a salad greens mix to consumers. The advantage of the supermarket is convenience. There are many supermarkets around the city and they are open many hours during the day. Their disadvantage is price and quality. The quality and variety lower than the standards set by the offerings of MGSG and other similar local farmers. The cost is higher, usually 15% more.
- Similar local farmers. These are very similar operations to MGSG, sometimes larger and sometimes smaller. There appears to be room in the market for multiple farmers as most of the farmers sell out their products each day at the farmer markets.
- Large distributors. An example of this would be Food Service of America (FSA) which buys a wide variety of products and quality of produce from farmers and distributes them to restaurants. The produce is not usually local, and is a few more days older from the field compared with the local farmers. The price is comparable and the quality can be comparable, but not necessarily. The disadvantage of a food distributor is the lack of flexibility relative to a local grower when serving local customers.
Buying patterns are based on the customer’s desires. What is meant by this is that lower-end restaurants (or at least restaurants that are less concerned about quality) will not bother to get greens from local farmers, there is no need for them to. This pattern is similar for the individuals. There are some individuals that are content with the offerings from supermarkets. There are others that appreciate the difference in quality and are willing to schedule a trip to the farmers market to meet their weekly needs.
Strategy and Implementation Summary
MGSG will be aggressively courting the farmer markets to ensure the ability to have a booth at the markets. Additionally, MGSG will be aggressive in going after the local restaurants that have a consistent need for the greens. Through an assurance of top-shelf service and superior customer service and reliability, MGSG will continue to grow its number of clients.
5.1 Competitive Edge
Mixed Greens Salad Gardens’ competitive edge has two main aspects: quality and flexibility.
- Quality. While the quality of the other local farmers is quite good, Heidi’s extensive educational background and practical experience provides her with tools to create a superior product. Heidi is a perfectionist and her striving for perfection will lead MGSG to developing a product that will be a notch better than the competition.
- Flexibility. With MGSG being both small and local in nature, it will be able to be flexible in meeting customer’s demands. For instance, if a local restaurant has customers that prefer more arugula in their salad mix, MGSG can rapidly shift production to meet the needs of that customer. Most of the farmers, and all of the distributors, typically have their production schedules set up for maximum yield and are unable to modify crop production very much. Heidi is less concerned about maximizing yield, she is more concerned with pleasing the customer. She believes, rightfully so, that talking care of the customer is the most important thing.
A combination of quality and flexibility will create a sustainable competitive advantage that will allow MGSG to succeed.
5.2 Sales Strategy
MGSG’s sales strategy will be based on visibility, consistency, and strategic relationships.
- Visibility. MGSG will need to generate visibility that sets them apart from the other local farmers that sell at the market. This in part will be done through the use of a colorful, distinct booth set-up that stands out among the other farmers. This visibility will create recognition for MGSG. This is important because the produce of the different farmers appears to be the same. The differences are discovered upon tasting the produce in your home. If MGSG stands out in terms of the booth appearance, the repeat customer will more easily make the connection between the unusual booth and MGSG’s product.
- Consistency. In addition to product consistency, MGSG will have consistency in regards to their presence at the farmer markets. It is much easier to build awareness and loyalty if people can reliably expect to see MGSG every week in the same place.
- Strategic relationships. This will be the key for restaurant sales. As stated before, restaurant sales are a consistent income that help reduce the seasonality of MGSG’s sales. Forming mutually beneficial, strategic partnership will be of upmost importance for building a good revenue base.
5.2.1 Sales Forecast
The first month will be used to set up the greenhouse and get things underway. There will not be sales activity until month three when the first greens will be sprouting. Month three will see a steady increase in production and sales, and this will continue until month nine when the consumer sales will be significantly decreasing due to the closing of the farmer markets. From month nine to 16 Mixed Greens Salad Gardens will have an increase in restaurant sales to offset the elimination of the consumer sales. By month 17, restaurant sales will decrease slightly to accommodate for the ramping up of consumer sales again.
Brought to you by
Create a professional business plan
Using AI and step-by-step instructions
Create Your PlanSecure funding
Validate ideas
Build a strategy


| Sales Forecast | |||
| Year 1 | Year 2 | Year 3 | |
| Sales | |||
| Individual Consumers | $23,154 | $40,519 | $70,908 |
| Restaurants | $58,558 | $81,981 | $114,774 |
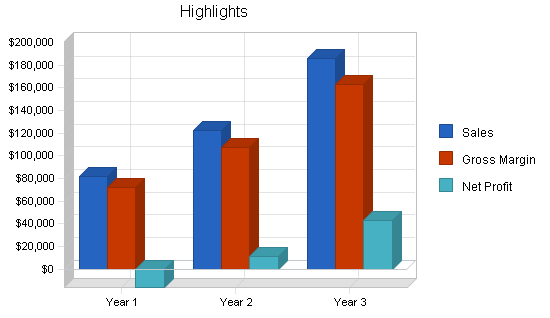
| Total Sales | $81,712 | $122,500 | $185,682 |
| Direct Cost of Sales | Year 1 | Year 2 | Year 3 |
| Individual Consumers | $2,778 | $4,862 | $8,509 |
| Restaurants | $7,027 | $9,838 | $13,773 |
| Subtotal Direct Cost of Sales | $9,805 | $14,700 | $22,282 |
5.3 Milestones
MGSG will have several milestones early on:
- Business plan completion. This will be done as a road map for the organization. While we do not need a business plan to raise capital, it will be an indispensable tool for the ongoing performance and improvement of the company.
- Greenhouse set-up.
- First batch of greens sold.
- The end of the consumer season and the ramping up of the restaurant supply cycle.
| Milestones | |||||
| Milestone | Start Date | End Date | Budget | Manager | Department |
| Business Plan Completion | 1/1/2001 | 1/1/2001 | $0 | Heidi | N/A |
| Greenhouse Setup | 1/1/2001 | 2/1/2001 | $0 | Heidi | N/A |
| First Batch of Greens Sold | 4/1/2001 | 4/1/2001 | $0 | everyone | N/A |
| End of the Consumer Season and the Ramping up of the Restaurant Supply Cycle | 9/1/2001 | 9/1/2001 | $0 | everyone | N/A |
| Totals | $0 | ||||
Management Summary
Heidi Ponic, founder and owner, first became interested in growing vegetables at the age of five. Heidi pursued her love for plants by obtaining a biology degree at the University of Washington. Throughout her last three years at Washington, she worked in a greenhouse that grew many different types of annuals. Upon graduation, Heidi went to work for a large grass seed manufacturer. Although the growing of grass seed proved to be far less interesting then most other plants, she was determined to get management experience, a skill set that she lacked. After two years at Willamette Seed Company, she enrolled in Oregon State University’s Masters of Horticulture program.
Having gone through the three years of the Masters program, she realized two things, 1) she needed to create a job/company for herself, 2) she should follow her passion and grow vegetables. These realizations were the final catalyst to pursue her lifelong dream of running her own greenhouse operation.
Heidi’s educational training and her passion creates the ideal combination for an owner of a start-up company.
6.1 Personnel Plan
The staff will consist of Heidi working full time. While the bulk of the time Heidi will spend managing the operation, she will always spend a few hours a week tending to the plants. In addition to all of the general management required for the production of the greens, Heidi will be setting up strategic relationships with local restaurants. Mixed Greens Salad Gardens will have hired two full-time gardeners beginning in the middle of the first month, and will hire a part-time helper by month four. The gardeners will be primarily responsible for the raising of the field greens, while the part-time help will be used to help staff the farmers market booth for the consumer selling of the greens.
| Personnel Plan | |||
| Year 1 | Year 2 | Year 3 | |
| Heidi | $24,000 | $24,000 | $24,000 |
| Gardener | $16,650 | $17,500 | $18,500 |
| Gardener | $16,650 | $17,500 | $18,500 |
| Part-time Helper | $0 | $9,000 | $9,500 |
| Part-time Helper | $6,750 | $0 | $9,000 |
| Total People | 4 | 5 | 6 |
| Total Payroll | $64,050 | $68,000 | $79,500 |
Financial Plan
The following sections will outline the important financial information.
7.1 Important Assumptions
The following table highlights some of the important financial assumptions.
| General Assumptions | |||
| Year 1 | Year 2 | Year 3 | |
| Plan Month | 1 | 2 | 3 |
| Current Interest Rate | 10.00% | 10.00% | 10.00% |
| Long-term Interest Rate | 10.00% | 10.00% | 10.00% |
| Tax Rate | 25.42% | 25.00% | 25.42% |
| Other | 0 | 0 | 0 |
7.2 Break-even Analysis
The Break-even Analysis below indicates the monthly sales needed to break even.

| Break-even Analysis | |
| Monthly Revenue Break-even | $8,294 |
| Assumptions: | |
| Average Percent Variable Cost | 12% |
| Estimated Monthly Fixed Cost | $7,299 |
7.3 Projected Profit and Loss
The following table will indicate projected profit and loss. Our losses at start-up are evident, as is the turn of the corner in July when we become profitable.


| Pro Forma Profit and Loss | |||
| Year 1 | Year 2 | Year 3 | |
| Sales | $81,712 | $122,500 | $185,682 |
| Direct Cost of Sales | $9,805 | $14,700 | $22,282 |
| Other | $0 | $0 | $0 |
| Total Cost of Sales | $9,805 | $14,700 | $22,282 |
| Gross Margin | $71,906 | $107,800 | $163,400 |
| Gross Margin % | 88.00% | 88.00% | 88.00% |
| Expenses | |||
| Payroll | $64,050 | $68,000 | $79,500 |
| Sales and Marketing and Other Expenses | $0 | $0 | $0 |
| Depreciation | $2,532 | $2,532 | $2,532 |
| Leased Equipment | $0 | $0 | $0 |
| Utilities | $3,000 | $3,000 | $3,000 |
| Insurance | $2,400 | $2,400 | $2,400 |
| Rent | $6,000 | $6,000 | $6,000 |
| Payroll Taxes | $9,608 | $10,200 | $11,925 |
| Other | $0 | $0 | $0 |
| Total Operating Expenses | $87,590 | $92,132 | $105,357 |
| Profit Before Interest and Taxes | ($15,683) | $15,668 | $58,043 |
| EBITDA | ($13,151) | $18,200 | $60,575 |
| Interest Expense | $370 | $140 | ($20) |
| Taxes Incurred | $0 | $3,882 | $14,758 |
| Net Profit | ($16,053) | $11,646 | $43,305 |
| Net Profit/Sales | -19.65% | 9.51% | 23.32% |
7.4 Projected Cash Flow
The following chart and table will indicate projected cash flow.

| Pro Forma Cash Flow | |||
| Year 1 | Year 2 | Year 3 | |
| Cash Received | |||
| Cash from Operations | |||
| Cash Sales | $32,685 | $49,000 | $74,273 |
| Cash from Receivables | $36,451 | $67,222 | $101,685 |
| Subtotal Cash from Operations | $69,136 | $116,223 | $175,958 |
| Additional Cash Received | |||
| Sales Tax, VAT, HST/GST Received | $0 | $0 | $0 |
| New Current Borrowing | $0 | $0 | $0 |
| New Other Liabilities (interest-free) | $0 | $0 | $0 |
| New Long-term Liabilities | $0 | $0 | $0 |
| Sales of Other Current Assets | $0 | $0 | $0 |
| Sales of Long-term Assets | $0 | $0 | $0 |
| New Investment Received | $0 | $0 | $0 |
| Subtotal Cash Received | $69,136 | $116,223 | $175,958 |
| Expenditures | Year 1 | Year 2 | Year 3 |
| Expenditures from Operations | |||
| Cash Spending | $64,050 | $68,000 | $79,500 |
| Bill Payments | $29,537 | $40,751 | $59,778 |
| Subtotal Spent on Operations | $93,587 | $108,751 | $139,278 |
| Additional Cash Spent | |||
| Sales Tax, VAT, HST/GST Paid Out | $0 | $0 | $0 |
| Principal Repayment of Current Borrowing | $2,400 | $2,400 | $800 |
| Other Liabilities Principal Repayment | $0 | $0 | $0 |
| Long-term Liabilities Principal Repayment | $0 | $0 | $0 |
| Purchase Other Current Assets | $0 | $0 | $0 |
| Purchase Long-term Assets | $0 | $0 | $0 |
| Dividends | $0 | $0 | $0 |
| Subtotal Cash Spent | $95,987 | $111,151 | $140,078 |
| Net Cash Flow | ($26,851) | $5,072 | $35,879 |
| Cash Balance | $7,849 | $12,920 | $48,800 |
7.5 Projected Balance Sheet
The following table will indicate the projected balance sheet.
| Pro Forma Balance Sheet | |||
| Year 1 | Year 2 | Year 3 | |
| Assets | |||
| Current Assets | |||
| Cash | $7,849 | $12,920 | $48,800 |
| Accounts Receivable | $12,576 | $18,854 | $28,578 |
| Inventory | $1,438 | $2,156 | $3,268 |
| Other Current Assets | $500 | $500 | $500 |
| Total Current Assets | $22,363 | $34,430 | $81,145 |
| Long-term Assets | |||
| Long-term Assets | $25,300 | $25,300 | $25,300 |
| Accumulated Depreciation | $2,532 | $5,064 | $7,596 |
| Total Long-term Assets | $22,768 | $20,236 | $17,704 |
| Total Assets | $45,131 | $54,666 | $98,849 |
| Liabilities and Capital | Year 1 | Year 2 | Year 3 |
| Current Liabilities | |||
| Accounts Payable | $3,084 | $3,373 | $5,051 |
| Current Borrowing | $2,600 | $200 | ($600) |
| Other Current Liabilities | $0 | $0 | $0 |
| Subtotal Current Liabilities | $5,684 | $3,573 | $4,451 |
| Long-term Liabilities | $0 | $0 | $0 |
| Total Liabilities | $5,684 | $3,573 | $4,451 |
| Paid-in Capital | $60,600 | $60,600 | $60,600 |
| Retained Earnings | ($5,100) | ($21,153) | ($9,507) |
| Earnings | ($16,053) | $11,646 | $43,305 |
| Total Capital | $39,447 | $51,093 | $94,398 |
| Total Liabilities and Capital | $45,131 | $54,666 | $98,849 |
| Net Worth | $39,447 | $51,093 | $94,398 |
7.6 Business Ratios
Business ratios for the years of this plan are shown below. Industry profile ratios based on the Standard Industrial Classification (SIC) code 0161, Lettuce Farms, as part of Vegetables and Melons, Not Elsewhere Classified, are shown for comparison.
| Ratio Analysis | ||||
| Year 1 | Year 2 | Year 3 | Industry Profile | |
| Sales Growth | 0.00% | 49.92% | 51.58% | -4.60% |
| Percent of Total Assets | ||||
| Accounts Receivable | 27.87% | 34.49% | 28.91% | 12.90% |
| Inventory | 3.19% | 3.94% | 3.31% | 14.40% |
| Other Current Assets | 1.11% | 0.91% | 0.51% | 28.90% |
| Total Current Assets | 49.55% | 62.98% | 82.09% | 56.20% |
| Long-term Assets | 50.45% | 37.02% | 17.91% | 43.80% |
| Total Assets | 100.00% | 100.00% | 100.00% | 100.00% |
| Current Liabilities | 12.59% | 6.54% | 4.50% | 31.10% |
| Long-term Liabilities | 0.00% | 0.00% | 0.00% | 20.50% |
| Total Liabilities | 12.59% | 6.54% | 4.50% | 51.60% |
| Net Worth | 87.41% | 93.46% | 95.50% | 48.40% |
| Percent of Sales | ||||
| Sales | 100.00% | 100.00% | 100.00% | 100.00% |
| Gross Margin | 88.00% | 88.00% | 88.00% | 32.00% |
| Selling, General & Administrative Expenses | 107.19% | 78.41% | 64.56% | 20.70% |
| Advertising Expenses | 0.00% | 0.00% | 0.00% | 0.20% |
| Profit Before Interest and Taxes | -19.19% | 12.79% | 31.26% | 1.70% |
| Main Ratios | ||||
| Current | 3.93 | 9.64 | 18.23 | 1.65 |
| Quick | 3.68 | 9.03 | 17.50 | 0.88 |
| Total Debt to Total Assets | 12.59% | 6.54% | 4.50% | 51.60% |
| Pre-tax Return on Net Worth | -40.70% | 30.39% | 61.51% | 2.20% |
| Pre-tax Return on Assets | -35.57% | 28.41% | 58.74% | 4.50% |
| Additional Ratios | Year 1 | Year 2 | Year 3 | |
| Net Profit Margin | -19.65% | 9.51% | 23.32% | n.a |
| Return on Equity | -40.70% | 22.79% | 45.88% | n.a |
| Activity Ratios | ||||
| Accounts Receivable Turnover | 3.90 | 3.90 | 3.90 | n.a |
| Collection Days | 56 | 78 | 78 | n.a |
| Inventory Turnover | 10.89 | 8.18 | 8.22 | n.a |
| Accounts Payable Turnover | 10.58 | 12.17 | 12.17 | n.a |
| Payment Days | 27 | 29 | 25 | n.a |
| Total Asset Turnover | 1.81 | 2.24 | 1.88 | n.a |
| Debt Ratios | ||||
| Debt to Net Worth | 0.14 | 0.07 | 0.05 | n.a |
| Current Liab. to Liab. | 1.00 | 1.00 | 1.00 | n.a |
| Liquidity Ratios | ||||
| Net Working Capital | $16,679 | $30,857 | $76,694 | n.a |
| Interest Coverage | -42.39 | 111.92 | 0.00 | n.a |
| Additional Ratios | ||||
| Assets to Sales | 0.55 | 0.45 | 0.53 | n.a |
| Current Debt/Total Assets | 13% | 7% | 5% | n.a |
| Acid Test | 1.47 | 3.76 | 11.08 | n.a |
| Sales/Net Worth | 2.07 | 2.40 | 1.97 | n.a |
| Dividend Payout | 0.00 | 0.00 | 0.00 | n.a |
Appendix
| Sales Forecast | |||||||||||||
| Month 1 | Month 2 | Month 3 | Month 4 | Month 5 | Month 6 | Month 7 | Month 8 | Month 9 | Month 10 | Month 11 | Month 12 | ||
| Sales | |||||||||||||
| Individual Consumers | 0% | $0 | $0 | $0 | $2,956 | $3,354 | $3,789 | $3,458 | $3,687 | $2,847 | $2,063 | $1,000 | $0 |
| Restaurants | 0% | $0 | $0 | $0 | $2,974 | $3,654 | $4,545 | $5,588 | $6,245 | $7,258 | $7,987 | $9,412 | $10,895 |
| Total Sales | $0 | $0 | $0 | $5,930 | $7,008 | $8,334 | $9,046 | $9,932 | $10,105 | $10,050 | $10,412 | $10,895 | |
| Direct Cost of Sales | Month 1 | Month 2 | Month 3 | Month 4 | Month 5 | Month 6 | Month 7 | Month 8 | Month 9 | Month 10 | Month 11 | Month 12 | |
| Individual Consumers | $0 | $0 | $0 | $355 | $402 | $455 | $415 | $442 | $342 | $248 | $120 | $0 | |
| Restaurants | $0 | $0 | $0 | $357 | $438 | $545 | $671 | $749 | $871 | $958 | $1,129 | $1,307 | |
| Subtotal Direct Cost of Sales | $0 | $0 | $0 | $712 | $841 | $1,000 | $1,086 | $1,192 | $1,213 | $1,206 | $1,249 | $1,307 | |
| Personnel Plan | |||||||||||||
| Month 1 | Month 2 | Month 3 | Month 4 | Month 5 | Month 6 | Month 7 | Month 8 | Month 9 | Month 10 | Month 11 | Month 12 | ||
| Heidi | 0% | $2,000 | $2,000 | $2,000 | $2,000 | $2,000 | $2,000 | $2,000 | $2,000 | $2,000 | $2,000 | $2,000 | $2,000 |
| Gardener | 0% | $700 | $1,450 | $1,450 | $1,450 | $1,450 | $1,450 | $1,450 | $1,450 | $1,450 | $1,450 | $1,450 | $1,450 |
| Gardener | 0% | $700 | $1,450 | $1,450 | $1,450 | $1,450 | $1,450 | $1,450 | $1,450 | $1,450 | $1,450 | $1,450 | $1,450 |
| Part-time Helper | 0% | $0 | $0 | $0 | $0 | $0 | $0 | $0 | $0 | $0 | $0 | $0 | $0 |
| Part-time Helper | 0% | $0 | $0 | $0 | $750 | $750 | $750 | $750 | $750 | $750 | $750 | $750 | $750 |
| Total People | 0 | 3 | 3 | 4 | 4 | 4 | 4 | 4 | 4 | 4 | 4 | 4 | |
| Total Payroll | $3,400 | $4,900 | $4,900 | $5,650 | $5,650 | $5,650 | $5,650 | $5,650 | $5,650 | $5,650 | $5,650 | $5,650 | |
| General Assumptions | |||||||||||||
| Month 1 | Month 2 | Month 3 | Month 4 | Month 5 | Month 6 | Month 7 | Month 8 | Month 9 | Month 10 | Month 11 | Month 12 | ||
| Plan Month | 1 | 2 | 3 | 4 | 5 | 6 | 7 | 8 | 9 | 10 | 11 | 12 | |
| Current Interest Rate | 10.00% | 10.00% | 10.00% | 10.00% | 10.00% | 10.00% | 10.00% | 10.00% | 10.00% | 10.00% | 10.00% | 10.00% | |
| Long-term Interest Rate | 10.00% | 10.00% | 10.00% | 10.00% | 10.00% | 10.00% | 10.00% | 10.00% | 10.00% | 10.00% | 10.00% | 10.00% | |
| Tax Rate | 30.00% | 25.00% | 25.00% | 25.00% | 25.00% | 25.00% | 25.00% | 25.00% | 25.00% | 25.00% | 25.00% | 25.00% | |
| Other | 0 | 0 | 0 | 0 | 0 | 0 | 0 | 0 | 0 | 0 | 0 | 0 | |
| Pro Forma Profit and Loss | |||||||||||||
| Month 1 | Month 2 | Month 3 | Month 4 | Month 5 | Month 6 | Month 7 | Month 8 | Month 9 | Month 10 | Month 11 | Month 12 | ||
| Sales | $0 | $0 | $0 | $5,930 | $7,008 | $8,334 | $9,046 | $9,932 | $10,105 | $10,050 | $10,412 | $10,895 | |
| Direct Cost of Sales | $0 | $0 | $0 | $712 | $841 | $1,000 | $1,086 | $1,192 | $1,213 | $1,206 | $1,249 | $1,307 | |
| Other | $0 | $0 | $0 | $0 | $0 | $0 | $0 | $0 | $0 | $0 | $0 | $0 | |
| Total Cost of Sales | $0 | $0 | $0 | $712 | $841 | $1,000 | $1,086 | $1,192 | $1,213 | $1,206 | $1,249 | $1,307 | |
| Gross Margin | $0 | $0 | $0 | $5,218 | $6,167 | $7,334 | $7,960 | $8,740 | $8,892 | $8,844 | $9,163 | $9,588 | |
| Gross Margin % | 0.00% | 0.00% | 0.00% | 88.00% | 88.00% | 88.00% | 88.00% | 88.00% | 88.00% | 88.00% | 88.00% | 88.00% | |
| Expenses | |||||||||||||
| Payroll | $3,400 | $4,900 | $4,900 | $5,650 | $5,650 | $5,650 | $5,650 | $5,650 | $5,650 | $5,650 | $5,650 | $5,650 | |
| Sales and Marketing and Other Expenses | $0 | $0 | $0 | $0 | $0 | $0 | $0 | $0 | $0 | $0 | $0 | $0 | |
| Depreciation | $211 | $211 | $211 | $211 | $211 | $211 | $211 | $211 | $211 | $211 | $211 | $211 | |
| Leased Equipment | $0 | $0 | $0 | $0 | $0 | $0 | $0 | $0 | $0 | $0 | $0 | $0 | |
| Utilities | $250 | $250 | $250 | $250 | $250 | $250 | $250 | $250 | $250 | $250 | $250 | $250 | |
| Insurance | $200 | $200 | $200 | $200 | $200 | $200 | $200 | $200 | $200 | $200 | $200 | $200 | |
| Rent | $500 | $500 | $500 | $500 | $500 | $500 | $500 | $500 | $500 | $500 | $500 | $500 | |
| Payroll Taxes | 15% | $510 | $735 | $735 | $848 | $848 | $848 | $848 | $848 | $848 | $848 | $848 | $848 |
| Other | $0 | $0 | $0 | $0 | $0 | $0 | $0 | $0 | $0 | $0 | $0 | $0 | |
| Total Operating Expenses | $5,071 | $6,796 | $6,796 | $7,659 | $7,659 | $7,659 | $7,659 | $7,659 | $7,659 | $7,659 | $7,659 | $7,659 | |
| Profit Before Interest and Taxes | ($5,071) | ($6,796) | ($6,796) | ($2,440) | ($1,491) | ($325) | $302 | $1,082 | $1,234 | $1,186 | $1,504 | $1,929 | |
| EBITDA | ($4,860) | ($6,585) | ($6,585) | ($2,229) | ($1,280) | ($114) | $513 | $1,293 | $1,445 | $1,397 | $1,715 | $2,140 | |
| Interest Expense | $40 | $38 | $37 | $35 | $33 | $32 | $30 | $28 | $27 | $25 | $23 | $22 | |
| Taxes Incurred | $0 | $0 | $0 | $0 | $0 | $0 | $0 | $0 | $0 | $0 | $0 | $0 | |
| Net Profit | ($5,111) | ($6,834) | ($6,833) | ($2,475) | ($1,525) | ($356) | $272 | $1,053 | $1,207 | $1,161 | $1,481 | $1,907 | |
| Net Profit/Sales | 0.00% | 0.00% | 0.00% | -41.75% | -21.76% | -4.27% | 3.01% | 10.61% | 11.95% | 11.55% | 14.22% | 17.51% | |
Brought to you by
Create a professional business plan
Using AI and step-by-step instructions
Create Your PlanSecure funding
Validate ideas
Build a strategy
| Pro Forma Cash Flow | |||||||||||||
| Month 1 | Month 2 | Month 3 | Month 4 | Month 5 | Month 6 | Month 7 | Month 8 | Month 9 | Month 10 | Month 11 | Month 12 | ||
| Cash Received | |||||||||||||
| Cash from Operations | |||||||||||||
| Cash Sales | $0 | $0 | $0 | $2,372 | $2,803 | $3,334 | $3,618 | $3,973 | $4,042 | $4,020 | $4,165 | $4,358 | |
| Cash from Receivables | $0 | $0 | $0 | $0 | $119 | $3,579 | $4,231 | $5,015 | $5,445 | $5,963 | $6,062 | $6,037 | |
| Subtotal Cash from Operations | $0 | $0 | $0 | $2,372 | $2,922 | $6,913 | $7,850 | $8,987 | $9,487 | $9,983 | $10,227 | $10,395 | |
| Additional Cash Received | |||||||||||||
| Sales Tax, VAT, HST/GST Received | 0.00% | $0 | $0 | $0 | $0 | $0 | $0 | $0 | $0 | $0 | $0 | $0 | $0 |
| New Current Borrowing | $0 | $0 | $0 | $0 | $0 | $0 | $0 | $0 | $0 | $0 | $0 | $0 | |
| New Other Liabilities (interest-free) | $0 | $0 | $0 | $0 | $0 | $0 | $0 | $0 | $0 | $0 | $0 | $0 | |
| New Long-term Liabilities | $0 | $0 | $0 | $0 | $0 | $0 | $0 | $0 | $0 | $0 | $0 | $0 | |
| Sales of Other Current Assets | $0 | $0 | $0 | $0 | $0 | $0 | $0 | $0 | $0 | $0 | $0 | $0 | |
| Sales of Long-term Assets | $0 | $0 | $0 | $0 | $0 | $0 | $0 | $0 | $0 | $0 | $0 | $0 | |
| New Investment Received | $0 | $0 | $0 | $0 | $0 | $0 | $0 | $0 | $0 | $0 | $0 | $0 | |
| Subtotal Cash Received | $0 | $0 | $0 | $2,372 | $2,922 | $6,913 | $7,850 | $8,987 | $9,487 | $9,983 | $10,227 | $10,395 | |
| Expenditures | Month 1 | Month 2 | Month 3 | Month 4 | Month 5 | Month 6 | Month 7 | Month 8 | Month 9 | Month 10 | Month 11 | Month 12 | |
| Expenditures from Operations | |||||||||||||
| Cash Spending | $3,400 | $4,900 | $4,900 | $5,650 | $5,650 | $5,650 | $5,650 | $5,650 | $5,650 | $5,650 | $5,650 | $5,650 | |
| Bill Payments | $50 | $1,507 | $1,723 | $1,775 | $3,310 | $2,836 | $2,988 | $3,011 | $3,132 | $3,058 | $3,024 | $3,120 | |
| Subtotal Spent on Operations | $3,450 | $6,407 | $6,623 | $7,425 | $8,960 | $8,486 | $8,638 | $8,661 | $8,782 | $8,708 | $8,674 | $8,770 | |
| Additional Cash Spent | |||||||||||||
| Sales Tax, VAT, HST/GST Paid Out | $0 | $0 | $0 | $0 | $0 | $0 | $0 | $0 | $0 | $0 | $0 | $0 | |
| Principal Repayment of Current Borrowing | $200 | $200 | $200 | $200 | $200 | $200 | $200 | $200 | $200 | $200 | $200 | $200 | |
| Other Liabilities Principal Repayment | $0 | $0 | $0 | $0 | $0 | $0 | $0 | $0 | $0 | $0 | $0 | $0 | |
| Long-term Liabilities Principal Repayment | $0 | $0 | $0 | $0 | $0 | $0 | $0 | $0 | $0 | $0 | $0 | $0 | |
| Purchase Other Current Assets | $0 | $0 | $0 | $0 | $0 | $0 | $0 | $0 | $0 | $0 | $0 | $0 | |
| Purchase Long-term Assets | $0 | $0 | $0 | $0 | $0 | $0 | $0 | $0 | $0 | $0 | $0 | $0 | |
| Dividends | $0 | $0 | $0 | $0 | $0 | $0 | $0 | $0 | $0 | $0 | $0 | $0 | |
| Subtotal Cash Spent | $3,650 | $6,607 | $6,823 | $7,625 | $9,160 | $8,686 | $8,838 | $8,861 | $8,982 | $8,908 | $8,874 | $8,970 | |
| Net Cash Flow | ($3,650) | ($6,607) | ($6,823) | ($5,253) | ($6,238) | ($1,773) | ($989) | $126 | $505 | $1,074 | $1,352 | $1,425 | |
| Cash Balance | $31,050 | $24,443 | $17,619 | $12,366 | $6,128 | $4,354 | $3,366 | $3,492 | $3,997 | $5,072 | $6,424 | $7,849 | |
| Pro Forma Balance Sheet | |||||||||||||
| Month 1 | Month 2 | Month 3 | Month 4 | Month 5 | Month 6 | Month 7 | Month 8 | Month 9 | Month 10 | Month 11 | Month 12 | ||
| Assets | Starting Balances | ||||||||||||
| Current Assets | |||||||||||||
| Cash | $34,700 | $31,050 | $24,443 | $17,619 | $12,366 | $6,128 | $4,354 | $3,366 | $3,492 | $3,997 | $5,072 | $6,424 | $7,849 |
| Accounts Receivable | $0 | $0 | $0 | $0 | $3,558 | $7,644 | $9,065 | $10,261 | $11,206 | $11,824 | $11,891 | $12,076 | $12,576 |
| Inventory | $0 | $0 | $0 | $0 | $783 | $942 | $1,100 | $1,194 | $1,311 | $1,334 | $1,327 | $1,374 | $1,438 |
| Other Current Assets | $500 | $500 | $500 | $500 | $500 | $500 | $500 | $500 | $500 | $500 | $500 | $500 | $500 |
| Total Current Assets | $35,200 | $31,550 | $24,943 | $18,119 | $17,207 | $15,213 | $15,020 | $15,321 | $16,509 | $17,655 | $18,789 | $20,374 | $22,363 |
| Long-term Assets | |||||||||||||
| Long-term Assets | $25,300 | $25,300 | $25,300 | $25,300 | $25,300 | $25,300 | $25,300 | $25,300 | $25,300 | $25,300 | $25,300 | $25,300 | $25,300 |
| Accumulated Depreciation | $0 | $211 | $422 | $633 | $844 | $1,055 | $1,266 | $1,477 | $1,688 | $1,899 | $2,110 | $2,321 | $2,532 |
| Total Long-term Assets | $25,300 | $25,089 | $24,878 | $24,667 | $24,456 | $24,245 | $24,034 | $23,823 | $23,612 | $23,401 | $23,190 | $22,979 | $22,768 |
| Total Assets | $60,500 | $56,639 | $49,821 | $42,786 | $41,663 | $39,458 | $39,054 | $39,144 | $40,121 | $41,056 | $41,979 | $43,353 | $45,131 |
| Liabilities and Capital | Month 1 | Month 2 | Month 3 | Month 4 | Month 5 | Month 6 | Month 7 | Month 8 | Month 9 | Month 10 | Month 11 | Month 12 | |
| Current Liabilities | |||||||||||||
| Accounts Payable | $0 | $1,450 | $1,666 | $1,664 | $3,216 | $2,736 | $2,888 | $2,907 | $3,030 | $2,958 | $2,921 | $3,014 | $3,084 |
| Current Borrowing | $5,000 | $4,800 | $4,600 | $4,400 | $4,200 | $4,000 | $3,800 | $3,600 | $3,400 | $3,200 | $3,000 | $2,800 | $2,600 |
| Other Current Liabilities | $0 | $0 | $0 | $0 | $0 | $0 | $0 | $0 | $0 | $0 | $0 | $0 | $0 |
| Subtotal Current Liabilities | $5,000 | $6,250 | $6,266 | $6,064 | $7,416 | $6,736 | $6,688 | $6,507 | $6,430 | $6,158 | $5,921 | $5,814 | $5,684 |
| Long-term Liabilities | $0 | $0 | $0 | $0 | $0 | $0 | $0 | $0 | $0 | $0 | $0 | $0 | $0 |
| Total Liabilities | $5,000 | $6,250 | $6,266 | $6,064 | $7,416 | $6,736 | $6,688 | $6,507 | $6,430 | $6,158 | $5,921 | $5,814 | $5,684 |
| Paid-in Capital | $60,600 | $60,600 | $60,600 | $60,600 | $60,600 | $60,600 | $60,600 | $60,600 | $60,600 | $60,600 | $60,600 | $60,600 | $60,600 |
| Retained Earnings | ($5,100) | ($5,100) | ($5,100) | ($5,100) | ($5,100) | ($5,100) | ($5,100) | ($5,100) | ($5,100) | ($5,100) | ($5,100) | ($5,100) | ($5,100) |
| Earnings | $0 | ($5,111) | ($11,945) | ($18,778) | ($21,253) | ($22,778) | ($23,134) | ($22,862) | ($21,809) | ($20,602) | ($19,441) | ($17,961) | ($16,053) |
| Total Capital | $55,500 | $50,389 | $43,555 | $36,722 | $34,247 | $32,722 | $32,366 | $32,638 | $33,691 | $34,898 | $36,059 | $37,539 | $39,447 |
| Total Liabilities and Capital | $60,500 | $56,639 | $49,821 | $42,786 | $41,663 | $39,458 | $39,054 | $39,144 | $40,121 | $41,056 | $41,979 | $43,353 | $45,131 |
| Net Worth | $55,500 | $50,389 | $43,555 | $36,722 | $34,247 | $32,722 | $32,366 | $32,638 | $33,691 | $34,898 | $36,059 | $37,539 | $39,447 |


